The EUR/USD pair has almost completed the correction and right now forming a new descending impulse. Possibly, the price may reach 1.17954 and then grow towards 1.1816. After that, the instrument may resume falling to reach 1.1726. And that’s just a half of the wave with the local target at 1.1600.
GBP USD, “Great Britain Pound vs US Dollar”
The GBP/USD pair has broken the consolidation channel downwards and right now is still falling. The local target of the wave is at 1.3050. Later, in our opinion, the market may be corrected towards 1.3131 and then continue falling inside the downtrend with the target at 1.2920.
USD CHF, “US Dollar vs Swiss Franc”
The USD/CHF pair has finished the correction along with the ascending impulse to break 0.9836, and right now is being corrected. We think, today the price may fall towards 0.9800. After that, the instrument may continue growing with the target at 0.9931.
USD JPY, “US Dollar vs Japanese Yen”
The USD/JPY pair is moving upwards. Possibly, the price may choose an alternative scenario and grow towards 114.08. According to the main scenario, the market may fall to reach 111.35.
AUD USD, “Australian Dollar vs US Dollar”
The AUD/USD pair is still consolidating above 0.7821. If later the instrument breaks this range to the upside, the market may grow and reach 0.7925; if to the downside – resume falling inside the downtrend towards the local target at 0.7750.
USD RUB, “US Dollar vs Russian Ruble”
The USD/RUB pair is trading below 57.54 and may continue the correction to reach 57.86. Later, in our opinion, the market may continue falling inside the downtrend towards the local target at 56.65.
XAU USD, “Gold vs US Dollar”
Gold has returned to 1288.80, rebounded from it downwards, and right now is still falling. Possibly, the price may fall to reach 1270.70 and then trade to the upside with the target at 1288.80.
BRENT
Brent has completed the correction. We think, today the price may grow to break the descending correctional channel. After that, the instrument may break the channel and continue moving upwards with the target at 58.90. Later, in our opinion, the market may fall towards 57.80 and then start another growth to reach 59.50.
Attention! Forecasts presented in this section only reflect the author’s private opinion and should not be considered as guidance for trading. RoboForex LP bears no responsibility for trading results based on trading recommendations described in these analytical reviews.
Why these “trivial” indicators are actually historic red flags
By Elliott Wave International
Many investors see almost no risk in the stock market. Indeed, they are betting to a record degree that the stock market will continue to rise. In EWI’s view, here’s what this extreme financial optimism strongly suggests.
Learn to Use Sentiment to Time Your Investments Better
In this 14-minute video, you’ll learn how to combine Elliott wave analysis with extremes in market sentiment to reliably anticipate turning points in the markets. EWI Chief Market Analyst Steve Hochberg explains using an example in gold.
This article was syndicated by Elliott Wave International and was originally published under the headline How to Tell the “Size of the Forming Top” in U.S. Stocks. EWI is the world’s largest market forecasting firm. Its staff of full-time analysts led by Chartered Market Technician Robert Prechter provides 24-hour-a-day market analysis to institutional and private investors around the world.
The Federal Reserve said the pace of growth in the U.S. was “split between modest and moderate” in its latest snapshot of the economy known as the Beige Book. The report covers August 29 to October 6.
A stable economy and the tightest labor market in years, however, did little to move the needle on inflation. The Fed characterized the increase in wages and the cost of materials as “modest.”
Spain’s central government said on Thursday it would suspend Catalonia’s autonomy and impose direct rule after the region’s leader threatened to go ahead with a formal declaration of independence if Madrid refused to hold talks. The euro climbed to a one-week high on Thursday as investors shrugged off political uncertainty emerging from Spain before a central bank meeting next week where policymakers are expected to reveal plans to unwind their multi-year stimulus policies.
The European Central Bank is widely expected to announce the bulk of its tapering decision next week. Inflation remains stubbornly below target, but solid and broadening economic growth is increasing the central bank’s confidence that underlying price pressure will eventually embark on a clearer recovery. Over the last few days, several speeches have provided important hints about the Governing Council discussion at the upcoming policy meeting. We think that within the current QE parameters, the Governing Council could decide to spread the residual firepower over a longer period of time and at a slower monthly pace.
We expect net asset purchases to be carried out at a monthly pace of EUR 30bn from January to the end of 2018. This should be more in line with ECB chief economist Peter Praet’s statement that, under more-normal market conditions, the purchases can be executed over a more extended time interval (as opposed to being frontloaded) because investors have become “more patient”. Given that the last two purchase windows have been of six and nine months, the next step could well be of twelve months – if not, it should be at least nine months.
Risks to the above-mentioned scenario remain tilted towards lower purchases, mainly due to scarcity issues. Unsurprisingly, the latest ECB speeches continue to indicate that there is no appetite for changes to any of the key parameters of the program. This makes self-imposed limits a binding constraint over the course of 2018. Our estimate of EUR 360bn in net asset purchases next year assumes that the ECB would be able to meaningfully step up purchases of German state bonds, which, however, is a rather illiquid market. If the ECB does not feel confident that will be possible, it would have to settle for a smaller dose of additional QE.
Technical analysis and trading signals:
Long lower shadow on yesterday’s candlestick, the rebound above the neckline of head-and-shoulders pattern and today’s continuation of the upward move suggest that short-term momentum is getting bullish.
That’s good news for our long EUR/USD position. We do not change anything in our trading strategy. We stay bullish for 1.2400.
NZD/USD: Jacinda Ardern to be next Prime Minister of New Zealand
Macroeconomic overview:
Labour Party leader Jacinda Ardern will be the new Prime Minister of New Zealand. Winston Peters, the leader of the small New Zealand First party which emerged as the kingmaker from the September 23 vote, ended weeks of political guessing games. He agreed to form a new government with Labour Party, ending the National Party’s decade in power.
The announcement of the new government drove the New Zealand dollar down to its lowest levels in four and half months, as markets worried about more protectionist policies to come. Labour said it would stick to its campaign promise to change the central bank’s mandate, seek to renegotiate the Trans-Pacific Partnership trade deal and prioritize an effort to ban foreign ownership of certain types of housing.
Record net migration of more than 70k annually has fuelled demand for housing in New Zealand, far outstripping supply and pushing house prices prohibitively higher, pricing ordinary New Zealanders out of the housing market.
It has said it wants to add employment to the central bank’s mandate, which would mark a big change for the Reserve Bank of New Zealand which was the pioneer of the inflation-targeting regime adopted across the world.
New Zealand First leader Winston Peters, who has been offered the role of deputy prime minister, said new policy announcements would be up to Ardern, but gave a foretaste of what may come by saying he expected fewer immigrants to be allowed into New Zealand.
Markets are concerned about uncertainty. They worry that curbs to migration and trade could hurt two key sources of New Zealand’s robust growth in recent years. More restrictive trade and foreign ownership could also hurt New Zealand’s reputation as an open economy and antagonize the likes of China, a key trading partner. As a result, the NZD/USD dropped to a near 4-1/2 month low.
Technical analysis and trading signal:
The NZD/USD broke below 61.8% fibo of May-July rise and October lows, which opens the way to full retracement of summer move. However, today’s move is the result of political events and it is hard to say whether it will be continued in the coming sessions.
Despite higher political uncertainty we think that long-term outlook for the NZD/USD remains bullish on improving demand from China and rising commodities prices.
We stay sideways now, but will be looking to use current dips to open a long position soon.
VIP Traders Club members should expect to receive forex and precious metals trading signals updates at least twice a day. We will send you:
Suggested position size that you can easily adjust to your trading account size – this would help you in risk management and you will survive longer drawdown periods
Early heads-up about the potential trading opportunities or rationale to taken positions ( fundamental analysis, technical analysis )
Forecasts of most important macroeconomic indicators prepared by our economists and econometricians.
The EUR/USD pair has been corrected upwards to return to 1.1813. We think, today the price may continue falling to reach the target at 1.1676.
GBP USD, “Great Britain Pound vs US Dollar”
The GBP/USD pair is being corrected towards 1.3246. Possibly, today the price may complete the correction and continue falling inside the downtrend with the target at 1.2965.
USD CHF, “US Dollar vs Swiss Franc”
The USD/CHF pair has tested 0.9836 again. We think, today the price may be corrected towards 0.9770. After that, the instrument may continue growing with the local target at 0.9872.
USD JPY, “US Dollar vs Japanese Yen”
The USD/JPY pair has completed the correction and right now is consolidating at the top of it. Possibly, today the price may fall towards 112.22 and then grow to reach 112.60. Later, in our opinion, the market may be start another descending wave with the target at 111.40.
AUD USD, “Australian Dollar vs US Dollar”
The AUD/USD pair has formed another consolidation range. If later the instrument breaks this range to the upside, the market may grow and reach 0.7925; if to the downside – resume falling inside the downtrend towards 0.7680.
USD RUB, “US Dollar vs Russian Ruble”
The USD/RUB pair is trading below 57.54 and may continue falling inside the downtrend towards 56.65. Possibly, today the price may reach 57.65 and then resume moving downwards with the local target at 56.65.
XAU USD, “Gold vs US Dollar”
Gold has broken the consolidation range downwards. Possibly, the price may fall to reach 1272. After that, the instrument may be corrected towards 1289 and then trade to the downside with the target at 1260.
BRENT
Brent is still consolidating; right now, it’s trading above 57.50. If later the instrument breaks this range to the upside, the market may grow and reach 58.90; if to the downside – fall towards 56.81 and then resume growing inside the uptrend with the target at 59.50.
Attention! Forecasts presented in this section only reflect the author’s private opinion and should not be considered as guidance for trading. RoboForex LP bears no responsibility for trading results based on trading recommendations described in these analytical reviews.
As we can see at the H4 chart, after being corrected by 50.0%, the XAU/USD pair started forming a new descending impulse. However, the scenario, which implies that the downtrend may continue, is rather questionable. To continue falling, the price has to break the local low at 1260.79 and then it may probably reach the post-correctional extension area between the retracements of 138.2% and 161.8% at 1244.00 and 1233.00 respectively. The more probable scenario suggests that the instrument may resume moving upwards to reach the retracement of 50.0%, 61.8%, and 76.0% at 1309.04, 1320.37, and 1334.26 respectively.
At the H1 chart, the pair is forming the convergence, which may indicate a reverse to the upside. The targets of this possible uptrend are inside the area between the retracements of 23.6% and 76.0% at 1283.50 and 1299.08 respectively. After breaking the local high at 1306.22, the instrument may grow towards the post-correctional extension area between the retracements of 138.2% and 161.8% at 1317.38 and 1324.74 respectively.
USD CHF, “US Dollar vs Swiss Franc”
As we can see at the daily chart, the USD/CHF pair has already been corrected to the upside by 38.2% and may continue growing towards the retracements of 50.0% and 61.8% at 0.9881 and 0.9989 respectively.
At the H4 chart, we can see that after finishing the divergence, the pair has already been corrected by 23.6% and tried to test the high. If the price breaks the local high, it may reach the post-correctional extension area between the retracements of 138.2% and 161.8% at 0.9880 and 0.9909 respectively. However, if the instrument fails to break the high, the correction may continue towards the retracements of 38.2% and 50.0% at 0.9678 and 0.9628 respectively.
Attention! Forecasts presented in this section only reflect the author’s private opinion and should not be considered as guidance for trading. RoboForex LP bears no responsibility for trading results based on trading recommendations described in these analytical reviews.
On Wednesday the 18th of October, trading on the euro/dollar pair closed up. After hitting a new weekly low, the price mounted a recovery to 1.1817 that extended into the Asian session. I can’t see any fundamental factors that would have caused the euro’s 87-pip rally. I reckon the price underwent a correction on the longer timeframes.
Newswires are reporting that the euro’s rally was the result of expectations that at this month’s ECB meeting, Mario Draghi will announce a reduction in the regulator’s asset purchasing program effective from January 2018. We could see the regulator reduce the volume of purchases, but extend the overall duration of the program. So, will this be good or bad for the euro? I think it best not to overthink this question. We should just play it as it comes.
Fig 1. EURUSD rate on the hourly. Source: TradingView
The euro/dollar rate ricocheted from 1.1730 to 1.1817. The surge gathered pace after a breakout of the A-A channel and the 1.1781 top. I wrote yesterday that the H6 and H8 timeframes suggested the euro would strengthen against the dollar, while the H3 and H4 timeframe suggested the opposite. In the end, the price went down, and then traders started opening long positions.
The 67th degree provided some resistance. Accounting for the upwards movement from 1.1730, I reckon that when the European session opens, buyers will try to push the price up to 1.1830 to induce a reversal.
I’ve got two 45th degrees on my chart today. The first is at 1.1763 and the other at 1.1779. If the rate opens down in Europe without renewing the maximum, the target will remain at 1.1763. If the price follows this forecast, then after hitting a new high at 1.1830, the rate will slide to 1.1779.
Yesterday’s bounce has created some doubts over whether the head and shoulders formation on the daily timeframe will be realised. For it to complete its formation, sellers need to return to 1.1779 as quickly as possible.
Today’s biggest outlier is the Kiwi dollar (-0.81%). It could drag some of the other majors down with it, including the euro. US 10Y bond yields are growing, which is a positive for the US dollar. The situation on the euro/pound cross is 50/50. At the time of writing, the euro is trading up against all the majors.
Yes, much has recently been published about the 10-year anniversary of the 2007~08 credit market crash and many people are trying to make comparisons between then and now. Some of this information is valid and factual. For example, the amount of debt now is much higher than the debt levels in 2004~08. This would lead some to consider the scope of any global debt related issues to be much larger and more dangerous than in 2007. Additionally, the types of levels of debt have begun to froth back into the dangerous and risky derivatives markets, ARMs and MBSs. Although, we keep hearing, “this time it’s different”.
Last week ActiveTradingPartners.com published a research document that illustrated some of our newest modeling tools. The consensus analysis was that the bullish trend should continue for a while still, yet it will likely be more moderate in nature. Price volatility should continue to expand over the next few weeks as price rotation becomes more evident. There is a potential near October 12th and October 30th for a volatility spike to happen in the markets. This, most likely, would result in a moderately deep price correction or rollover. Overall, we remain cautiously bullish for the US majors and continue to be wary of weakness that may creep into the markets. In other words, we continue to believe the markets will continue to attempt to push higher for a few more weeks at least – yet we are very cautious of any potential weakness or extended volatility because we believe this market could turn on a dime.
There are a number of factors that are starting to affect the markets going forward. Two of the most critical are uncertainty with regards to geo-politicial events and leadership and the other is the global central banks. Right now, it appears everyone is living high on the debt cycles that have been perpetuated over the past 8+ years as well as the run in asset valuations (homes, land, equities and others). This run has created a scenario where many people, many of them the under 40yo millennials, have leveraged themselves quite extensively with student loans, auto loans, home loans, credit card and other revolving debt. These are, in our opinion, the segment of the consumer market that will be the early warning signs for any new crisis.
Rather than go into detail regarding debt levels and delinquencies that are stacking up all over the globe, we will focus on the most simple concept for investors to identify – the failed top rotation of 2007 and how it will likely relate to current price activity.
The failed top rotation in 2007 formed after an extended run higher and as volatility began to increase dramatically. We believe a similar type of top formation will likely form in the US markets should any new rotational trend reversal form over the next few weeks/months. This also falls in line with our “moderate bullish trend – yet cautious” analysis of the current trend. Take a look at this chart of the NASDAQ in 2007-08 and pay attention to the price rotation that occurred over 4~6 months before the crisis event really began to unfold.
In comparison, take a look at the most recent NQ data for 2017. The length of the moves on the current chart are extended (span a greater amount of time), yet the moves are very similar. The double-bottom formation in early 2017 is unique and identifies key support near 5550. Any similar failed top formation would begin with increased price volatility, resulting in a VIX Spike, as well as the expanded price congestion that is associated with higher volume repositioning in the markets. Notice that in 2007, the volume suddenly spiked higher near the middle of October as the volatility expanded. We would expect to see the same thing happen currently if this failed top pattern unfolds again.
As many of you are aware, it is impossible to accurately time and predict major tops/bottoms in the markets. The best we can hope for is to be aware of potential events before they happen and to be prepared. That is why we dedicate our research to delivering timely and accurate data to all ActiveTradingPartners.com members as well as delivering accurate trading signals and daily market commentary. ActiveTradingPartners.com is our premier solution for active traders who want to take advantage of timely and accurate market signals and turning points. Please take a moment to review our services for active traders.
In closing, we wanted to highlight one of the most concerning setups we can use to illustrate the potential for future volatility and price rotation in the US majors (and possibly global markets). The Metals markets are a key element in protecting against fear, inflation or deflation as well as major market collapse. When the metals markets are moving higher, there is typically a measured amount of fear or concern that is entering the markets. These types of moves can often be signs to investors that volatility or underlying events could be at play as smart money moves into long metals positions.
Our analysis of the Metals markets shows we are setting up for a Wave 5 move higher which we believe could be a very dramatic move.
If you would like to know what ATP is all about and if you like this type of market analysis/research, then visit our web site today to learn how we help active traders understand the markets, actively trade and generate profits. The markets won’t wait for you to decide when to protect your positions. Isn’t it time you invested in your future success with www.ActiveTradingPartners.com
In order to be aware of the investment pitfalls and opportunities that deflation can bring, we must first understand the basic elements of why it occurs. So our challenge is to try and make monetary economics, a subject that most people would find duller than watching paint dry on a wall, understandable and, dare I say it, fun! It’s a big ask but we like a test, and so here is the first in our Deflation Basics Series — The Quantity Theory of Money.
The Quantity Theory of Money (QTM for short) is the very essence of the true definition of inflation and deflation. You see, most people think of inflation and deflation as the rise and fall or prices when it is actually all about the rise and fall of the quantity of money.
The QTM has its origins in the 16th century and the writings of the Prussian polymath Nicolaus Copernicus as well as followers of the School of Salamanca such as Martín de Azpilcueta. As European nations looted the Americas for gold and silver, an increase in the price of goods in general was noted as the metals were brought back to the Old World. This observation, via the writings of, among others, John Locke, David Hume, John Stuart Mill and Ludwig von Mises, led to a link between the quantity of money in an economy and the level of the price of goods.
QTM is the cornerstone of monetarist economics which was largely developed by Milton Friedman, gaining popularity during the 1970s. Put simply, the Quantity Theory of Money can be expressed as the “Equation of Exchange”:
In plain speak, the amount of money in an economy multiplied by the number of times that money is used, equals the price of stuff bought multiplied by the amount of stuff bought.
Let’s take a simple example.
If an economy has $1,000 in total and that money is turned over 3 times during a month, total spending equals $3,000 that month. If the amount of stuff bought was 100 items, then the average price of each item would be $3,000 divided by 100 which equals $30.
We can re-arrange the Equation of Exchange to solve for the price level, P:
Therefore, in our economy:
Now let’s assume that, the next month, money supply increases from $1,000 to $2,000, with the velocity of money and the amount of stuff bought staying the same. What would be the effect on the average price level?
The average price level has gone up from $30 to $60. The average price of goods has gone up due to the inflation of the money supply.
The next month, the money supply decreases from $2,000 to $500, with the velocity of money and the amount of stuff bought staying the same. What would be the effect on the average price level now?
The average price level has gone down from $60 to $15. The average price of goods has gone down due to the deflation of the money supply.
This basic example shows the relationship between the level of the money supply in an economy and the average level of prices. The catch comes, of course, with the old economics chestnut, the Latin phrase ceteris paribus (all other things being equal). In the ivory towers of academic economics all other things can remain equal, but in the real world, they don’t.
So our assumptions in the example above that the velocity of money remained at 3 and that the amount of stuff bought remained at 100 would have to be challenged. In fact, one of the main criticisms of the QTM is that the velocity of money does not remain constant and changes due to the vagaries of spending impulses. However, if money supply didn’t change but the velocity of money went down instead, the effect is the same — lower prices (assuming the amount of stuff bought remained the same that is!).
Monetarists in the 1980s thought that, by targeting money supply growth, the level of goods and service prices in an economy could be controlled. However, although there is a link between the general level of prices in an economy and the amount of money, it is not rigid, and prices can move up and down for a myriad of reasons.
Nevertheless, the general relationship in the Quantity Theory of Money stands. More money in an economy (inflation) tends to lead to higher prices and less money (deflation) tends to lead to lower prices.
What You Need to Know NOW About Protecting Yourself from Deflation
The best way to protect yourself from deflation is to first understand what it is. In this free, special report, you’ll learn about this unexpected risk and what it can do to your portfolio. You’ll also get 29 specific forecasts for stocks, real estate, gold and new cultural trends, to help you prepare and protect your wealth.
Quantitative Easing (QE) changed the bond markets in ways many don’t realize. And now that QE is unwinding, investing in bonds comes with pitfalls that are too risky to overlook. This new resource from EWI’s Murray Gunn offers insights you don’t want to miss. Get your free report, Your Bond Fund: It’s Riskier Than You Think.
This article was syndicated by Elliott Wave International and was originally published under the headline Deflation Basics Series: The Quantity Theory of Money. EWI is the world’s largest market forecasting firm. Its staff of full-time analysts led by Chartered Market Technician Robert Prechter provides 24-hour-a-day market analysis to institutional and private investors around the world.
At the H4 chart, the EUR/USD pair is expected to test the support at the 0/8 level at 1.1718, rebound from it, and then resume growing towards the 3/8 one at 1.1901. However, if the price breaks the 1/8 level at 1.1779, it won’t test the 0/8 one.
At the H1 chart, the pair may test the 0/8 level at 1.1718. However, if the price breaks the 2/8 level at 1.1779, this scenario may be cancelled and the instrument may moving upwards to reach 1.1901.
At the M15 chart, the pair may break the upside line of the VoltyChannel indicator and, as a result, continue growing to reach 1.1901.
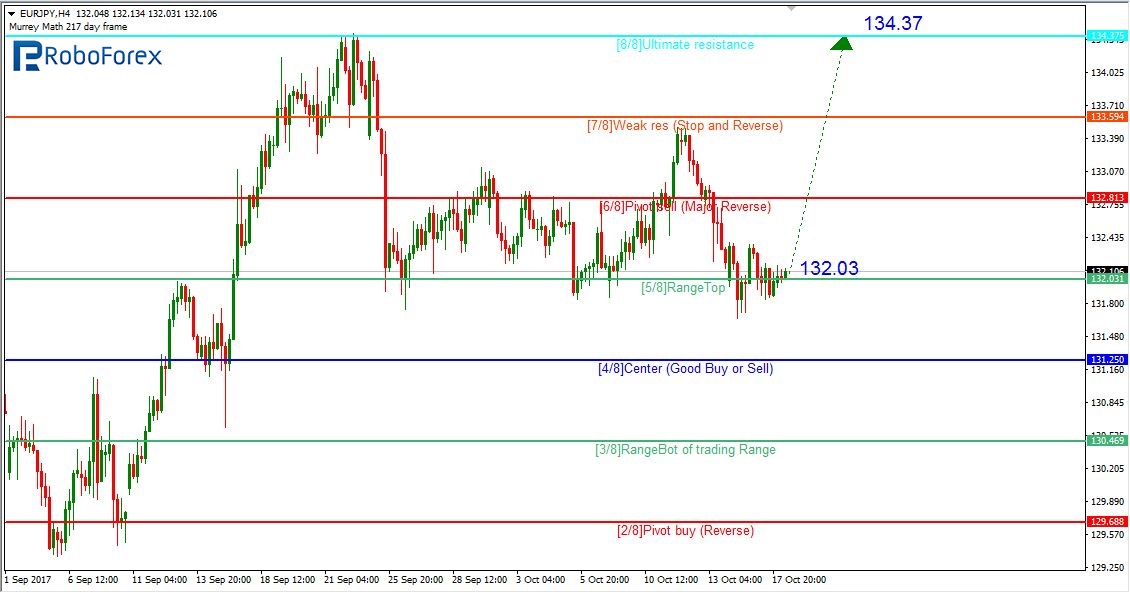
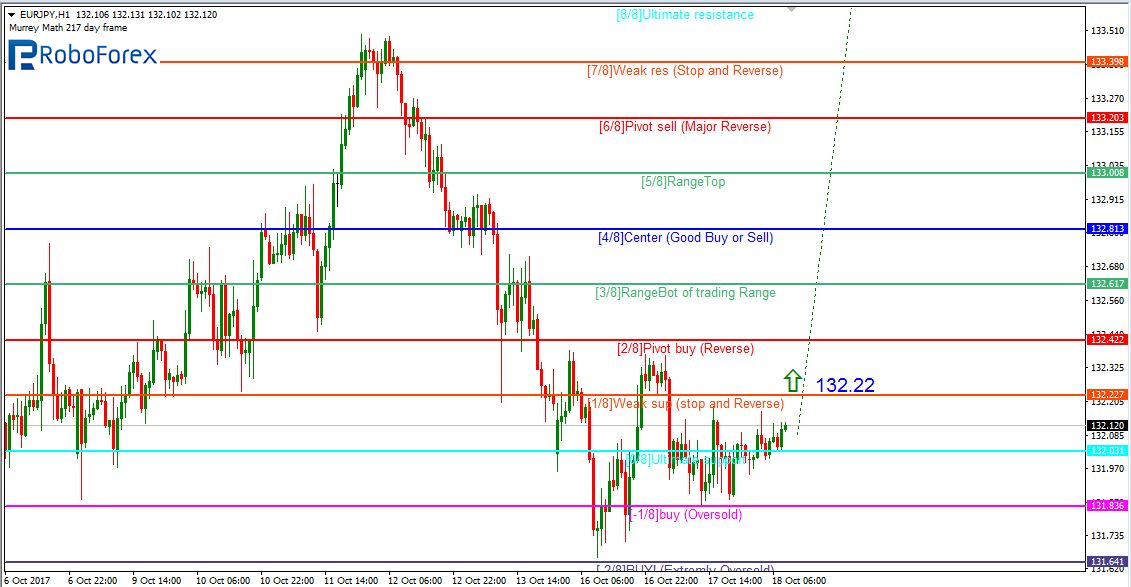
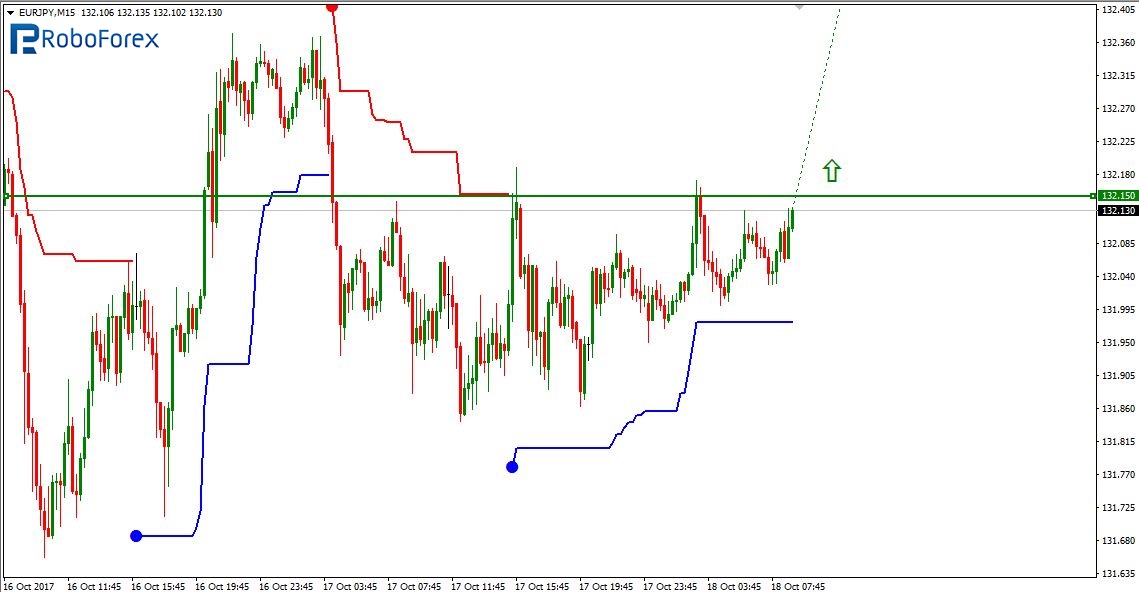
EUR JPY, “Euro vs. Japanese Yen”
As we can see at the H4 chart, the EUR/JPY pair may yet continue growing towards the resistance at the 8/8 level (134.37).
At the H1 chart, the price may break the 1/8 level at 132.22 and continue growing with the target at 134.37.
At the M15 chart, the pair may break the upside line of the VoltyChannel indicator and, as a result, continue moving upwards to reach 134.37.
Attention! Forecasts presented in this section only reflect the author’s private opinion and should not be considered as guidance for trading. RoboForex LP bears no responsibility for trading results based on trading recommendations described in these analytical reviews.
At the H4 chart, the AUD/USD pair is forming the mid-term descending correction, which has already reached the retracement of 50.0%. The next downside target may be the retracement of 61.8% at 0.7635, which may be reached only after the price breaks the local cow at 0.7732. In addition to that, pay attention to the short-term ascending correction after the convergence, which has already reached the retracement of 38.2%. The next targets are the retracement of 50.0% and 61.8% at 0.7916 and 0.7960 respectively.
As we can see at the H1 chart, the pair is being corrected to downside after forming another ascending impulse. By now, the correction has already reached the retracement of 50.0%. The next targets may be the retracement of 61.8% and 76.0% at 0.7806 and 0.7785 respectively. After finishing this correction, the instrument may resume moving upwards.
USD CAD, “US Dollar vs Canadian Dollar”
At the H4 chart, the USD/CAD pair finished the divergence and then started a new correction, which may complete soon. After breaking the local high at 1.2596, the price may reach the retracement of 38.2% at 1.2722. This level is one of the key correctional levels after the price finished the previous long-term downtrend. However, there is another possible scenario, according to which the correction may yet continue towards the retracements of 38.2% and 50.0% at 1.2392 and 1.2329 respectively.
As we can see at the H1 chart, the pair is starting the short-term ascending correction. If the price breaks the high at 1.2596, the instrument may move towards the post-correctional extension area between the retracements of 138.2% and 161.8% at 1.2630 and 1.2653 respectively
Attention! Forecasts presented in this section only reflect the author’s private opinion and should not be considered as guidance for trading. RoboForex LP bears no responsibility for trading results based on trading recommendations described in these analytical reviews.