Author Archive for InvestMacro – Page 460

EUR/USD strategy is to buy on dips

By GrowthAces.com

Macroeconomic overview:

  • Yesterday’s ECB meeting was fairly uneventful. The Governing Council left its monetary policy unchanged, in line with expectations, and confirmed all the most important parts of its communication. The key theme of the Governing Council discussion was the increased confidence that a faster narrowing of the output gap will eventually push underlying inflation higher. But we note that, despite clearly stronger GDP forecasts, the ECB’s own projections for core inflation have actually been revised further down throughout next year, de facto delaying the time of a clearer acceleration to 2019 and 2020 (when, however, the uncertainty surrounding the forecasts increases strongly). This explains why Draghi has to remain dovish and monetary policy very accommodative despite the bullish growth news. However, this will also raise communication challenges for the ECB going forward.
  • Yesterday there were no relevant rhetoric changes compared to the October meeting, when the ECB announced its plan to halve the pace of net monthly purchases to EUR 30bn starting in January. The ECB confirmed all its guidances, with interest rates expected to remain at the current level “well past” the end of net asset purchases, the possibility to extend/increase the QE program if needed, and the reinvestment of the maturing securities for an extended period of time after the end of net purchases. The only perceptible change in tone refers to the ECB’s increased optimism about the growth outlook – and rightly so – and confidence that this will eventually feed through to underlying price pressure. But looking beyond the surface and focusing on numerical details, the story that emerges puts the ECB in a tricky position. The new macroeconomic projections explain why.
  • As expected, the ECB revised its growth forecasts clearly higher, now envisaging 2.4% GDP expansion this year (previous: 2.2%), 2.3% in 2018 (1.8%), 1.9% in 2019 (1.7%) and 1.7% in 2020. The numbers throughout 2019 are in line with our own forecasts. However, this more bullish growth projections still fail to generate meaningful spillover to the inflation forecasts, given that the only upward revision for CPI was front-loaded (in 2018), modest (to 1.4% from 1.2%) and totally energy-driven, while at the policy-relevant horizon in 2020 headline inflation is expected to average 1.7%, not quite in line with the ECB’s definition of price stability. The key issue here is that these numbers come with a further downward revision of the ECB’s forecasts for core inflation in the first part of the forecast horizon, with 2018 now seen at 1.1% from 1.3%. This leaves almost the entire reacceleration in core inflation in 2019 (1.5%, in line with the September estimate) and in 2020 (1.8%).
  • Given the increased uncertainty surrounding longer-term forecasts, it is the one-year-ahead projection that usually bears the most important practical implications for monetary policy. This puts the ECB in a tricky position: the Governing Council has been facing steady upside growth surprises over the last year or so, which most likely imply a faster narrowing of the output gap than originally expected. Relative to the September forecasts, this time even compensation forecasts for 2017 and 2018 have been raised slightly, not to mention the technical assumption of oil prices being 10-20% higher across the forecast horizon. Yet, core inflation for next year is expected to be weaker than in the September forecasts. The ECB has only one mandate – price stability – and this vindicates prudence, persistence and patience in monetary stimulus. However, lack of responsiveness in core inflation at a time of strong growth complicates ECB communication, probably explaining why the range of views within the Governing Council about the appropriate end-date of QE has been broadening of late.
  • Draghi’s task will not be any easier after telling us yesterday that the ECB expects the output gap to close sometime in 2018. It is likely that the prospect of the ECB sticking to negative rates while there is no more slack in the economy will make a number of Governing Council’s members increasingly uncomfortable down the road.
  • After yesterday’s adjustments, the ECB’s core inflation forecast for 2018 even looks slightly conservative, but downward revisions for the 2019-2020 numbers are likely in the next few quarters even if growth continues to power ahead. This will probably require a good deal of balancing act by the ECB. Overall, we continue to like our forecast that the ECB will terminate QE in December 2018 after a very quick tapering in the fourth quarter of 2018. We expect the first increase in the deposit rate in mid-2019 when the upward trend in core inflation should become more entrenched, and an exit from negative rates at the end of 2019.
  • In Germany the SPD executive committee will decide on whether the Social Democrats start exploratory talks with the CDU/CSU on a government participation.After the meeting of party leaders and party whips of the CDU/CSU and the SPD on Wednesday evening, senior politicians of the CDU/CSU basically ruled out a minority government tolerated by the Social Democrats. A so-called “cooperation coalition” in which SPD ministers participate in the government but cooperate only on selected topics was also rejected by the conservatives. In contrast, at its party convention last week, the top brass of the Social Democrats promised an unbiased and open dialogue with the CDU/CSU in which various options will be discussed. Despite the latest tensions, we expect the SPD to officially announce today the start of exploratory talks with the CDU/CSU on a renewed grand coalition.
  • U.S. Senate Republicans face tightening margins on the US tax reform vote as Florida senator Marco Rubio said he would not vote for the package unless changes were made to child tax credits. A compromise plan is set to be released today and final votes planned for early next week.
  • The U.S. dollar looks set to end the week slightly lower following its strongest gain last week since mid-December 2016. The recent miss in U.S. CPI alongside the two dissents in the latest FOMC meeting (Charles Evans and Neel Kashkari preferred to maintain rates unchanged) seem to have weighed on dollar sentiment and led to some profit taking. On a structural basis, we remain USD bears and EUR bulls. And the ECB press conference yesterday – though uneventful and lacking “fireworks” – did not send any signals of discomfort with the stronger euro. In that sense, our view is that it does not represent a hurdle to further gradual currency gains.

Technical analysis and trading signals:

  • 55-dma lends support at 1.1756 and the slow stochs continue to rise. However, the close back inside the daily cloud, 1.1669/1.1823 and EUR/USD bulls are still waiting for a break above the cloud’s top.
  • We think that current levels are still good opportunity to open long EUR/USD positions.

EURUSD Daily Forex Signals Chart


GBP/USD: BoE in wait-and-see mode

Macroeconomic overview:

  • The Monetary Policy Committee of the Bank of England voted unanimously to maintain the stance of monetary policy at its meeting that ended on Wednesday, in line with prior expectations. At its previous meeting in November, the MPC raised the bank rate by 25bp to 0.50% and signaled that market expectations for a further two 25bp hikes over the next three years were broadly consistent with returning inflation to the 2% target in three years’ time. At its December meeting the Committee reiterated this guidance, however the MPC minutes signaled increased optimism on the economic outlook following recent progress in Brexit talks and the Chancellor’s fiscal easing. The better news was partly offset by signs of softer activity in the near term than the MPC previously expected. Overall, this was a time for a pause, with the MPC waiting to see the effects of the November rate rise, as well as progress in Brexit talks, which they will assess in more detail at the February Inflation Report.
  • The MPC minutes focused on the main developments of the last month. The Committee said there were two significant events: the Chancellor’s Autumn Budget – in which fiscal policy was eased by around 0.3% of GDP over the next three years – and the progress made in the first phase of Brexit talks, which the Committee judges will “reduce the likelihood of a disorderly exit, and was likely to support household and corporate confidence”. The implications of the slight loosening of fiscal policy are straightforward: it would facilitate a slightly tighter monetary policy, all else equal. In contrast, the MPC has previously warned that the implication of any resolution of uncertainty in Brexit negotiations is not immediate for the direction of monetary policy – it will depend on its impact on demand, supply and the exchange rate. The MPC said it will undertake a more detailed assessment of this in February, which is also when it will conduct its annual reassessment of supply-side conditions.
  • This increased optimism on the outlook was somewhat offset by recent macroeconomic data that, while limited, had suggested GDP growth in the fourth quarter of 2017 may be “slightly softer” than the 0.4% qoq growth in the third quarter of 2017. Data on UK economic activity has been mixed over the last month or so, but on balance it suggests only modest growth, and a turning point in the labour market. Indeed, the services PMI fell back to 53.8 in November, below its long-run average of 55.1. And, in the three months to October, the quarterly change in employment was -56k – the biggest drop in more than two years. With employment now going into reverse, economic growth will hinge on productivity growth, which has been particularly weak since the financial crisis and, more recently, adversely affected by Brexit-related uncertainty.

Technical analysis and trading signals:

  • The GBP/USD is again above 61.8% fibo of September-October fall, but the upward move is not being continued today. We think that a full retracement of the above-mentioned move to 1.3655 is likely in the coming days, but there is an important resistance level ahead – December 1 high at 1.3549.
  • Despite bullish view on the GBP/USD, we stay sideways. We do not want to increase risk on our portfolio with another USD-bearish position.

GBPUSD Daily Forex Signals Chart


USD/CAD: Poloz boosts rate hike bets

Macroeconomic overview:

  • The Bank of Canada is increasingly confident the economy will need less stimulus over time, Governor Stephen Poloz said on Thursday. His speech boosted the Canadian dollar and raised expectations of another rate hike early in 2018.
  • Poloz said the economy was in a sweet spot after making “tremendous” progress over the last year, with early signs that a long-awaited rotation to higher exports and business investment is happening as the housing boom cools.
  • The economy “is close to reaching its full potential. We are very encouraged by this, and we are growing increasingly confident that the economy will need less monetary stimulus over time,” Poloz said.
  • While a mechanical approach to setting policy would suggest rates should already be higher, the bank still sees signs of ongoing but diminishing slack in the labor market, Poloz said. Canada’s economy is near capacity and growth is forecast to continue above potential, posing an upside risk to the inflation forecast, he added. At the same time, labor market slack poses a downside risk, Poloz said, reiterating the bank’s oft-repeated concern that the job market is not as strong as employment growth and a steadily declining unemployment rate would suggest.
  • While the central bank held rates steady last week, Poloz acknowledged that current monetary policy “clearly remains quite stimulative” despite rate hikes in July and September, fueling market bets the next hike will come in the first quarter of 2018. The next policy meeting is January 17.
  • Chances of a rate hike by January edged up to 32%, while the implied probability of a tightening by March climbed to 68% from 61% before the speech.
  • Resales of Canadian homes rose 3.9% in November from October, the fourth straight monthly rise, but the momentum may not last as stricter mortgage rules take effect in January, the Canadian Real Estate Association said.
  • Statistics Canada said Canadian household debt as a share of income reached a record high of 171.1% in the third quarter. The report is likely to reinforce concerns that consumers could run into trouble as interest rates rise.

Technical analysis and trading signals:

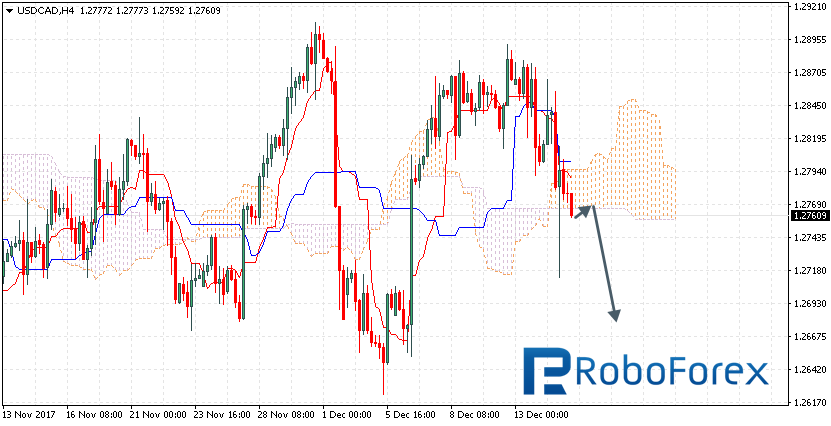
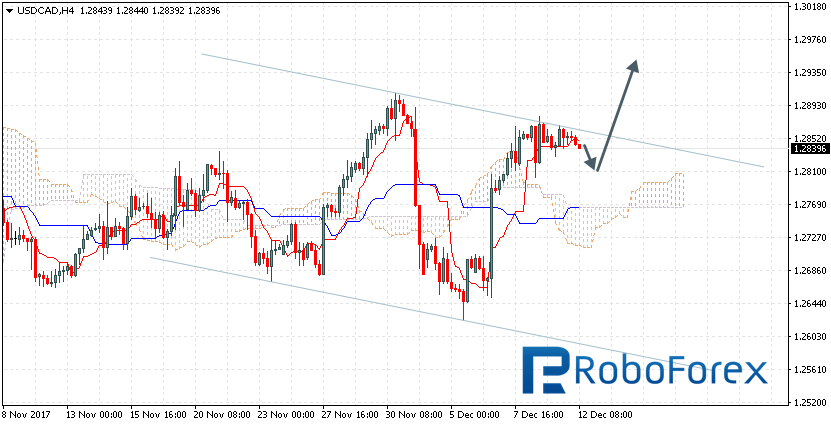
  • Yesterday’s USD/CAD low was at 1.2713, close to 23.6% fibo of September-October rise. The USD/CAD returned to 14-day exponential moving average at the end of Thursday, but the fall is being continued today. The pair is going to take another attempt to break below the above-mentioned fibo level today. The next support level would be 1.2624 low on December 5.
  • We stay short for 1.2500.

USDCAD Daily Forex Signals Chart

VIP Traders Club members should expect to receive forex and precious metals trading signals updates at least twice a day. We will send you:

  1. Buy and sell forex, precious metals signals (entry level, target, stop-loss)
  2. Suggested position size that you can easily adjust to your trading account size – this would help you in risk management and you will survive longer drawdown periods
  3. Early heads-up about the potential trading opportunities or rationale to taken positions ( fundamental analysis, technical analysis )
  4. Forecasts of most important macroeconomic indicators prepared by our economists and econometricians.

JOIN VIP TRADERS CLUB NOW!

About the Author:

By GrowthAces.com – Daily Forex Trading Strategies


Fibonacci Retracements Analysis 15.12.2017 (BITCOIN, ETHEREUM)

Article By RoboForex.com

BTC USD, “Bitcoin vs US Dollar”

As we can see at the H4 chart, the BTC/USD pair continues reaching new highs slowly but steadily. In addition to that, we can see the divergence, which may indicate a possible correction in the nearest future. However, the short-term scenario is still bullish. The targets of such uptrend may be inside the post-correctional extension area between the retracements of 138.2% and 161.8% at 18442.25 and 19239.00 respectively.

BTCUSD1

At the H1 chart, the pair may start a new correction after reaching its upside targets. The targets of this possible correction are the retracements of 38.2%, 50.0%, and 61.8% at 15255.28, 14003.26, and 12789.17 respectively.

BTCUSD2


ETH USD, “Ethereum vs. US Dollar”

As we can see at the daily chart, the ETH/USD pair is being corrected to the downside and has already reached the retracement of 38.2%. The next downside target may be the retracement of 50.0% at 572.31. The price may continue growing only after breaking the current high at 755.77. The next upside targets may be inside the post-correctional extension area between the retracements of 138.2% and 161.8% at 825.87 and 868.27 respectively.

ETCUSD1

At the H1 chart, the situation is similar and confirms the scenario described above.

ETCUSD2


RoboForex Analytical Department

Article By RoboForex.com

Attention!
Forecasts presented in this section only reflect the author’s private opinion and should not be considered as guidance for trading. RoboForex LP bears no responsibility for trading results based on trading recommendations described in these analytical reviews.

Ichimoku Cloud Analysis 15.12.2017 (AUD/USD, NZD/USD, USD/CAD)

Article By RoboForex.com

AUD USD, “Australian Dollar vs US Dollar”

The AUD/USD pair is trading at 0.7678; the instrument is still moving above Ichimoku Cloud, which means that it may continue growing. We should expect the price to test Tenkan-Sen and Kijun-Sen at 0.7655 and then continue moving upwards to reach 0.7740. However, the scenario that Implies further growth may be cancelled if the price breaks the downside border of the cloud and fixes below 0.7580. In this case, the pair may continue falling towards 0.7470.

AUDUSD


NZD USD, “New Zealand Dollar vs US Dollar”

The NZD/USD pair is trading at 0.7016; the instrument is still moving above Ichimoku Cloud, which means that it may continue growing. We should expect the price to test Tenkan-Sen and Kijun-Sen at 0.7000 and then continue moving upwards to reach 0.7110. However, the scenario that implies further growth may be cancelled if the price breaks the downside border of the cloud and fixes below 0.6910. In this case, the pair may continue falling towards 0.6815.

NZDUSD


USD CAD, “US Dollar vs Canadian Dollar”

The USD/CAD pair is trading at 1.2760; the instrument is still moving below Ichimoku Cloud, which means that it may continue falling. We should expect the price to test the broken border of the cloud at 1.2770 and then continue moving downwards to reach 1.2680. However, the scenario that implies further decline may be cancelled if the price breaks the upside border of the cloud and fixes above 1.2810. In this case, the pair may continue growing towards 1.2895.

USDCAD


RoboForex Analytical Department

Article By RoboForex.com

Attention!
Forecasts presented in this section only reflect the author’s private opinion and should not be considered as guidance for trading. RoboForex LP bears no responsibility for trading results based on trading recommendations described in these analytical reviews.

EURUSD: frozen at the balance line

By Gabriel Ojimadu, Alpari

Previous:

On Thursday the 14th of December, the ECB decided to maintain its key interest rate at 0.0% and the deposit rate at -0.4%. The euro/dollar pair jumped to 1.1863 after the publication of economic forecasts before dropping back to 1.1771 (-92) after Mario Draghi’s speech and the publication of US data.

During the press conference, Draghi said that the ECB had upgraded their economic forecasts for GDP and inflation growth. Projected GDP growth in 2018 has been revised upwards from 1.8% to 2.3%, while projected inflation has been revised from 1.2% to 1.4%. Draghi added that if the conditions for economic growth get any worse, the ECB would expand its asset purchasing program.

The US dollar rose against most of the majors after positive statistics on employment and retail sales. The number of initial jobless claims last week fell by 11,000 to 225,000. The retail sales index grew by 0.8% against a forecast of 0.3% and a previous reading of 0.5% (revised from 0.2%).

Day’s news (GMT+3):

  • 13:00 Eurozone: trade balance (Oct).
  • 15:00 UK: BoE quarterly bulletin.
  • 16:15 UK: MPOC member Haldane’s speech.
  • 16:30 Canada: manufacturing shipments (Oct).
  • 16:30 USA: NY Empire State manufacturing index (Dec).
  • 17:15 USA: industrial production (Nov).
  • 00:00 USA (Sat): net long-term TIC flows (Oct).

Fig 1. EURUSD hourly chart. Source: TradingView

Yesterday, I wrote that technical analysis doesn’t work when the heads of central banks a speaking or when large blocks of economic data are released. Yes, the price does take all events into account, but only post factum. Market expectations often diverge from the actual outcome. The past is a static picture. It doesn’t change under any circumstances. We can analyse a price’s historical behaviour, and simulate different scenarios, but the future can be shaped by us as fundamental data and statements from officials change market expectations.

The W-model is off the cards. If the euro starts to rise again, we could see the formation of an upwards impulse towards the TR2 trend line. For that to happen, the euro needs to move from its current level and rise above the 45th degree, which is at 1.1819.

At the time of writing, the euro is trading at 1.1784. This is close to the LB balance line. The price is in equilibrium on the hourly timeframe. My forecast has the euro dropping to the lower boundary of the A-A channel. The stochastic has reversed downwards, so I’m expecting the euro to open down in Europe.

Our Forecast BEFORE the 47 Percent, 12-Month Gain

By Elliott Wave International


Learn How to Apply the Wave Principle to Improve Your Trading and Investing

No matter what markets you follow, this 10-lesson tutorial will help you begin applying Elliott waves so you can find opportunities like this one in EEMA.

You’ll learn:

  • What the basic Elliott wave progression looks like
  • Difference between impulsive and corrective waves
  • How to estimate the length of waves
  • How Fibonacci numbers fit into wave analysis
  • Practical application tips for the method

Get instant access!

This article was syndicated by Elliott Wave International and was originally published under the headline Our Forecast BEFORE the 47 Percent, 12-Month Gain. EWI is the world’s largest market forecasting firm. Its staff of full-time analysts led by Chartered Market Technician Robert Prechter provides 24-hour-a-day market analysis to institutional and private investors around the world.

The Dollar was supported by November reports on the US labor market

Author: Dmitriy Gurkovskiy, Chief Analyst at RoboForex

The EUR/USD pair was so impressed by last Friday’s statistics on the US labor market, that it managed to update the low it had reached on November 20th. The reports were positive indeed. Of course, there were some nuances, but in general, the statistics was very good.

So, the unemployment rate in the USA in November remained unchanged as expected, at 4.1%, the same as the October reading. It’s a very good result, given that a lot of investors had doubts about stability of the indicator. However, after falling in October, the indicator didn’t raise in November, and investors liked this fact. The non-farm employment change was 228K in November, although it was expected to be 198K. The number is a bit weaker than the October one, but it was expected and, therefore, didn’t disappoint anybody.

However, the indicator that describes salaries growth rate made investors doubt a bit. The average hourly earnings increased by 0.2% m/m in November, which is better than the month before when it lost 0.1% m/m. Still, the problem is that the indicator was expected to add 0.3% m/m. There hasn’t been stable dynamics in salaries growth for a long time: employers are revising salaries rather slowly, because they have to consider domestic demand and global economic outlook. And the market conditions aren’t always suitable for raising salaries.

As a result, November reports on the US labor market are looking quite positive. The US Dollar strengthened, but it will face several other events this week. On December 12th and 13th, the US Federal Reserve is scheduled to have another meeting, where it is expected to raise the key rate for the third time this year. Market expectations predict the increase of 25 basis points and investors are pretty fine with that.

In addition to that, the USA will publish reports on the retail sales and the industrial production. The European Central Bank will also have a meeting and the Eurozone is planning to report on several macroeconomic indicators as well. So, this week is anticipated to be very busy and intensive for the EUR/USD pair.

From the technical point of view, the H4 chart shows that the EUR/USD pair has tested the support level, rebounded from it, and right now may be forming a new rising impulse. In the mid-term, the price may continue falling towards the support level of the projected descending channel at 1.1605.

The short-term scenario for the EUR/USD pair is presented by the H1 chart. Apart from rebounding from the support level of the mid-term descending channel, the pair has also broken the resistance level of the short-term downtrend channel. If the uptrend continues, its targets may be the projected resistance levels at 1.1822 and 1.1863.

Attention!

Forecasts presented in this section only reflect the author’s private opinion and should not be considered as guidance for trading. RoboForex bears no responsibility for trading results based on trading recommendations described in these analytical reviews.


Forex Technical Analysis & Forecast 12.12.2017 (EUR/USD, GBP/USD, USD/CHF, USD/JPY, AUD/USD, USD/RUB, GOLD, BRENT)

Article By RoboForex.com

EUR USD, “Euro vs US Dollar”

The EUR/USD pair is falling. Possibly, the price may reach 1.1726. An alternative scenario suggests that the instrument may grow towards 1.1802. Later, in our opinion, the market may continue falling inside the downtrend. The target is at 1.1650.

EURUSD


GBP USD, “Great Britain Pound vs US Dollar”

The GBP/USD pair is moving downwards and forming the third wave with the target at 1.3279. After that, the instrument may grow towards 1.3398 (at least) and then resume falling to reach 1.3249.

GBPUSD


USD CHF, “US Dollar vs Swiss Franc”

The USD/CHF pair is trading above 0.9882 and may continue growing inside the uptrend. The target of this ascending wave is at 1.0028. Later, in our opinion, the market may start another consolidation range and then continue moving upwards to reach 1.0100.

USDCHF


USD JPY, “US Dollar vs Japanese Yen”

The USD/JPY pair is consolidating at the top of the ascending structure, which may be considered as a continuation pattern. Possibly, the price may form the third wave with the target at 114.74.

USDJPY


AUD USD, “Australian Dollar vs US Dollar”

The AUD/USD pair is consolidating near the lows. We think, today the price may grow towards 0.7554 and then continue falling to reach 0.7470.

AUDUSD


USD RUB, “US Dollar vs Russian Ruble”

The USD/RUB pair is consolidating above 59.09. Possibly, today the price may fall towards 58.85 and then grow to reach 59.86. Taking into account that the oil prices went up significantly, the instrument may strengthen up to 57.90 and then continue falling inside the downtrend to reach 56.55.

USDRUB


XAU USD, “Gold vs US Dollar”

Gold has expanded the consolidation range downwards. We think, today the price may fall to reach 1238 and then grow towards 1243. After that, the instrument may reach new lows and then continue falling inside the downtrend with the target at 1220.

GOLD


BRENT

Brent has broken its consolidation range upwards and right now is still growing to reach the local target at 65.75. Later, in our opinion, the market may return to 64.50 and then start forming another ascending structure with the target at 66.20.

BRENT


RoboForex Analytical Department

Article By RoboForex.com

Attention!
Forecasts presented in this section only reflect the author’s private opinion and should not be considered as guidance for trading. RoboForex LP bears no responsibility for trading results based on trading recommendations described in these analytical reviews.

Ichimoku Cloud Analysis 12.12.2017 (AUD/USD, NZD/USD, USD/CAD)

Article By RoboForex.com

AUD USD, “Australian Dollar vs US Dollar”

The AUD/USD pair is trading at 0.7543; the instrument is still moving below Ichimoku Cloud, which means that it may continue falling. We should expect the price to test Tenkan-Sen and Kijun-Sen at 0.7555 and then continue moving downwards to reach 0.7450. However, the scenario that Implies further decline may be cancelled if the price breaks the upside border of the cloud and fixes above 0.7580. In this case, the pair may continue growing towards 0.7660.

AUDUSD


NZD USD, “New Zealand Dollar vs US Dollar”

The NZD/USD pair is trading at 0.6932; the instrument is still moving above Ichimoku Cloud, which means that it may continue growing. We should expect the price to test Tenkan-Sen and Kijun-Sen at 0.6905 and then continue moving upwards to reach 0.7005. However, the scenario that implies further growth may be cancelled if the price breaks the downside border of the cloud and fixes below 0.6845. In this case, the pair may continue falling towards 0.6725.

NZDUSD


USD CAD, “US Dollar vs Canadian Dollar”

The USD/CAD pair is trading at 1.2839; the instrument is still moving above Ichimoku Cloud, which means that it may continue growing. We should expect the price to test Tenkan-Sen and Kijun-Sen at 1.2815 and then continue moving upwards to reach 1.2950. However, the scenario that implies further growth may be cancelled if the price breaks the downside border of the cloud and fixes below 1.2740. In this case, the pair may continue falling towards 1.2660. After breaking the upside border of the descending channel and fixing above 1.2890, the price may resume growing.

USDCAD


RoboForex Analytical Department

Article By RoboForex.com

Attention!
Forecasts presented in this section only reflect the author’s private opinion and should not be considered as guidance for trading. RoboForex LP bears no responsibility for trading results based on trading recommendations described in these analytical reviews.

EURUSD: daily candlesticks have formed a range of 1.1730 to 1.1812

By Gabriel Ojimadu, Alpari

Previous:

On Monday the 11th of December, trading on the euro/dollar pair closed slightly down, leaving a wick with a high of 1.1812 before dropping to 1.1769. With a bare economic calendar, market activity at the beginning of this week has got off to a slow start. Traders based their decisions mostly on the dynamics of US bond yields. In Europe, US 10Y bond yields dropped to 2.354%, before recovering to 2.391% in the US session. Growth for bond yields means growth for the dollar.

Day’s news (GMT+3):

  • 07:30 Japan: tertiary industry index (Nov).
  • 09:30 France: nonfarm payrolls (Q4).
  • 12:30 UK: CPI (Nov), retail price index (Nov), PPI input (Nov), PPI output (Nov).
  • 13:00 Germany: ZEW survey – economic sentiment (Dec).
  • 13:00 Eurozone: ZEW survey – economic sentiment (Dec).
  • 16:30 USA: PPI (Nov).
  • 22:00 USA: monthly budget statement (Nov).
  • 22:00 Eurozone: ECB President Mario Draghi’s speech.

Fig 1. EURUSD hourly chart. Source: TradingView

Yesterday’s predictions didn’t come off. With the euro crosses rising and US 10Y bond yields dropping, the euro broke up the A-A channel. The euro’s rise against the dollar was stopped in its tracks by the 67thdegree. The EURUSD rate dropped to 1.1765.

The 45th degree has shifted from 1.1730 to 1.1758 as a result of the 1.1812 high being formed. I think the euro is going to move upwards from the 45th degree towards 1.1811. On the daily timeframe, two candlesticks with diverging tails have formed a range of 1.1730 to 1.1812. The euro will continue to move in whichever direction it breaks out of this range.

Markets await the FOMC meeting and Janet Yellen’s press conference on the 13th of December. They’ve already factored in a 25-base-point increase to interest rates, so euro bulls shouldn’t waste their energy trying to push the price up here.

I’m thinking about opening a long position with a BuyStop at 1.1780. If the euro renews the 1.1764 low, then it may be worth risking a long position from 1.1758/60. These are preliminary values, they may need adjustment later.

RoboForex Ltd increases leverage for cryptocurrencies trading up to 1:10

December 12th, 2017 – RoboForex Ltd, an international company that provides its clients from different countries with brokerage services, is pleased to announce the increase of the maximum leverage value for trading operations involving cryptocurrencies. Starting today, RoboForex Ltd clients have an opportunity to trade cryptocurrencies with the leverage value of 1:10.

RoboForex Ltd is systematically developing its proprietary services and improving trading conditions the Company offers to its clients. From now on, traders with Pro-Standard, ECN-Pro NDD, Pro-Affiliate, ECN-Pro Affiliate, and R Trader account types will have an opportunity to perform trading operations involving cryptocurrencies with the leverage value of 1:10. Introduced changes will be applied to both open positions and the positions that will be opened in the future. Earlier, the maximum values were from 1:1 to 1:5 depending on the account type. The increased leverage value will allow to decrease margin requirements and help traders both to increase the number of your trading operations and to expand the list of trading strategies they use.

Andrey Goilov, RoboForex Ltd says: “The cryptocurrency market is madly volatile and this attracts traders’ attention from all over the world. It is the number of positions involving cryptocurrency instruments that has been increased by our clients over the course of the past several months. The increased leverage value will allow to decrease margin requirements and help them to both increase the number of their trading operations and expand the list of the trading strategies.”

About RoboForex

RoboForex is a financial group, which delivers brokerage services on a world-wide basis. The group provides traders, who work on financial market, with access to its own trading platforms. The group includes RoboForex (CY) Ltd, a European broker with the CySEC license No. is 191/13, and RoboForex Ltd, an international broker, regulated by the IFSC with the license IFSC/60/271/TS/17. More detailed information about RoboForex Ltd can be found on the official website at www.RoboForex.com.