Trump tariffs are based on flawed doctrines, which could penalize the US as much as its trade deficits.
Last Friday, President Trump threatened to impose tariffs on $267 billion in Chinese goods, on top of the additional $200 billion that he said will likely be hit with import taxes in a matter of days.
If the tariff stakes will increase up to $500 billion, it could penalize Chinese GDP by 1%, but the US GDP, which is relatively more vulnerable, would suffer a net impact of 2% of GDP. In dollar terms, the consequent tariff damage could prove even higher than the current U.S. trade deficit with China and thus double the damage.
The Trump administration‘s trade doctrine makes little sense in the 21st century.
“Made in China” does not capture value-added
In the pre-1914 era and during the protectionist interwar period, global integration plunged. As major corporations competed largely in home markets, their value activities were mainly domestic. Following World War II, the US-led Bretton Woods system ensured a greater degree of internationalization – including systemic US trade deficits since 1971, decades before deficits with China.
Meanwhile, US multinational companies have cut costs through offshoring as large chunks of productive capacity has been transferred to emerging markets since the 1980s, especially in Asia. So today the “eco-systems” of US multinationals are increasingly global.
Here’s Trump’s dilemma in a nutshell: While tariff wars were typical to the era of domestic competition a century ago, they do not work in a more global era. Even “made in China” products feature diverse value-added inputs by multinational companies producing in, exporting from and selling in China.
Since iPhone alone accounts for some $16 billion of the U.S. trade deficit with China, let’s use it as an example. According to data (IHS Markit and Reuters), the initial sale price of Apple’s iPhone X (64BG) was $999. The Trump administration’s tariffs are based on the idea that since this smart phone is made in China, all value-added is captured in China and thus it must be penalized by heavy tariffs.
The breakdown of the iPhone X costs comprises both manufacturing costs ($378.25) and value shared between distributors and Apple ($620.75), which accounts for almost two-thirds of total costs. Another fourth of the total consists of various components made in South Korea, Japan, the US, UK, Switzerland, and Singapore.
China’s key contribution is in the basic manufacturing costs ($8) plus battery packs ($6), which is less than 4 percent of the manufacturing cost and 1.4 percent of the total cost of iPhone X (Figure).
FigureiPhone X (64GB): Breakdown of Full Costs
Black = Value shared between distributors and Apple
Green =Modules made in several advanced economies
Red = Basic manufacturing, battery packs in China
White =Information not available
Source: Calculations based on data from IHS Markit and Reuters
Is the iPhoneX an exception? Hardly. Before the fall of Nokia, Europe captured 51% of the value-added of the Nokia N95 smartphone, even when it was “Made in China,” because the final assembly (read: China) involved 2% of the overall value-added.
Obviously, the share of Chinese value-added differs by industries and companies, yet it tends be very low in the case of multinational companies operating in China. The same goes for such companies operating in India or other emerging markets.
That’s precisely why the government seeks China’s rapid transition from exports and investment toward innovation and consumption. After all, like Apple and Nokia, Chinese industry giants – from Huawei and Xiaomi to Oppo and Vivo – capture far more of the value-added in China. As Vice Premier Liu He has urged, China must innovate if it wants to be a world leader in science and technology.
America’s true dilemma
There is one critical difference, however. Through taxation, Nokia’s success benefited Finnish taxpayers and its European investors. In contrast, Apple’s success does not necessarily accrue to American taxpayers because many US multinationals, unlike their European counterparts rely on creative tax accounting or tax havens.
Theoretically, Apple should be the largest taxpayer in the world and pay $38 billion to the US Treasury in taxes brought home from overseas and “create” 20,000 new jobs. But as Fortune has reported, that’s all spin.
Reportedly, Apple plans to collect a huge windfall from the GOP’s corporate tax handout. Currently it holds about $252 billion – more than 90% of its total cash – in profits offshore, where it can avoid paying US taxes.
Before Trump’s tax code overhaul, Apple would have paid $79 billion in taxes if it had brought the money home. But it didn’t. Instead, it let the cash sit offshore for years. So its offshore profits will be taxed at a one-time, 15.5% repatriation rate. All other corporate profits will be taxed at 21% (down from a previous rate of 35%).
In the postwar era, the old adage was “What’s good for General Motors is good for America.” What Apple and many other US multinationals are doing today may not be illegal, but it is part of a broader problem associated with America’s decline.
Here’s the bottom line: Chinese share of 2%+ of the value-added pie is not the problem. Trump’s tariffs are a misguided solution to a wrong problem.
The real question is why US companies’ lucrative profits yield so few benefits to ordinary Americans but great benefits to few corporate insiders.
About the Author:
The author is the founder of Difference Group and has served at the India, China and America Institute (USA) the Shanghai Institutes for International Studies (China) and the EU Center (Singapore).
Euro and British pound sterling bets rose for 2nd week
The latest data for the weekly Commitment of Traders (COT) report, released by the Commodity Futures Trading Commission (CFTC) on Friday, showed that large currency speculators once again raised their bullish net positions in the US Dollar Index futures markets this week. See full article
The non-commercial contracts of WTI crude futures totaled a net position of 543,845 contracts, according to data from this week. This was a slide of -21,885 contracts from the previous weekly total. See full article
The large speculator contracts of gold futures totaled a net position of -7,590 contracts. This was a weekly advance of 5,907 contracts from the previous week. See full article
The large speculator contracts of 10-year treasury note futures totaled a net position of -682,684 contracts. This was a weekly increase of 73 contracts from the previous week. See full article
The non-commercial futures contracts of S&P500 Mini futures, traded by large speculators and hedge funds, totaled a net position of 122,220 contracts in the data. See full article
The non-commercial contracts of silver futures totaled a net position of -27,403 contracts, according to data from this week. This was a weekly gain of 1,571 contracts from the previous totals. See full article
The large speculator contracts of copper futures totaled a net position of -8,894 contracts. This was a weekly shortfall of -2,917 contracts from the data of the previous week. See full article
The Commitment of Traders report data is published in raw form every Friday by the Commodity Futures Trading Commission (CFTC) and shows the futures positions of market participants as of the previous Tuesday (data is reported 3 days behind).
In few months, the Trump administration has undermined more than seven decades of U.S. free trade legacies. Who are the policymakers behind this reversal. Wat is their agenda? And why is steel their common denominator?
Recently, the Trump administration hammered a revised North American Free Trade Agreement (NAFTA) by pressuring Mexico and then strong-arming Canada to the tentative deal. The White House’s objective is either to redefine the terms on the basis of U.S. economic leverage and unipolar geopolitics or – if that is not acceptable to other parties – to withdraw the U.S. from such FTAs. It is not “either you are with us or against us,” as in the Bush years, but “America First – or nothing.”
Today, Trump’s tariff wars are led by Peter Navarro, Director of Trade and Industrial Policy, and Director of the White House National Trade Council, as well as his ally and Trump trade advisor Dan DiMicco, former CEO of the U.S. steel giant Nucor.
The two are supported by Robert Lighthizer, U.S. Trade Representative and former Reagan administration trade hawk, and Secretary of Commerce Wilbur Ross, a bankruptcy expert who made his fortune from restructured and offshored US jobs.
Last year, the trade hawks were still contained by mainstream policymakers, such as former Secretary of State Rex Tillerson, Director of the National Economic Council Gary Cohn and Treasury Secretary Steve Mnuchin.
After Tillerson lost his job and particularly when the tree-trader Cohn resigned, things changed. Cohn’s Goldman Sachs companion Mnuchin proved weak, and Ross leans on winners, regardless of the cause. As free-traders were out, protectionists stepped in. That was more in line with Trump’s 2016 campaign promises, when he threatened to use 35%-45% import tariffs against nations that have a significant trade surplus with the U.S.
The Uncompromising but Compromised Navarro and DiMicco
In the protectionist camp, the key player is Peter Navarro, the author of sensationalist China-bashing books, and his longtime friend DiMicco, a vocal free trade critic. For years, the two have been determined to prioritize steel industry, even at the expense of other American industries that offer more jobs, profits, or both.
With Navarro, the path to notoriety began with great political aspirations and failures. In the ‘90s, he lost five elections in San Diego; for mayor in 1992, city council in 1993 and 2001, county supervisor in 1994, and Congress in 1996. As politics did not work, he scribbled half a dozen business books, including If It’s Raining in Brazil, Buy Starbucks (2001), When the Market Moves, Will You Be Ready? (2003), What the Best MBAs Know (2005), The Well Timed Strategy (2006) and Always a Winner (2009). Intriguingly, all of them were typical feel-good-win-the-world business staple, and none of them focused on China. But then came the global crisis. This was a problem to Navarro and others who mistook short-term bubbles for sustained growth. That’s when China became a convenient scapegoat.
So a repackaged Navarro hit the market with The Coming China Wars (2008), which claimed that America was facing battles with China over everything from decent jobs, and advanced technologies to strategic resources. Surprisingly, these hateful ramblings that smacked of simple China basing were given legitimacy by the reputable FT Press, the “world’s leading educational publishing company.” As Navarro realized he had found a gold mine, he released the more extreme Death by China (2011), which was published by Pearson Prentice Hall, the parent of the FT Press. Paradoxically, the more Sinophobic he got, the more he was rewarded.
Even stranger was Navarro’s debacle that resulted from efforts to fund a documentary based on his book, which went hand in hand with suspected “financial irregularities”, a subpoena by an FBI agent, and a charge for document destruction. Like the over-driver Energizer Bunny, Navarro did not let such hindrances stop him. Even during the debacle, he co-authored a book on America’s economic ruin in cooperation with R. Glenn Hubbard, the heavy-weight economic advisor of Mitt Romney’s presidential campaign. But unlike former Fed chief Alan Greenspan who got caught for glorifying laissez-faire policies that led to the 2008 crisis, Hubbard had a lower public profile which allowed him to capitalize on the crisis via excessive consulting fees.
Ironically, Death by China accused China for environmental pollution worldwide, whereas Nucor, one of America’s largest corporate contributor to U.S. air pollution, had already in 2000 paid almost $100 million to half a dozen U.S. states in the largest environmental settlement ever with a steel manufacturer. Death by China was co-authored with Greg Autry, an economist who represents Coalition for a Prosperous America and the American Jobs Alliance, which believes that U.S. trade policies have severely harmed the nation’s economy, security and people.
That is how China became a convenient scapegoat for Nucor’s dramatic fall. As long as free markets, deregulation and globalization boomed, Nucor soared. As Dan DiMicco took over in 2000, its stock price more than doubled to $31 in half a decade. But thereafter it more than doubled again to a peak of $75 in fall 2008. How did DiMicco do it? The simple answer is: the fastest possible way, via mergers and acquisitions (M&As).
First DiMicco took over Auburn Steel (2001), Nucor’s first acquisition in 36 years, the came Birmingham Steel (2002). Smart CEOs got more cautious by 2005, when U.S. subprime market first tanked, but not DiMicco. After the mid-decade, he got hungrier acquiring even bigger targets, such as Connecticut Steel, Verco Decking and Harris Steel (2006). And even as U.S. real estate sector began to sink into recession, DiMicco bought Magnatrax (2007), and David J. Joseph Co. (2008). That’s when the $20 billion steel giant posted a loss of $293 million, its first loss since 1966. Unsurprisingly, in the aftermath of the financial crisis, Nucor lost all those gains by early 2009, within a few months as Nucor’s stock plunged back to $34 (Figure 1).
Figure 1Nucor’s Stock Price, 2000-2018
The punchline of the story is how DiMicco explained the fall of Nucor after 2008. It was not the excessive M&A wave. Nor was it the lack of foresight after the mid-decade, when many signs surfaced that Nucor’s growth was untenable. Instead, and once again, China served as a scapegoat. In the past, DiMicco had endorsed Navarro’s books. Now the two began to co-write op-eds bashing China.
Despite their more recent stated reservations about Navarro, Wall Street Journal, Barron’s and others highly-regarded business publications were glad to give him space at the time. In April 2009, the two argued that China’s currency manipulation accounted for U.S. trade deficits with China (Wall Street Journal). In October 2009, they decried China’s “weapon of mass production,” which they claimed was fueled by currency manipulation, unfair trade practices and gutting U.S. manufacturing (San FranciscoChronicle). (For a sanity check, it should be recalled that during this period Chinese economy accounted for almost half of global growth, which spared the world economy from Great Depression 2.0.)
To the two, these financial op-eds were but a stepping-stone to Capitol Hill’s kingmakers. In September 2009, DiMicco gave testimony on Chinese currency to the House Ways and Means Committee. By early 2010, they proclaimed China an emerging global threat and that it was time to “get tough” with the mainland (Barron’s); that is, assertive slogans that somehow found their way to the official U.S. 2017National Security Strategy, after Trump was willing to see America’s ailing steel industry as a national security issue, at par with Pentagon’s rearmament.
Navarro’s Death by China had a simple solution to America: it urged business executives to be like Nucor, America’s largest steel producer, and Dan DiMicco, its chairman. “If American corporate executives want to better understand the art of fighting back against Chinese mercantilism and protectionism, they need look no further than Nucor…and the example set by its [chairman], Dan DiMicco [who] spends considerable time in the public arena lobbying for real trade reform with China.”
Lighthizer’s Tariffic Republican Party
Neither Lighthizer nor Ross have the public profile of Navarro and DiMicco. Yet, neither is without controversies. When Lighthizer arrived in the White House, he spent nearly $1 million on new furniture alone, attributing the costs to the Obama administration. But his ambitions went far beyond subsidized furniture – and they, too, were sparked by the eclipse of U.S. steel industry.
Growing up in Ashtabula, Ohio, near the steel mills that used to be the bedrock of the little Lake Erie port city, he saw them shutter one after another. Today, Ashtabula is known as one of the poorest places in America. Like Navarro and DiMicco, Lighthizer believes that the loss of good-paying manufacturing jobs in his home place has nothing to do with the erosion of low-margin, high-polluting steel industry and the proliferation of steel factories around the world and thus intensified competition. He grew of age in the postwar age of ‘American Century,’ not in the multipolar era of 21st century. As far as he was concerned, Ashtabula’s fall was triggered by unfair competition from cheap, foreign imports, particularly from China.
That’s the story Lighthizer likes to tell to U.S. journalists. The problem with the story is that he left his hometown more than four decades ago in the ‘70s, when Deng Xiaoping was only initiating China’s economic reforms and opening-up policies. Second, America’s trade deficits started in 1971, with Western Europe, then Japan and the ‘Asian dragons’; that is, Taiwan, South Korea, Singapore and Hong Kong. Third, U.S. deficits with China began only in the 2000s, decades after the fall of the Ashtabula of Lighthizer’s youth.
In reality, Lighthizer was a trade hawk already in the Reagan administration when he served as Deputy US Trade Representative and the White House targeted Japan for alleged trade and currency abuses and then forced Tokyo to agree to the Plaza Accord (1985), to depreciate the U.S. dollar in relation to the Japanese yen and German Deutsche mark by intervening in currency markets. It was that deal – signed in a hotel that would soon become known as the Trump Plaza – that effectively broke Japan’s economic rise, paved the way to its asset bubble and lost decades.
During those years, Ambassador Lighthizer claims to have negotiated over two dozen bilateral international agreements, including agreements on steel, automobiles, and agricultural products. As Deputy USTR, he also served as Vice Chairman of the Board of the Overseas Private Investment Corporation (OPIC). Indeed, OPIC had begun to serve as the US government’s development institution after 1971, when it insured IT&T in Chile thus ensuring de facto US government support to a company that was meddling in Chilean elections which led to General Pinochet’s violent coup.
Just as Lighthizer in the Reagan administration sought to contain Japan’s rise with new trade and currency policies, he now hopes to use tariffs against China and, truth to be told, against any country that is perceived to stand in America’s way. It is what he believes to be the true tradition of the Republican party: “The icon of modern conservatism, Ronald Reagan, imposed quotas on imported steel, protected Harley-Davidson from Japanese competition, restrained import of semiconductors and automobiles, and took myriad similar steps to keep American industry strong. How does allowing China to constantly rig trade in its favor advance the core conservative goal of making markets more efficient?”
To Lighthizer, tariffs are as American as apple pie; a way to promote American industry and a key Republican tenet originating from the pro-business politicians who created the party. Already in 2011 – five years before the Trump election triumph – Lighthizer argued that Trump’s “get-tough views on China” recall the roots of the party: “For most of its 157-year history, the Republican Party has been the party of building domestic industry by using trade policy to promote U.S. exports and fend off unfairly traded imports. American conservatives have had that view for even longer.”
Like Trump, Lighthizer sees China as a problem, along with the U.S. NAFTA partners, Canada and Mexico, Germany and the EU, Japan and South Korea, and the WTO itself. America is on the right track; the other countries aren’t. So they have to be transformed by America.
Ross, “the Greatest Gifter in American History”
While Navarro and Lighthizer flex their muscles behind the TV cameras, the 80-year old Secretary of Commerce Wilbur Ross has been the trade war’s public face. Nicknamed the “King of Bankruptcy,” Ross made his estimated $700 million in assets by buying bankrupt companies, especially in manufacturing and steel, and then selling them for a great profit after restructuring.
The prime examples include the International Steel Group (ISG), which he founded in 2002 after purchasing the assets of several bankrupt steel companies and which was followed by International Textile Group (ITG), International Automotive Components Group (IAC) and International Coal Group (ICG). Ironically, he made his fortunes by doing everything Trump claims is wrong with America.
In the Trump administration, Ross presumably is going after the kind of offshoring of U.S. jobs that gained him with a fortune. Nevertheless, charges of conflicts of interest, including possibly illegal failures to divest from financial holdings (violating a pledge to the Office of Government Ethics), and to disclose financial ties to Russian interests in confirmation hearings (according to the Paradise Papers) keep haunting the semi-billionaire.
Worse, a recent Forbes in-depth report indicates that “allegations [against Ross] — which sparked lawsuits, reimbursements and an SEC fine—come to more than $120 million. If even half of the accusations are legitimate, the current United States secretary of commerce could rank among the biggest grifters in American history.”
As Forbes’s Dan Alexander sees it, the timing of Trump’s job offer was economic manna from heaven: “From Ross’ vantage point, Trump offered the perfect exit. The future cabinet secretary’s private equity funds were underperforming— one on track to lose 26% of its initial value and another two dribbling out mediocre returns— and the accusations were starting to pile up.”
Four Steely Men
So these are the not-so-fabulous four: an idea peddler haunted by fraud allegations, a senior executive willing to promote steel industry at the expense of American innovation; a trade hawk who would like to re-create the Republican Party and the WTO in the image of America; and a bankruptcy wizard and grafter extraordinaire who made his millions by offshoring those jobs that Trump claims to want back.
In each case, protectionism has been less an intellectual matter of correcting the wrongs in international trade. In each case, it has served as an opportunist career enhancer, profit-maker and ideological pretext.
In the U.S. industrial landscape, the four steely men seek a return to the past ‘American Century’ by boosting artificially old and low-margin industries, at the expense of new and profitable ones. Steel is their common denominator.
Since the postwar era, employment in manufacturing has fallen in most major manufacturing countries. Due to the emerging economies’ low-cost advantage and offshoring, advanced economies focus more on higher value-added, that’s their comparative advantage. In contrast, Trump hopes to facilitate US growth with re-negotiated or rejected trade deals to “bring good-paying jobs to our shores and support American manufacturing, the backbone of our economy.” In reality, the reliance on controversial policy instruments (lower taxes, aggressive deregulation, new energy exports), may boost U.S. economic fortunes in the short-term but contribute to broader deterioration in the long-term (deeper income polarization, social costs of misguided deregulation, environmental hazards associated with shale extraction).
Paradoxically, the Trump administration seeks progress in secondary priority areas where it is destined to generate minimal or transient progress, while ignoring viable advances in those areas of competitiveness and innovation, where it could thrive.
In the view of the steely trade hakws, even the reversal of postwar global economic cooperation is fully legitimate – as long as it is seen to serve the America First doctrine rather than each one’s private agenda.
About the Author:
Dr. Dan Steinbock is the founder of Difference Group and has served as research director at the India, China and America Institute (USA) and visiting fellow at the Shanghai Institutes for International Studies (China) and the EU Center (Singapore). For more, see https://www.differencegroup.net/
The original online version was published by The World Financial Review on July 13, 2018
NOTES
1 Once again,Navarro turned to Nucor, but he wanted the deal done through Utility Consumers’ Action Network (UCAN), a San Diego non-profit, led by his friend Michael Shames. So, UCAN deposited Nucor’s checks to Navarro’s production company. Perhaps the hope was that this would be easier to explain to Nucor’s shareholders. In February 2012, UCAN, Navarro’s production company, Navarro and his wife were subpoenaed by an FBI agent to testify before a federal grand jury, due to suspected financial irregularities. Soon thereafter UCAN was charged for document destruction. By fall 2012 Shames was replaced. But the debacle is not over. The following year, UCAN and Shames sued each other.
2 In Inside Job (2010), the Oscar-winning documentary on the 2008 Great Recession, Hubbard was questioned on his support for deregulation, lucrative consulting, and conflict of interest. Hubbard was dean of Columbia’s School of Business and formerly deputy assistant secretary at the US Treasury (1991-93), chairman of the Council of Economic Advisors (2001-2003).
3 The Coalition promotes a harder line against China. It represents agriculture, manufacturing and organized labor associations and small exporters. In turn, the American Jobs Alliance is dedicated to fostering U.S. system of free enterprise. The leaders of these two organizations are well-known trade hawks and include a former commissioner of U.S.-China Economic and Security Commission, president of Economic Strategy Institute, Ross Perot’s economic advisor, and Reform Party candidates.
4 Just months before his successor John Ferriola took over as the CEO in January 2013, DiMicco still bought the $605 million Skyline Steel, which boosted Nucor’s price to almost $45 thus making his departure look a bit more respectable.
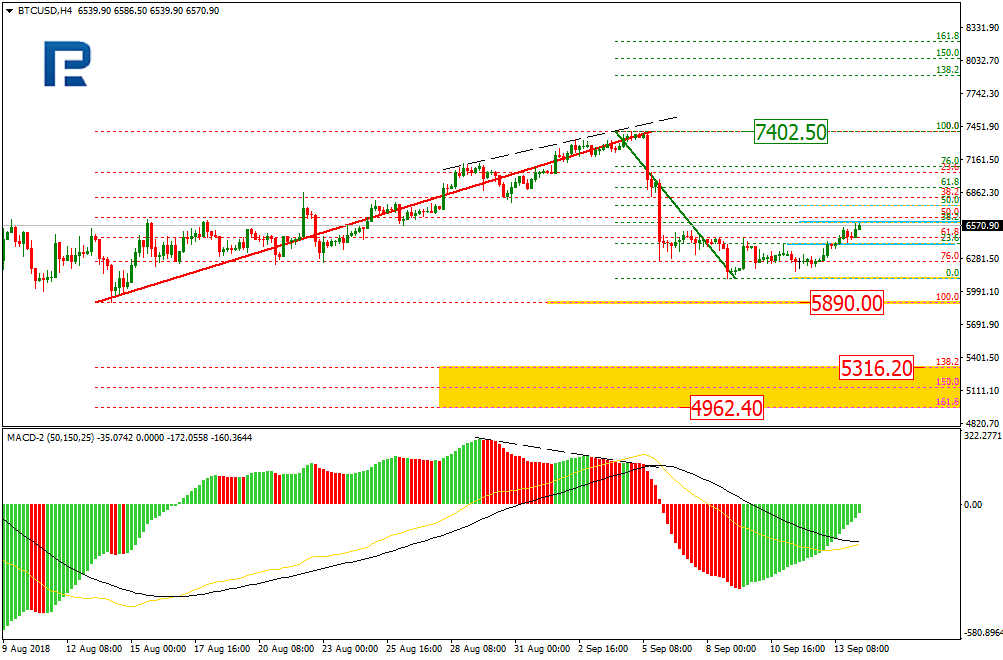
As we can see in the H4 chart, BTCUSD has quickly formed the descending impulse and started a new correction to the upside. However, the target of the long-term downtrend is 5890.00. If the price breaks this level, the instrument may continue trading towards the post-correctional extension area between the retracements of 138.2% and 161.8% at 5316.20 and 4962.20 respectively.
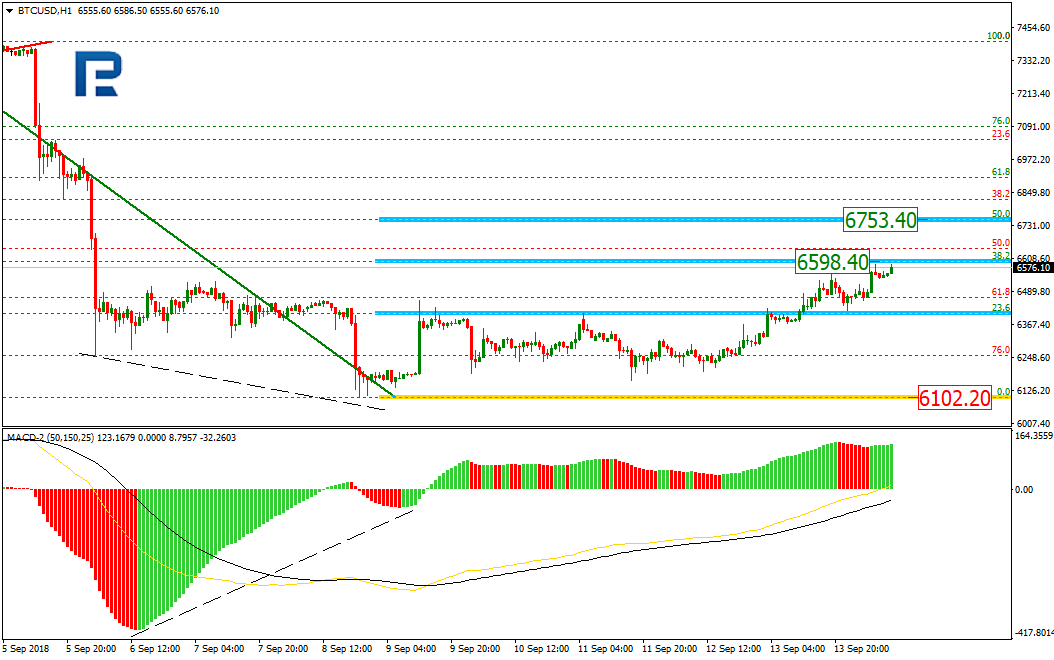
In the H1 chart, the convergence made the pair start a new rising correction, which has almost reached the retracement of 38.2% at 6598.40 and may continue trading towards the retracement of 50.0% at 6753.40. The support level is the low at 6102.20.
ETHUSD, “Ethereum vs. US Dollar”
As we can see in the H4 chart, the convergence made ETHUSD start a new uptrend, which has almost reached the retracement of 38.2%. The next upside targets may be the retracements of 50.0%, 61.8%, and 76.0% at 234.40, 250.60, and 269.70 respectively. The support level is the low at 166.85.
The H1 chart shows the more detailed structure of the current uptrend.
Attention! Forecasts presented in this section only reflect the author’s private opinion and should not be considered as guidance for trading. RoboForex LP bears no responsibility for trading results based on trading recommendations described in these analytical reviews.
EURUSD has completed another ascending structure. Possibly, today the pair may be corrected to reach 1.1625 and then form a new ascending structure towards 1.1666, thus forming a new consolidation range. If the instrument breaks this range to the upside, the price may resume growing to reach 1.1731; if to the downside – start a new decline with the target at 1.1525.
GBPUSD, “Great Britain Pound vs US Dollar”
GBPUSD has finished the ascending structure. Possibly, today the pair may be corrected to reach 1.2991 and then grow towards 1.3060, thus forming a new consolidation range. If the instrument breaks this range to the upside, the price may form a new ascending structure to reach 1.3190; if to the downside – continue trading inside the downtrend with the target at 1.2842.
USDCHF, “US Dollar vs Swiss Franc”
USDCHF has broken its consolidation range downwards and reached the short-term target. Today, the price may grow towards 0.9696 and then form a new descending structure with the target at 0.9640.
USDJPY, “US Dollar vs Japanese Yen”
USDJPY has finished one more ascending structure and completed this wave. Possibly, today the pair may be corrected to reach 111.58 and then grow towards 111.82, thus forming a new consolidation range. If the instrument breaks this range to the downside, the price may continue trading inside the downtrend with the first target at 111.11.
AUDUSD, “Australian Dollar vs US Dollar”
AUDUSD is moving downwards with the target at 0.7155. Later, the market may form another ascending structure to reach 0.7234 and then resume falling with the short-term target at 0.7030.
USDRUB, “US Dollar vs Russian Ruble”
USDRUB is still moving downwards. Today, the price may grow to reach 69.05. After that, the instrument may resume falling towards 67.65 and then start a new correction with the target at 69.05.
XAUUSD, “Gold vs US Dollar”
Gold has finished the descending impulse and right now is being corrected towards 1206.25. Later, the market may resume falling to reach 1186.20.
BRENT
Brent is moving upwards to reach 78.73. After that, the instrument may fall towards 77.00 and then start a new growth with the target at 80.35.
Attention! Forecasts presented in this section only reflect the author’s private opinion and should not be considered as guidance for trading. RoboForex LP bears no responsibility for trading results based on trading recommendations described in these analytical reviews.
In the past few years, American attitudes toward China have been shifting. The changeshift did not start in the Trump era, as US observers argue. It began with President Obama’s effort to militarize and split Asia.
As the veteran journalist’s Bob Woodward’s new book Fear: Trump in the White House, is shaking the Trump administration and the polarized America, Washington’s trade hawks threaten to escalate their tariff wars. Historically, times of trade wars and protectionism tend to go hand in hand with negative attitudes toward other nations – and our era is no exception.
According to newly-launched survey by Pew Research Center, American attitudes toward China have become somewhat less positive over the past year. Overall, 38% of Americans have a favorable opinion of China, down slightly from 44% in 2017. In recent years, something similar has also been reported in America regarding the attitudes toward other countries, particularly emerging and developing nations.
According to Pew authors, attitudes toward China have fluctuated to some extent in recent years, becoming more negative during the 2012 election cycle, but more positive in 2017, before this year’s decline. Their title reflects their conclusion: “As Trade Tensions Rise, Fewer Americans See China Favorably.”
Nevertheless, the title ignores causal links that go far beyond the recent trade war and involve US geopolitics in the post-Cold War, at the expense of economic cooperation.
How US geopolitics is shaping negative China perceptions
Through the post-Cold War era, every presidential campaign has had its share of China-bashing, from Bill Clinton blaming George H. W. Bush for “coddling the butchers of Beijing” to Trump’s allegation that “China is raping America.” Accordingly, positive perceptions of China have been systematically replaced by negative perceptions toward the end of the campaign seasons in 2008, 2012, and 2016.
In Obama’s first term, perceptions were more positive because in the post-crisis White House, the focus was on the U.S. financial turmoil, not on China. To avoid the Great Depression 2.0, America needed the support of the rest of the world, and particularly that of China, which at the time accounted for half of global growth prospects.
But after interest rates had been cut to zero and rounds of quantitative easing began, President Obama opted for very different policies. As he launched his geopolitical ’pivot to Asia’, while starting the talks about a US-led Trans-Pacific Partnership (TPP), which excluded China, American people got the message. From 2011 to 2014, favorable American attitudes toward China plunged from more than 50% to barely 35%.
As this adversarial shift was then coupled with Trump’s presidential campaign, which blamed America’s economic fall on China, and Hillary Clinton’s Democratic campaign, which portrayed China as a global military risk, American perceptions stayed unfavorable until 2016.
Nevertheless, once the election was over, American China perceptions, once again, began to grow more positive in 2017, as trade tensions were relieved. But the status quo changed dramatically to more negative as Trump launched his tariff war against China (Figure).
Figure American Attitudes toward China
Source: Survey data from Pew Research Center.
Old age cohorts, old China perceptions
The Pew survey does reveal something positive as well. There is a significant generation gap between those American age groups that grew of age in the Reagan years, or during the Cold War – and more youthful American age cohorts.
Half of 18- to 29-year-olds (49%) express a favorable view of China, compared with 30-49-year-olds (37%) and 50 and older (34%). They are growing of age in a more multipolar era, which many see as an opportunity, not as a threat.
Nevertheless, the challenge is that US tariff wars are being led by uber-Republicans, who belong the oldest age cohort.
Trump himself is 72 years old. His US Trade Representative Robert Lighthizer, who initiated his trade wars already in the Reagan era, is almost as old. And Secretary of Commerce Wilbur Ross, is over 80 years old. Even the China-bashing architect of the trade wars, Director of Trade and Industrial Policy Peter Navarro, and Trump’s trade adviser, Dan DiMicco, former CEO of US steel giant Nucor, are close to the 70.
It is an ancient but potentially fatal combination. As old politicians and policymakers find it hard not to wage battles over their bygone past, they threaten to penalize the future of their children.
About the Author:
Dr. Dan Steinbock is the founder of Difference Group and has served as research director at the India, China and America Institute (USA) and visiting fellow at the Shanghai Institutes for International Studies (China) and the EU Center (Singapore). For more, see https://www.differencegroup.net/
The original version was published by Chinaorg, China’s official government portal on September 12, 2018
Notes
Wike, R. and Devlin, K. 2018. “As Trade Tensions Rise, Fewer Americans See China Favorably.” Pew Research Center, Aug 28.
Diamond, J. 2016. “Trump: ‘We can’t continue to allow China to rape our country.’”’” CNN, May 1. On China bashing in recent presidential campaigns, see e.g., “A Mainstay of Presidential Campaigning: China Bashing.” CBS News, Aug 28, 2015; and Green, J. 2011. “China Bashing on the Campaign Trail.” Bloomberg BusinessWeek, Nov 18.
The ECB, as expected, kept the main parameters of monetary policy at the same level. The regulator worsened the forecast for GDP growth for 2018-2019, and also expressed concern about the trade conflict and the unstable situation in the markets of developing countries. The US published a weak inflation report, which caused pressure on the US currency. Yesterday, the bullish sentiment prevailed on the EUR/USD currency pair. The growth of quotes exceeded 70 points. At the moment, the trading instrument is consolidating in the range of 1.16850-1.17150. The EUR/USD currency pair has the potential for further growth. Positions should be opened from the key levels.
The news feed on 2018.09.14:
At 15:30 (GMT+3:00) we expect a report on retail sales in the US.
Indicators point to the power of buyers: the price has fixed above 50 MA and 200 MA.
The MACD histogram is in the positive zone and continues to rise, which indicates the bullish sentiment.
Stochastic Oscillator is located near the overbought zone, the %K line is above the %D line, which gives a weak signal to buy EUR/USD.
Trading recommendations
Support levels: 1.16850, 1.16450, 1.16150
Resistance levels: 1.17150, 1.17500
If the price fixes above the resistance level of 1.17150, further growth of the EUR/USD quotes is expected. The movement is tending to 1.17500-1.17750.
An alternative may be the decrease of the EUR/USD currency pair to 1.16850-1.16700.
The GBP/USD currency pair
Technical indicators of the currency pair:
Prev Open: 1.30379
Open: 1.31061
% chg. over the last day: +0.48
Day’s range: 1.31021 – 1.31313
52 wk range: 1.2361 – 1.4345
The GBP/USD currency pair shows positive dynamics. Yesterday, the growth of quotes exceeded 75 points. The Bank of England, as expected, kept the range of the key interest rate at the previous level of 0.75%. At the moment, the key support and resistance levels are: 1.30850 and 1.31350, respectively. The trading instrument has the potential for further growth. Positions should be opened from the key levels.
At 13:00 (GMT+3:00) the speech by the Bank of England governor Carney will take place.
The price has fixed above 50 MA and 200 MA, which signals the power of buyers.
The MACD histogram is located in the positive zone, but below the signal line, which gives a weak signal to buy GBP/USD.
Stochastic Oscillator is in the neutral zone, the %K line has crossed the %D line. There are no signals at the moment.
Trading recommendations
Support levels: 1.30850, 1.30300, 1.29800
Resistance levels: 1.31350, 1.31600
If the price fixes above the resistance level of 1.31350, further growth of the GBP/USD quotes is expected. The movement is tending to 1.31600-1.31750.
An alternative may be the decrease of the GBP/USD currency pair to 1.30850-1.30750.
The USD/CAD currency pair
Technical indicators of the currency pair:
Prev Open: 1.29927
Open: 1.29937
% chg. over the last day: +0.07
Day’s range: 1.29827 – 1.30075
52 wk range: 1.2059 – 1.3795
At the moment, the USD/CAD currency pair is consolidating. A unidirectional trend is not observed. Financial market participants expect additional drivers. The trading instrument is testing local support and resistance levels: 1.29850 and 1.30200, respectively. The USD/CAD quotes have the potential for further decline. We recommend monitoring the current information regarding NAFTA negotiations.
The news feed on the economy of Canada is calm.
The price has fixed below 50 MA and 200 MA, which indicates the power of sellers.
The MACD histogram is in the negative zone, but above the signal line, which gives a weak signal to sell USD/CAD.
Stochastic Oscillator is in the neutral zone, the %K line is above the %D line, which indicates the bullish sentiment.
Trading recommendations
Support levels: 1.29850, 1.29500, 1.29200
Resistance levels: 1.30200, 1.30500, 1.30750
If the price fixes below the local support of 1.29850, the USD/CAD quotes are expected to fall. The movement is tending to 1.29500-1.29200.
Alternative option. If the price fixes above the 1.30200 mark, it is necessary to look for entry points to the market to open long positions. The target movement level is 1.30500-1.30750.
The USD/JPY currency pair
Technical indicators of the currency pair:
Prev Open: 111.259
Open: 111.921
% chg. over the last day: +0.68
Day’s range: 111.786 – 112.077
52 wk range: 104.56 – 114.74
Yesterday, aggressive purchases of USD/JPY were observed. The growth of quotes exceeded 70 points. At the moment, the trading instrument is moving in flat. Local support and resistance levels are 111.800 and 112.100, respectively. The positions should be opened from these marks. We recommend paying attention to the news feed on the US economy.
The publication of important economic reports from Japan is not planned.
The price has fixed above 50 MA and 200 MA, which signals the power of buyers.
The MACD histogram is located in the positive zone, but below the signal line, which gives a weak signal to buy USD/JPY.
Stochastic Oscillator is in the neutral zone, the %K line is crossing the %D line. There are no signals at the moment.
Trading recommendations
Support levels: 111.800, 111.650, 111.300
Resistance levels: 112.100, 112.500
If the price fixes above the resistance level of 112.100, further growth of the USD/JPY quotes is expected. The movement is tending to 112.500-112.750.
Alternative option. If the price fixes below the level of 111.800, we recommend looking for entry points to the market to open short positions. The target movement level is 111.500-111.300.
Yesterday, the US dollar continued to lose ground relative to currency majors. The dollar index (#DX) moved away from the local highs and closed the trading session in the negative zone (-0.25%). The US published weak data on inflation, which caused pressure on the US currency. In August, the core consumer price index slowed down from 0.2% to 0.1%. At the moment, investors expect a report on retail sales in the US.
The Bank of England and the ECB, as expected, kept all main parameters of the monetary policy. The central bank of the UK expects a slowdown in inflation next year. The regulator plans to adhere to a gradual increase in the interest rates taking into account market conditions. The ECB lowered the forecast for GDP growth in the Eurozone for 2018 and 2019 to 2.0% and 1.9%, respectively. The head of the Central Bank is concerned about the risks related to the trade conflict and the unstable situation in the markets of developing countries. The regulator plans to adhere to the current rate of monetary policy.
The “black gold” prices are consolidating. At the moment, futures for the WTI crude oil are testing a mark of $69.00 per barrel.
Market Indicators
Yesterday, the major US stock indices closed in the positive zone: #SPY (+0.59%), #DIA (+0.59%), #QQQ (+1.07%).
At the moment, the 10-year US government bonds yield is at the level of 2.97-2.98%.
The news feed on 14.09.2018:
At 15:30 (GMT+3:00) a report on retail sales will be published in the United States.
We also recommend paying attention to the speech by the Bank of England governor Carney at 13:00 (GMT+3:00).
On Thursday the 13th of September, trading on the euro closed up. Activity on the market was observed during the US session where the euro rose by 90 pips to 1.1701.
The ECB and the BoE left the main rates unchanged. ECB President Mario Draghi said that the first rate hike was not discussed. At the end of the month, the share repurchase program will be decreased from 30 billion euros to 15 billion euros. The share repurchase program will continue until the end of this year. If it is no longer necessary, it will come to an end. Growth forecasts for the Eurozone were reduced from 2.1% to 2.0% this year, and from 1.9% to 1.8% in 2019.
US data was published during Draghi’s press conference. The inflation report disappointed traders, so the US dollar came under pressure. I conclude that the strengthening of the euro is due to weak data, and not the ECB head’s speech. US CPI was below forecasted expectations, which led to a weakening of the dollar.
Day’s news (GMT+3):
12:00 Eurozone: trade balance (Jul).
13:00 UK: BOE’s Governor Carney speech.
15:30 US: retail sales, IPI (Aug).
17:00 US: Michigan CSI (Sep).
20:00 US: Baker Hughes US oil rig count.
Fig 1. EURUSD hourly chart.
Current situation:
The fundamental events did not coincide with the weekly forecast. Instead of falling to the level of 1.1576, the euro rose to 1.1701. I warned you that the forecast does not take into account the fundamental events, so during Draghi’s speech, the price could go the other way. Which it did.
The price broke through the trend line at 1.1733, as well as the high of the previous week – 1,1659. It would be nice to hit a new high to complete the upward movement. The price may rise to 1.1740. Since the price is at the top line of the channel, I limited myself to 1,1715. As soon as a bearish divergence between AO and the price is formed, you can look to enter a short position. To sum up the day, I expect a correction to the balance line at 1.1650.
RoboMarkets, a EU-based financial company offering advanced online trading solutions, announces new additions to the multimarket R Trader platform features.
The new features include the following:
Strategy Builder Improvements
Indicators with equal parameters, such as fractals, can now be compared on different bars. The feature is available in the Strategy Editor.
Depth of Market (DoM)
Level 2 market depth enables tracking even the smallest price changes, which allows the traders to better understand current market conditions. This tool is also good for planning entries and exits in long term strategies.
Trailing Stop
Now you can add a trailing stop to your position in R Trader, i.e. a stop order that will be following the price. With a trailing stop, you can minimize your losses without limiting profits. To place such an order, you only need to specify the number of pips from the current price. If the price moves your way, the trailing stop will follow it and will get hit only once the price gets back number of pips specified. Trailing stop works on the server side and won’t stop working in case the client gets shut down.
Time&Sales
This tool is available for stocks and cryptocurrencies and shows the price, direction, volume and time of the transactions run on the specified instrument. This enables understanding how many buyers and sellers there are approximately in the market, and how big their overall position amounts are.
Managing Watchlists with Keyboard
You can now add an unlimited number of instruments to Watchlists to quickly monitor multiple assets at the same time.
Kiryl Kirychenka, R Trader Project Manager, says: ‘We always listen to our clients’ feedback and make every effort to offer them the best conditions so that they may trade more effectively. Since its inception around 12 months ago, R Trader has become a breakthrough in online trading, offering multiple features and functions. Ever since, it has been improved on, and even more features have been added. R Trader is one of the best platform in the market thanks to a large selection of instruments, fast order execution, cloud support, and a native trading robot builder.‘
About R Trader
R Trader is brought to you by RoboMarkets and UMSTEL, a fintech company working on a cloud-based multi-market trading platform. R Trader enables access to over 11,000 instruments across 8 asset classes. This platform is user friendly and guarantees maximum transaction transparency, while also being in line with the leading desktop trading terminals. For more information on R Trader, please go to www.robomarkets.com
About RoboMarkets
RoboMarkets is an investment company with the CySEC license No. 191/13. RoboMarkets offers investment services in many European countries by providing traders, who work on financial market, with access to its proprietary trading platforms. More detailed information about the Company’s products and activities can be found on the official website at www.robomarkets.com.