The US dollar fell slightly against the basket of major currencies. The US dollar index (#DX) closed in the negative zone (-0.28%). However, in general, demand for the American currency is still high. Yesterday, the US introduced new duties on import of Chinese goods $200 billion worth. At the same time, Donald Trump threatened Beijing that if China retaliated, the US would be forced to introduce additional tariffs $267 billion worth.
Today, during the Asian trading session, a report on the monetary policy of the Bank of Japan has been published. As it became known, the regulator left the monetary policy unchanged. The 10-year government bonds yield of Japan remained at the level of around 0%, while the BoJ interest rate on deposits is at the level of -0.1%.
The “black gold” prices show positive dynamics. At the moment, futures for the WTI crude oil are testing a mark of $69.75 per barrel. Investors expect a report on the US crude oil inventories at 17:30 (GMT+3:00).
Market Indicators
Yesterday, the bullish sentiment was observed in the US stock market: #SPY (+0.54%), #DIA (+0.74%), #QQQ (+0.83%).
The 10-year US government bonds yield continues to show positive dynamics. At the moment, the indicator is at the level of 3.04-3.05%.
The news feed on 19.09.2018:
– Consumer price index in the UK at 11:30 (GMT+3:00); – Statistics on the real estate market in the US at 15:30 (GMT+3:00).
We also recommend paying attention to the speech by the ECB president Draghi.
On Tuesday the 18th of September, trading on the euro closed down. Volatility was high throughout all the trading sessions. In the first half of the day, the euro rose to 1.1710. It then dropped to 1.1652 in the US session on the back of a rise in US10Y bond yields to 3.06%. Demand for the US dollar increased after China announced that it would be bringing in new trade tariffs from the 24th of September on more than 5,200 US goods worth 60bn USD.
Day’s news (GMT+3):
11:00 Eurozone: current account (Jul).
11:30 UK: CPI (Aug), retail price index (Aug), PPI – output (Aug), PPI – input (Aug).
12:00 Eurozone: construction output (Jul).
15:30 US: building permits (Aug), housing starts (Aug), current account (Q2).
16:00 Eurozone: ECB President Mario Draghi’s speech.
17:30 EIA crude oil stocks change (14 Sep).
Fig 1. EURUSD hourly chart.
Current situation:
The euro revisited last week’s high, but buyers failed to break through as the news from China pushed them back to the LB balance line.
Last week’s high was revisited ahead of time. If bulls revisit it again, there’s an increased risk of breaking 1.1725. Demand for the euro could increase on expectations that the Fed may not raise interest rates in December due to the trade war with China.
From a technical standpoint, the pair is ready to decline. I’ve considered various patterns that fit the current situation. Some of them suggest that 1.1652 will be revisited. My question is what will traders react to today?
Today I expect to see the euro recover to 1.1766. It’s worth keeping an eye on British data. The pound could act as a catalyst for some of the major pairs in today’s European session. If the bulls return to 1.1740, I expect a rebound from there. It’s too early for a breakout there.
Recent downside pricing pressure on Technology and FANG stocks have kept investors wary of jumping back into the market while we wait to see where the bottom may form. Concerns about long-term pricing pressures, US trade wars and the continued Congressional testimony regarding privacy and censorship issues have kept social media technology stocks in a negative perspective. The only aspect of this pricing pullback that is positive is that these stocks will, at some point, find a price bottom and attempt to rally as investors rush back into their favorites attempting to ride the run higher.
Our researchers believe the current price levels could be a prime example of a short-term bottom setting up in certain technology stocks. Both Apple and Amazon are two of the biggest and most actively traded stocks on the US Stock exchange. They differ from many of the other FANG stocks because these companies actually produce and sell consumer products & services that are, in many ways, essential to conducting commerce and trade.
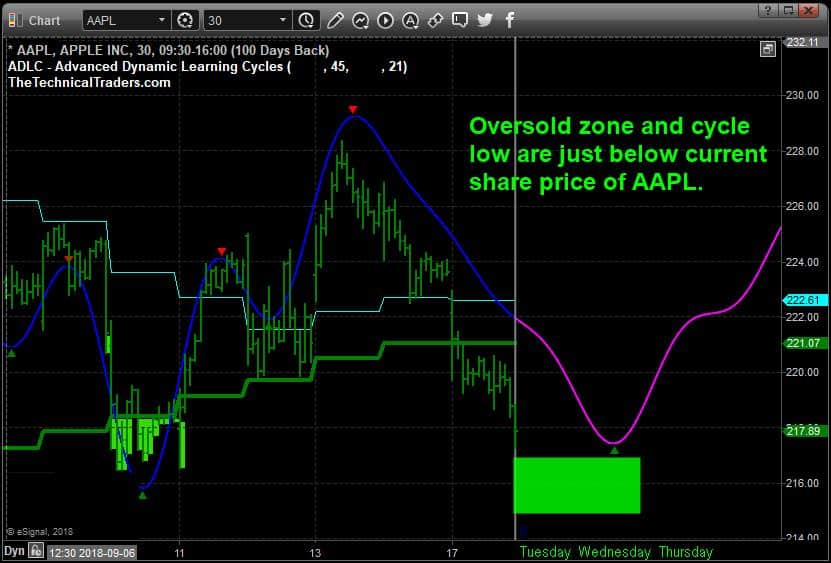
This 30-minute chart of Apple shows our Adaptive Dynamic Learning Cycles price modeling system showing a cycle low is setting up over the next day or two in Apple followed by an upside price cycle that should push prices back above $220. Notice the oversold levels highlighted in BRIGHT GREEN. The last major oversold levels setup just below $218. The current oversold levels are setting up just below $217. We believe these $217 levels will likely set up a price bottom and prompt an upside price rally over the next 5+ days that could push Apple prices well above $225.
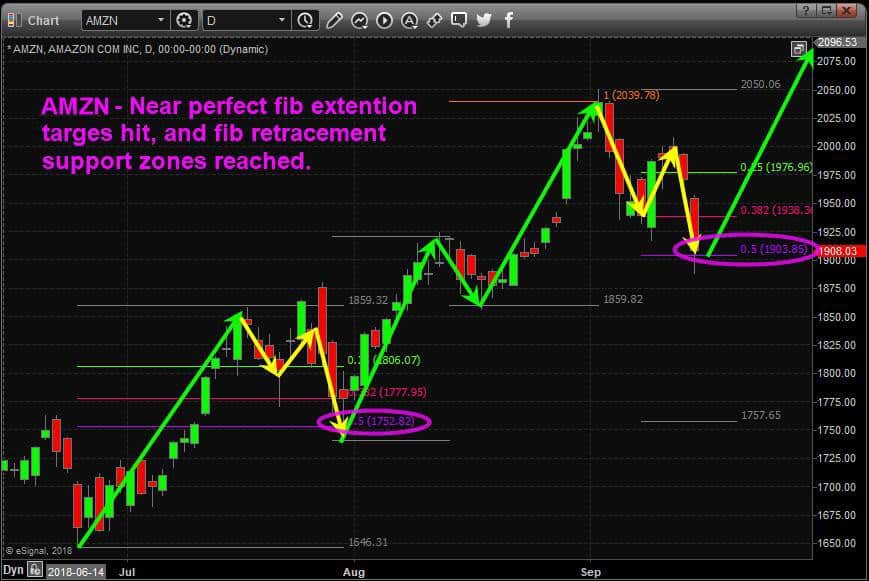
Amazon is setting up a different type of price bottoming formation – a Fibonacci price retracement bottom. We use these Fibonacci price retracement levels in conjunction with our other price modeling systems to attempt to determine where and when price reversals may be set up in the future. In this example, we can see a price bottom formed in early August off a Fibonacci 50% price pullback and the current price pullback is testing the same 50% level. We believe this current setup will prompt a price bottom to form and an upside price rally will likely result in AMZN rushing back above $2000 again with a few days.
These types is similar price patterns that show the characteristics of stock price action. Each stock inherently exhibits unique pricing trends and characteristics. Very few are identical in price structure/setup. Although, sometimes certain sectors move in unison.
Our predictive price modeling and cycling systems help us to identify the core price function behind the price action. We use these advanced predictive tools to help us understand what is the most likely future outcome of certain stocks and when we see opportunities, we try to alert our followers and members. Our most recent pick was IYT and we’ve been riding that trend for over 5 weeks now.
Yesterday, we posted a research article regarding our other predictive analysis modeling systems and the potential for a price correction headed into the US mid-term election cycle. We strongly suggest you read that article and keep in mind that these FANGS and Technology stocks may continue to rally through general market weakness. Please take a moment to visit www.TheTechnicalTraders.com to learn how we can help you find greater success in your trading every day with our detailed market research, daily research video and clear trading signals. The end of 2018 is setting up incredible opportunities for skilled traders and early 2019 appears to be even more opportunistic. Isn’t it time you found a team that is dedicated to helping you execute more successfully?
Bitcoin will lose 50 per cent of its cryptocurrency market share to Ethereum within five years, states an influential tech expert and business analyst.
The comments from Ian Mcloed, from Thomas Crown Art, the world’s leading art-tech agency that he established with renowned art dealer, Stephen Howes, comes as Ethereum, the world’s second-largest cryptocurrency by market cap, began a price recovery on Friday after being hit hard with a major sell-off in recent weeks.
Bitcoin – the biggest digital currency – had also been in decline, but it bounced back quicker than its nearest competitor.
Indeed, Ethereum had crashed 85 per cent overall this year.
However, Ethereum is regained ground late last week, jumping almost 14 per cent after its most recent plunge, only find itself trading again 10 per cent lower once more in the past 24 hours.
What is happening? And what does the future hold for Ethereum?
Mr Mcloed observes: “Turbulence is a regular, and sometimes welcome, feature of the crypto sector. Therefore, the Ethereum rebound was, and is, inevitable.
“But not only do we think it will rebound considerably before the end of 2018, I believe that over the longer time it will significantly dent Bitcoin’s dominance.
“In fact, I think we can expect Bitcoin to lose 50 per cent of its cryptocurrency market share to Ethereum, its nearest rival, within five years.”
Why is he so confident?
“Simply, Ethereum offers more uses and solutions than Bitcoin, and it’s backed with superior blockchain technology,” says Mr Mcloed.
“This is why we use Ethereum’s blockchain in our art business. It has allowed us to create a system to use artworks as a literal store of value; it becomes a cryptocurrency wallet.
“It also solves authenticity and provenance issues – essential in the world of art. All our works of art are logged on the Ethereum’s blockchain with a unique ‘smART’ contract.”
Last month, Stephen Howes explained: “Using this cutting-edge technology, the art world can eradicate one of its biggest and most expensive problems – forgery – and can protect artists, galleries, and private owners and collectors.”
Ian Mcloed concludes: “Whilst there will continue to be peaks and troughs in the wider cryptocurrency market, due to its inherent strong core values, Ethereum will steadily increase in value in the next few years and beyond.
“Unless Bitcoin does more now to tackle scalability issues, and improves the technology it runs on, we cannot see how it can catch up with Ethereum over the next five years or so, when the crypto market will be even more mainstream.
“Ethereum is already light years ahead of Bitcoin in everything but price – and this gap will become increasingly apparent as more and more investors jump into crypto. ”
The yen is weakening considerably against the dollar by mid September, while the Japanese government is trying to calm the market down. The Minister of Finance Taro Aso said today the BoJ monetary policy is going to stay the same so as to reach the 2% inflation target, but this will require some time. The basic policy features are set by the central bank, Aso said, while any early talks on the QE shutdown may only provoke too much volatility.
This way, Aso smoothed down a bit what the Japanese Prime Minister Shinzo Abe said on Friday, highlighting the fact that the strategy of the QE shutdown is already being worked on. Such talks are not groundless, as the Bank of Japan spends a lot of money on QE in order to avoid deflation, and while it does its job, many politicians want a better effect, and that’s why they criticize the BoJ.
In the middle of this week, the Japanese central bank is going to have another scheduled meeting on monetary policy, where some decisions are to be taken. The interest rate has been negative (0.10%) for a long time, and this is another stimulus measure. After the meeting tomorrow, the traditional press conference will be held, which is of a particular interest.
An uptrend is still dominating when it comes to USDJPY. After a bounce off the midterm channel support the price formed a new short term ascending trend. Meanwhile, on H1, the price is going down towards the support, which may be broken out soon. In case 111.82 gets broken out, another support, the one of the projection channel, may be hit, at 111.30, with the next downtrend target being the midterm support at 110.85.
Disclaimer
Any predictions contained herein are based on the authors’ particular opinion. This analysis shall not be treated as trading advice. RoboForex shall not be held liable for the results of the trades arising from relying upon trading recommendations and reviews contained herein.
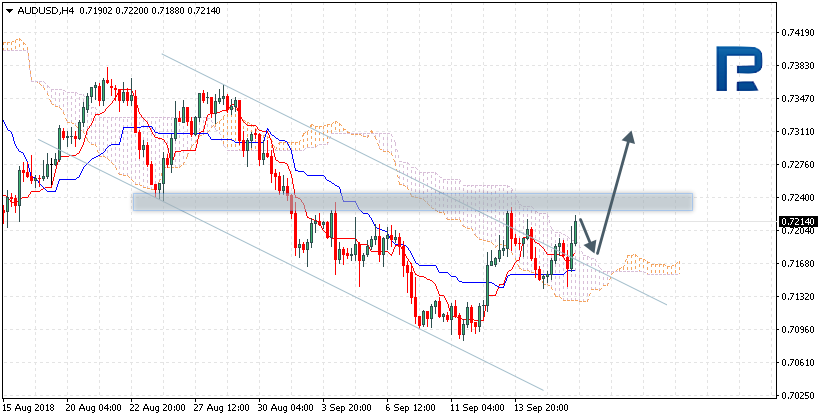
The AUD/USD is trading at 0.7214, above the Ichimoku cloud, which means there’s an uptrend forming. We expect a test of the upper cloud boundary at 0.7185, and then a rise to 0.7310, which will be confirmed with the price bouncing off the upper boundary of the descending channel. This rise may be prevented in case price breaks out the lower boundary of the Ichimoku cloud and closes below 0.7145, which will be a signal for a further fall to 0.7005 and below. Once the price breaks out the resistance area and stays above 0.7255, this will conversely confirm the price is going to rise.
NZD/USD
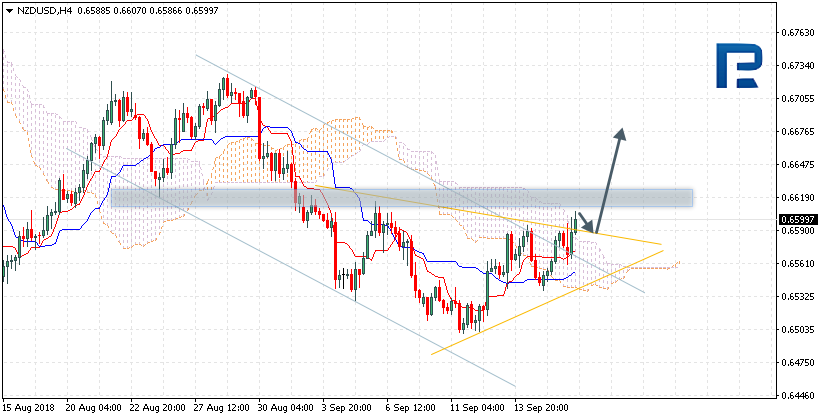
The NZD/USD is trading at 0.6599, above the Ichimoku cloud, which means there’s an uptrend forming. We expect a test of the signal lines at 0.6585, and then a rise to 0.6675, which will be confirmed with the price bouncing off the upper boundary of the triangle pattern. This rise may be prevented in case price breaks out the lower boundary and closes above 0.6530, which will be a signal for a further fall to 0.6450 and below. Once the price breaks out the resistance area and stays above 0.6635, this will conversely confirm the price is going to rise.
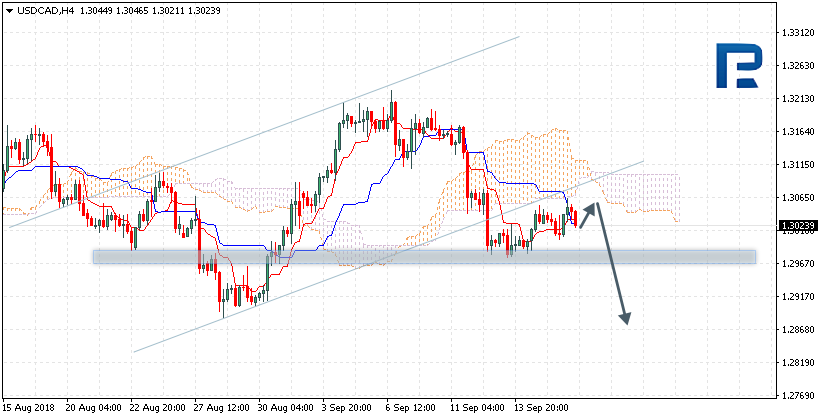
USD/CAD
The USD/CAD is trading at 1.3023, below the Ichimoku cloud, which means there’s a downtrend forming. We expect a test of the signal lines at 1.3055, and then the fall is likely to continue to 1.2865, which will be confirmed with the price bouncing off the lower boundary of the ascending channel. This fall may be prevented in case price breaks out the upper boundary and closes above 1.3105, which will be a signal for a further rise to 1.3250 and above. Conversely, the fall will be confirmed with the support breakout and the price closing below 1.2965, which will start a descending flag pattern.
Attention! Forecasts presented in this section only reflect the author’s private opinion and should not be considered as guidance for trading. RoboForex LP bears no responsibility for trading results based on trading recommendations described in these analytical reviews.
Just in time for what appears to be a potentially massive market price rotation, our researchers have put together this post to highlight what we believe will become a surprise price correction in the US Equities markets. Our team of researchers believes the correlation of our predictive modeling tools, predictive cycle tools, and other indicators are set up for what may become a massive 5~8% price rotation over the next 60 days.
We were expecting this rotation to start unfolding around mid-September (now) but at this time the technical are still bullish so we are not betting against the market just yet.
The combination of new US tariffs ($200 Billion about to hit in the China trade war), as well as a combination of technical issues with regards to Technology Stocks and retail expectations, could jolt the market if a correction does take place as our predictive modeling tools suggest. A simple rotation of 2~3% is fairly common in the markets. These predictive modeling solutions are suggesting we are just 4~5 days away from the start of a much bigger correction in the US Equities and Indexes.
We believe the coming US elections in combination with the other aspects of the global economy are going to drive a downward price correction that many people are not expecting right now. But there is one pocket of stocks that could benefit from this tariff stuff which members or our Wealth Building Newsletter just got long today!
Anyway, Let’s take a look at some of our index charts to see how this will likely play out.
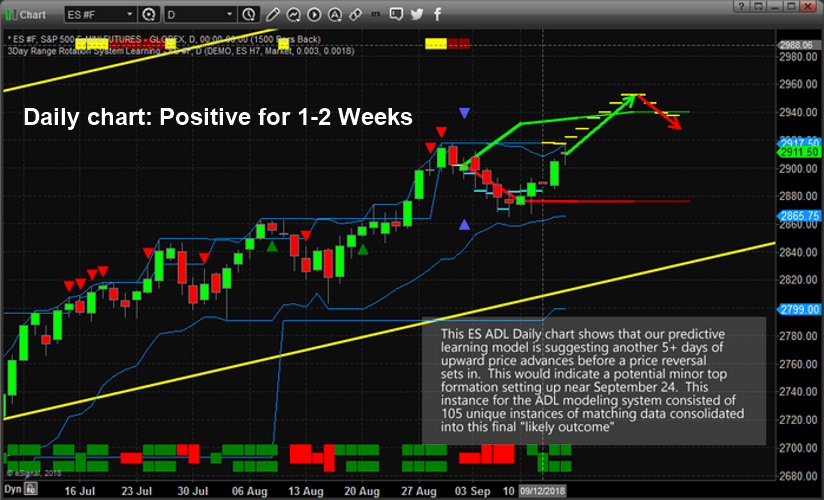
This first chart is a Daily ES chart showing our Adaptive Dynamic Learning (ADL) predictive price modeling tool. The YELLOW/CYAN dashed lines over the price bars and into the future show the highest probable outcome from the ADL predictive modeling analysis. This instance that predicts a 5~6 day price advance before a price peak sets up consisted of 105 unique instances of correlative price data making up this predictive analysis. In other words, 105 unique instances of similar predictive price patterns and predicts future price moves based on the highest likely outcome of all instances of data.
In this case, the ADL modeling system is suggesting we have about 4~6 more days of moderately higher price activity before a price top/peak will setup – prompting a new downward price trend.
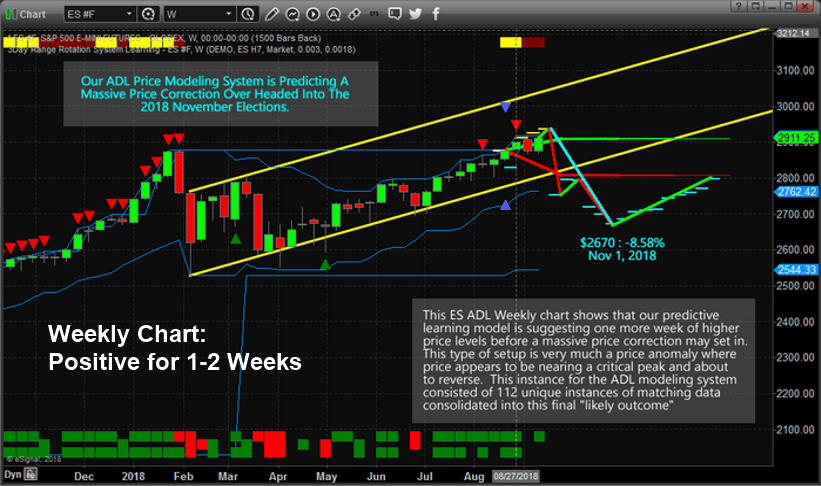
This ES Weekly ADL price chart correlates with the Daily chart almost perfectly. The Weekly chart predicts one additional week of upward price action before a massive 5~6% price decline drives prices lower. This massive price rotation executes over a 1 to 2-week span before briefly stalling, then an additional price decline of about 2% sets up driving prices to a predicted low near $2670 (-8.58%) on November 1, 2018 (just before the US elections).
This ADL analysis was generated by 112 unique instances of similar price data and the combined highest probability outcome is shown by the YELLOW and CYAN dashed lines on the chart. Simply put, we have a very high probability of a 5~8% price correction setting up over the next 20+ days in the US Equities markets with a projected bottom setting up near $2670.
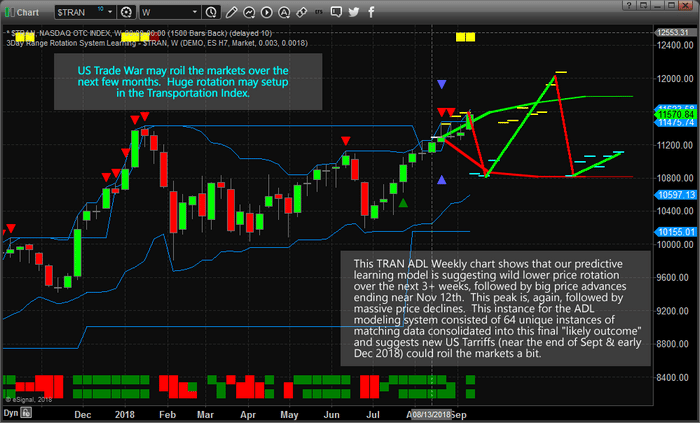
This last Weekly Transportation Index chart displaying the ADL predictive modeling system paints a very interesting picture when you combine it with the two earlier charts. The Transportation index typically leads the major markets by about 3 to 6 months. We have seen continued upside price advances in the Transportation Index over the past 6 months which leads us to think the US equities markets will continue to push higher overall. Yet, this Weekly ADL predictive modeling chart shows two massive price rotations are likely to unfold before the end of 2018. The first one is set up for a downside price rotation, ending near $10,800, starting the week of September 17, 2018, and lasting about 3~4 weeks. Then, the ADL predicts the Transportation Index will rocket higher, near $11,800, for about 5~6 weeks before falling again to retest the $10,800 lows near early December 2018.
We believe critical global news and expectations regarding global trade, banking and credit may become the catalysts for these moves. The US is expected to enact over $200 billion in trade tariffs this week with China. We believe the ADL predictive modeling system is capable of identifying these massive price rotations and predicting the future rotations simply because of the massive amounts of data that it is capable of crunching. This Weekly ADL prediction consisted of 112 unique price instances and displays only the highest probable outcome. In other words, our predictive modeling system is suggesting these price moves are likely to happen based on its analysis with a greater than 50% probability.
Please pay close attention to our research posts and other articles throughout the end of this year and early into 2019. As we have been attempting to warn our followers, expect increased volatility and wider price rotation throughout the end of this year.
We expect to find a number of incredible opportunities for our members over the next few months and we have already been incredibly successful throughout this recent price rally. Our ADL systems predicted this upside price move in February of 2018 and we have stuck with it. Now, the ADL is predicting a massive rotation is about to take place – somewhat similar to February 2018. If you want to learn how to profit from these moves, visit TheTechnicalTraders.com to learn how we help our members stay ahead of these types of market moves.
The EURUSD is consolidating and may bounce off 1.1700 today to go further down, to reach 1.1660 first, and then, after breaking it out, the first target at 1.1604.
GBPUSD
The GBP/USD is still trading higher and may reach 1.3185 today, and then fall till 1.3055. After that, the pair is likely to rise, reaching 1.3111, and then again fall till 1.2922, which is going to be the first target.
USDCHF
The USDCHF failed to stay above 0.9640. This level got broken out, and the correction may follow till 0.9608, which may be reached today. Conversely, in case the price breaks out the consolidation range and goes up, it may reach 0.9670, which is going to be the first target.
USDJPY
The USDJPY has been downtrending and correcting. Today, the pair may break out the lower range boundary to reach 111.11, but then is likely to correct to 111.65. After that, the downtrend may continue to 110.15.
AUDUSD
The Aussie has broken out 0.7187 and is going up, probably to reach 0.7234 (correctional wave 5), and then to fall till 0.7120, which is going to be the first target.
USDRUB
The USDRUB is still consolidating around 67.96; If the price goes down, it may reach 67.00; if it goes up, the correction towards 69.00 may follow, and then the pair is likely to head down again, reaching 65.40, which is going to be the first target.
GOLD
The yellow metal is trading lower, probably entering wave 5 with the target at 1,188.65. A rise to 1,200 is possible, and then the consolidation is likely to continue. If the price goes down, it may reach 1186.20.
BRENT
Crude oil is consolidating, too, but once the lower boundary gets broken out, the correction towards 75.50 may follow. If the price goes up, the rise to 80.50, the local target, is possible.
Attention! Forecasts presented in this section only reflect the author’s private opinion and should not be considered as guidance for trading. RoboForex LP bears no responsibility for trading results based on trading recommendations described in these analytical reviews.
Yesterday, the bullish sentiment was observed on the EUR/USD currency pair. Quotes rose by more than 70 points. The US dollar weakened against the basket of major currencies due to the escalation of trade conflict between the US and China. At the moment, EUR/USD quotes are consolidating. The key support and resistance levels are 1.16700 and 1.17000, respectively. We recommend opening positions from these marks.
The news feed is calm. We recommend paying attention to the speech by the ECB president Mario Draghi.
Indicators point to the power of buyers: the price has fixed above 50 MA and 200 MA.
The MACD histogram is in the positive zone and above the signal line, which gives a strong signal to buy EUR/USD.
Stochastic Oscillator is located in the neutral zone, the %K line is below the %D line, which indicates a decrease in quotes.
Trading recommendations
Support levels: 1.16700, 1.16300, 1.15900
Resistance levels: 1.17000, 1.17300
If the price fixes below 1.16700, the EUR/USD quotes are expected to decline. The movement is tending potentially to 1.16300-1.16000.
An alternative may be the further growth of the EUR/USD currency pair to the level of 1.17300-1.17600.
The GBP/USD currency pair
Technical indicators of the currency pair:
Prev Open: 1.30660
Open: 1.31328
% chg. over the last day: +0.57
Day’s range: 1.31315 – 1.31528
52 wk range: 1.2361 – 1.4345
Yesterday, the bullish sentiment was observed on the GBP/USD currency pair. The British pound strengthened against the US currency amid positive news about Brexit. At the moment, the technical pattern is ambiguous. The key support and resistance levels are: 1.31200 and 1.31600 respectively. The positions should be opened from these marks. In the near future, a technical correction is not ruled out.
The news feed on the UK economy is calm.
Indicators point to the power of buyers: the price has fixed above 50 MA and 200 MA.
The MACD histogram is located in the positive zone, but below the signal line, which gives a weak signal to buy GBP/USD.
Stochastic Oscillator is in the neutral zone, the %K line is below the %D line, which indicates a decrease in quotes.
Trading recommendations
Support levels: 1.31200, 1.30700, 1.30200
Resistance levels: 1.31600, 1.32000
If the price fixes above the resistance level of 1.31600, further growth of the GBP/USD quotes is expected. The movement is tending to 1.32000-1.32200.
An alternative may be the correction of the GBP/USD currency pair to 1.30700-1.30500.
The USD/CAD currency pair
Technical indicators of the currency pair:
Prev Open: 1.30292
Open: 1.30330
% chg. over the last day: +0.15
Day’s range: 1.30312 – 1.30373
52 wk range: 1.2059 – 1.3795
The technical pattern on the USD/CAD currency pair is ambiguous. The trading instrument is consolidating. Financial market participants expect additional drivers. Local support and resistance levels are: 1.30100 and 1.30500, respectively. We recommend opening positions from these marks. A trading instrument is tending to recover.
The news feed on the economy of Canada is calm.
Indicators do not send accurate signals: the price has crossed 50 MA.
The MACD histogram is near 0 mark.
Stochastic Oscillator has reached the oversold zone, the %K line is crossing the %D line. There are no accurate signals.
Trading recommendations
Support levels: 1.30100, 1.29800
Resistance levels: 1.30500, 1.30800, 1.31200
If the price fixes below the support of 1.30100, the USD/CAD quotes are expected to decline. The movement is tending to 1.29800-1.29500.
Alternative option. If the price fixes above 1.30500, it is necessary to consider purchases of USD/CAD. The target movement level is 1.30800-1.31000.
The USD/JPY currency pair
Technical indicators of the currency pair:
Prev Open: 112.005
Open: 111.839
% chg. over the last day: -0.25
Day’s range: 111.914 – 112.235
52 wk range: 104.56 – 114.74
There is a variety of trends on the USD/JPY currency pair. Local support and resistance levels are: 111.900 and 112.250, respectively. The positions should be opened from these marks. Investors expect additional drivers. We recommend paying attention to the US government bonds yield.
The news feed on the economy of Japan is calm.
Indicators do not send accurate signals: the price is testing 50 MA.
The MACD histogram is located near the 0 mark. There are no signals at the moment.
Stochastic Oscillator has started moving out the overbought zone, the %K line is below the %D line, which gives the signal to sell USD/JPY.
Trading recommendations
Support levels: 111.900, 111.550, 111.250
Resistance levels: 112.250, 112.600
If the price fixes above the resistance level of 112.250, the USD/JPY quotes are expected to rise. The movement is tending to 112.600-112.800.
Alternative option. If the price fixes below the level of 111.900, we recommend looking for entry points to the market to open short positions. The target movement level is 111.550-111.250.
The US dollar weakened against the basket of major currencies due to the escalation of trade conflict between the US and China. Yesterday, Donald Trump announced the introduction of a new 10% duties on import of Chinese goods $200 billion worth, which will come into effect on September 24. The US president also said that tariffs could grow to 25% if China did not make concessions. The dollar index (#DX) closed in the negative zone (-0.45%).
The British pound strengthened against the US currency amid positive news about Brexit. The first of three rounds of talks, at which the leaders of the European countries intend to conclude an agreement with the UK on favorable terms for the country’s exit from the EU, will be held this week.
The “black gold” prices are declining due to the introduction of new duties against China. At the moment, futures for the WTI crude oil are testing a mark of $68.50 per barrel. Investors expect statistics on the API weekly crude oil stock in the US at 23:30 (GMT+3:00).
Market Indicators
Yesterday, the bearish sentiment was observed in the US stock market: #SPY (-0.53%), #DIA (-0.35%), #QQQ (-1.44%).
The 10-year US government bonds yield shows positive dynamics. At the moment, the indicator is at the level of 3.00-3.01%.
The news feed on 18.09.2018:
Today, the publication of important economic reports from the US and the Eurozone is not expected. We recommend paying attention to the speech by the ECB president Mario Draghi.