The US dollar strengthened against a basket of major currencies during yesterday’s trading session. The dollar index (#DX) closed in the positive zone (+0.26%). Financial market participants assess the speech by the US President Donald Trump. The President pointed out that the priorities for this year are to resolve the issue of illegal migration and the construction of a wall on the border with Mexico. Donald Trump also noted that if an agreement was reached with China, then it should change the structure of countries’ relations in order to stop dishonest trade practices, as well as protect American jobs.
Among other issues, economic data from the Eurozone, the UK and the US were published yesterday. Thus, the index of economic activity in the services sector of the Eurozone counted to 51.2 in January, while experts forecasted 50.8. Markit composite PMI counted to 51.0 instead of 50.7. The index of economic activity in the UK services sector fell to 50.1 in January, while investors expected 51.1. The ISM non-manufacturing PMI in the US counted to 56.7 in January and was worse than the expected value of 57.2.
Today, during the Asian trading session, aggressive sales of the Australian dollar have been observed. The fall in AUD/USD quotes counted to almost 1.3%. Governor of the Reserve Bank of Australia, Philip Lowe, said that interest rates could be reduced if unemployment rose and inflation remained low.
The “black gold” prices are falling. At the moment, futures for the WTI crude oil are testing the mark of $53.40 per barrel. At 17:30 (GMT+2:00), a report on crude oil inventories will be published in the US.
Market Indicators
Yesterday, the bullish sentiment prevailed in the US stock market: #SPY (+0.42%), #DIA (+0.65%), #QQQ (+0.88%).
The 10-year US government bonds yield fell slightly. Currently, the indicator is at the level of 2.68-2.69%.
Economic Data on 06.02.2019:
At 15:30 (GMT+2:00) important economic reports from the US will be published.
We also recommend paying attention to the following statistics: – Ivey PMI in Canada at 17:00 (GMT+2:00); – Data on the labor market of New Zealand at 23:45 (GMT+2:00).
On Tuesday the 5th of February, trading on the euro closed down. The pair recommenced its decline as trading opened in Europe, with the drop gathering pace in the US session. By the end of the European session, the euro had dropped to 1.1401 against the dollar despite a disappointing services PMI report in the US.
The pound dropped against the greenback to 1.2925 on the back of weak British PMI data from the services sector, as well as a broadly stronger dollar.
Day’s news (GMT+3):
16:30 Canada: building permits (Dec).
16:30 US: nonfarm productivity (Q4), unit labour costs (Q4), trade balance (Nov).
18:00 Canada: Ivey PMI (Jan).
18:30 US: EIA crude oil stocks change (1 Feb).
Current situation:
On Monday, the bears launched an assault on the 45th degree, and then on the 67th degree on Tuesday. In Asia, the euro slid to 1.1392. I’m expecting the rebound from 1.1380 (90th degree) to be small given that the cycles are showing a decline until the 8th of February, meaning that while there will be corrections, I don’t think it worth looking at long positions until Friday.
Considering the speed of the euro’s decline, my forecast has the euro dropping to the lower line of the A-A channel or 1.1368. If the number of sales increases significantly, the pair may drop as far as 1.1356. Prepare yourselves for the possibility of a sharp drop to 1.1325. In any case, I expect to see the pair drop to this level by Friday.
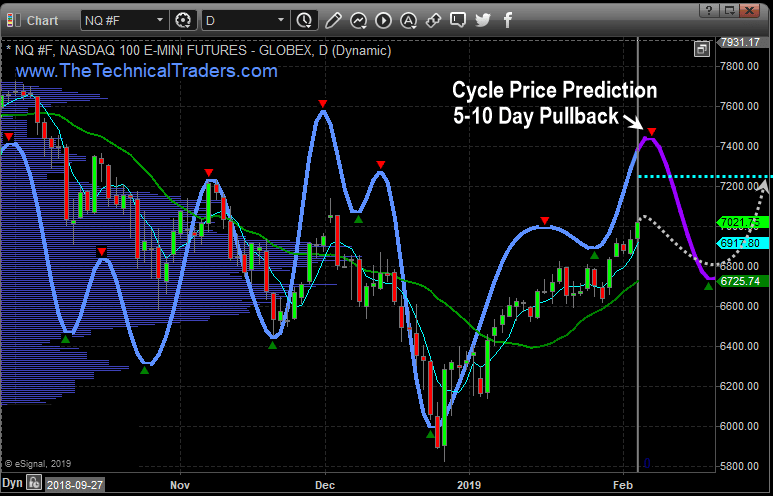
These weeks State Of The Union (SOTU) address presented by President Trump is likely to roil the markets a bit – resulting in some increased market turmoil and rotation over the next 5+ days. Additionally, we believe the tone of this message, as well as the Democratic response to the US President’s SOTU comments, will create a bit of an uneasy forward process for global investors.
Our Adaptive Price Cycle modeling system is suggesting that we would enter a phase of sideways basing over the next 5~10+ days and we believe this analysis is suggesting that uneasy global investors may view the SOTU address and any resulting conflicts as a sign that the US may not have a clear pathway forward. Washington DC acts as a leadership think-tank for the global markets. Whenever there is open conflict, a government shutdown or some increased level of uncertainty, the US stock markets typically become a bit more volatile and choppy while investors settle into forward guidance.
To highlight our thinking/research, we’ll start with this Weekly NQ chart. The current price level is about $7021 below the CYAN Fibonacci projected target level. We believe the technology-heavy NASDAQ will continue to move moderately higher over the next 30+ days – yet we feel the overall markets may rotate a bit lower to form a new momentum base after the SOTU address this week. This means we would be looking for this new momentum base to setup and for new trading triggers to be generated as a momentum breakout happens.
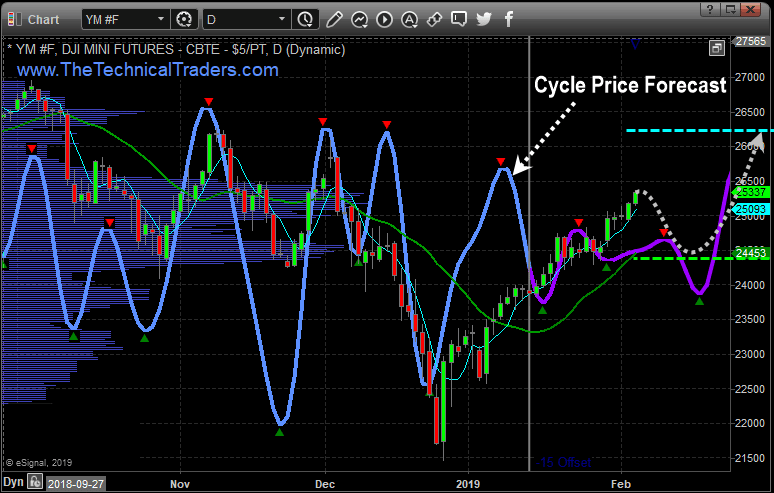
This next chart is the Weekly YM chart and it clearly shows that the current price is already above the CYAN Fibonacci projected target level. This is important because it highlights the fact that the NASDAQ has been under some pricing pressure as the FANG stocks have yet to fully recover from the December 2018 lows. It also shows that the Blue Chips and Mid-Caps have already recovered quite substantially over the past 6~7 weeks.
We would not be surprised to see the YM rotate after the SOTU address this week to levels near the CYAN Fibonacci target/support level (24,435) while setting up a new momentum base – similar to what we expect to happen in the NQ. It makes sense that this support level (24,435) would be a substantial basing level for a new momentum breakout trade to continue higher.
Our overall longer-term analysis of the US markets is that we continue to believe the upside price bias will continue and that a moderate upside “melt-up” as a renewed capital-shift continues to drive investment into the US stock market. Right now, though, we are warning that the US stock markets could be setting up for a period of 5~10+ days of rotation and volatility, after the SOTU address, that may frighten many traders. Because of this, we had our subscribers close out our GDXJ position for a 10.5% gain right at the recent high, and also took partial profits on our ROKU stock pick for a quick 8% gain. So be prepared for some sideways trading and increased volatility for the next week or two.
Visit TheTechnicalTraders.com to read all of our most recent research posts. We are confident that you will find our Daily Video, Detailed Market Research, Proprietary Research Tools and Detailed Trading Signals will help you make 2019 an incredibly successful year.
December and January were great for gold. February started off very well too, although we do currently have a small bearish correction. Does that mean that the optimism is over and we should get ready for a new drop? In my opinion, not really. Technical analysis is telling me that we should see new mid-term highs soon.
Let’s start with the fundamentals. The rise on gold can be explained by a few factors. The first one is the demand from China due to the Chinese New Year. The second factor is Brexit and the third one is the China-US trade war. What’s more, USD has been relatively weak since mid-December, which is also helping to push up gold prices.
The problem with the fundamentals is that you can explain pretty much anything with random events. The situation is different with technicals. They need to be solid and there is no room for random interpretation. In this regard, we’re on a mid-term uptrend, so the chances of a further rise are relatively high. In my opinion, the most important bullish factor here is the breakout of the 1,307 USD/oz resistance (orange). This level is absolutely crucial for the long-term situation on the chart. As long as we are above this level, the buy signal is ON. This instrument is currently in correction mode and is about to test 1,307 from above. Any bullish price action here, like a hammer or engulfing, will be an excellent buying opportunity.
My outlook on this precious metal is positive as long as the price stays above the blue upwards trend line. The potential target is the long-term high at 1,357 USD/oz. The chances that we will get there are pretty high.
On the 12th of November, we wrote a piece about the EURNZD, where our outlook was bearish. Back then, the pair was trading at 1.671 and we set our target at 1.655. At the end of January, the price went as low as 1.652, slightly below our target. This marked a drop of nearly 200 pips. I think that was quite a good call.
I must say that EURNZD is a very pleasant pair to trade because it’s very technical. As such, we will discuss the situation on this instrument again today as we can see a very promising trading setup here. The pair is still in a downtrend, but we’ve recently had a nice bullish correction. It seems that this correction ended today. The reason we think this is that the price bounced from the downwards trend line (black) and the upper line of the flag (blue). The flag is a trend continuation pattern and in theory, a breakout of the lower line should bring us a sell signal. As you can see, the bounce from that resistance is very volatile, which may indicate a rejection of this area. Another negative factor is the potential false breakout above the orange horizontal resistance. In theory, that is a strong sell signal.
When we combine all of this together, we have a nice bearish setup. The sell signal will be rejected if the pair breaks through the black line, which is not so likely to happen as it stands. On the chart, I highlighted the correction equality pattern (yellow), which is close to the 38.2% Fibonacci. In theory, that would be a great resistance but it does not look like the pair is about to climb this far.
As we can see in the H4 chart, XAUUSD has rebounded from the resistance level and formed Hanging Man, Doji, Harami, and Shooting Star reversal patterns. Judging by the previous movements, it may be assumed that after finishing another correction the instrument may continue its ascending movement.
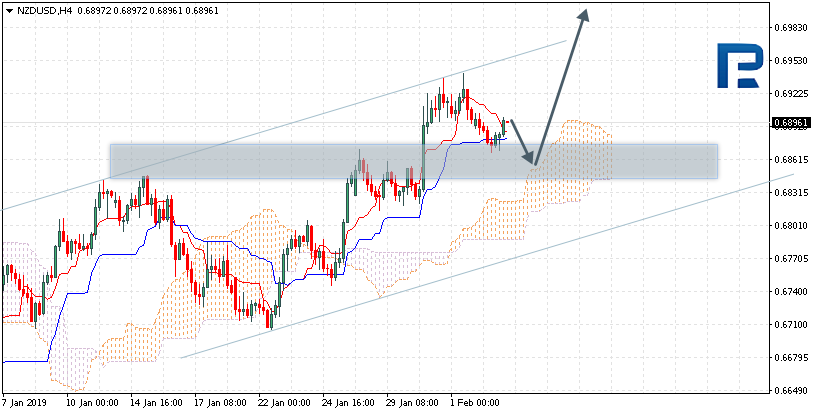
NZDUSD, “New Zealand vs. US Dollar”
As we can see in the H4 chart, NZDUSD is trading below the resistance level and forming Shooting Star, Harami, and Hanging Man reversal patterns. Judging by the previous movements, it may be assumed that the instrument may complete another pullback and then continue its growth.
Attention! Forecasts presented in this section only reflect the author’s private opinion and should not be considered as guidance for trading. RoboForex LP bears no responsibility for trading results based on trading recommendations described in these analytical reviews.
As Theresa May continues to battle to deliver her Brexit vision, the impact of the ongoing struggle is becoming clear. GBP continued its slide against the US Dollar this morning as the latest PMI data sets for the UK came in below expectations.
Brexit Taking Its Toll
The services PMI for January fell to 50.1 from 51.2 prior, undershooting expectations of a 51 reading. The UK composite PMI also fell lower in January to 50.3, below both the expected 51.5 reading and the prior 51.4 reading.
The Services PMI is now at its lowest level since July 2016 and is currently only barely above contractionary territory. With the service sector accounting for the vast majority of the UK economy, this is worrying news for investors and the BOE alike.
Although the UK has displayed resilience in the wake of the June 2016 Brexit referendum, defying the many gloomy forecasts made at the time, the last six months of heightened uncertainty around Brexit negotiations are starting to take a visible toll on economic indicators.
Traders Expecting Cautious BOE Tone
With Brexit negotiations still on a knife-edge, just eight weeks ahead of the official deadline for the UK’s departure from the EU, traders are expecting a cautious tone from the BOE at its rates meeting this week.
The BOE has made it clear that it wishes to pursue further monetary policy tightening. However, it has acknowledged the two-way risks around Brexit, and the need for a reactive policy approach should negotiations fail, with Britain ending up leaving the EU without a deal.
Technical Perspective
GBPUSD is now testing the 1.3004 support level. If we break lower than here, the next level to watch will be a retest of the broken, falling wedge pattern high, with deeper structural support at the 1.2693 level.
If price can remain above the broken bearish trend line, focus will be on a further move higher, with bulls looking for a break of the 1.3304 level next.
AUDUSD is trading at 0.7259; the instrument is moving above Ichimoku Cloud, thus indicating an ascending tendency. The markets could indicate that the price may test the upside border of the cloud at 0.7220 and then resume moving upwards to reach 0.7345. Another signal to confirm further ascending movement is the price’s rebounding from the support level. However, the scenario that Implies further growth may be cancelled if the price breaks the downside border of the cloud and fixes below 0.7155. In this case, the pair may continue falling towards 0.7045.
NZDUSD, “New Zealand Dollar vs US Dollar”
NZDUSD is trading at 0.6896; the instrument is moving above Ichimoku Cloud, thus indicating an ascending tendency. The markets could indicate that the price may test the upside border of the cloud at 0.6860 and then resume moving upwards to reach 0.7010. Another signal to confirm further ascending movement is the price’s rebounding from the support level. However, the scenario that Implies further growth may be cancelled if the price breaks the downside border of the cloud and fixes below 0.6810. In this case, the pair may continue falling towards 0.6705.
USDCAD, “US Dollar vs Canadian Dollar”
USDCAD is trading at 1.3106; the instrument is moving below Ichimoku Cloud, thus indicating a descending tendency. The markets could indicate that the price may test Tenkan-Sen and Kijun-Sen at 1.3155 and then resume moving downwards to reach 1.2985. Another signal to confirm further descending movement is the price’s rebounding from the channel’s upside border. However, the scenario that implies further decline may be cancelled if the price breaks the upside border of the cloud and fixes above 1.3240. In this case, the pair may continue growing towards 1.3335.
Attention! Forecasts presented in this section only reflect the author’s private opinion and should not be considered as guidance for trading. RoboForex LP bears no responsibility for trading results based on trading recommendations described in these analytical reviews.
EUR/USD is in a bearish mood. The USD is supported by the positive bond yield dynamics. The quotes are testing 1.14100 local support with 1.14400 acting as a mirror resistance. The trading instrument has prospects for further growth. Investors are waiting for an array of reports. You should open positions from the key levels.
The Economic News Feed for 05.02.2019:
– Business Activity Report (EU) – 11:00 (GMT+2:00);
– Non-Industrial PMI by ISM (US) – 17:00 (GMT+2:00);
Indicators do not provide precise signals, the price has crossed 50 MA
The MACD histogram is in the negative zone and keeps descending, sending a strong signal yo sell EUR/USD.
The Stochastic Oscillator is near the oversold zone, the %K line is crossing the %D line. There are no signals at the moment.
Trading recommendations
Support levels: 1.14100, 1.13800, 1.13500
Resistance levels: 1.14400, 1.14600, 1.14800
If the price fixes below 1.14100 expect the EUR/USD quotes to descend further toward 1.13800-1.13500.
Alternatively, the quotes can grow toward 1.14600-1.14800.
The GBP/USD currency pair
Technical indicators of the currency pair:
Prev Open: 1.30612
Open: 1.30360
% chg. over the last day: -0.38
Day’s range: 1.30266 – 1.30511
52 wk range: 1.2438 – 1.4378
GBP/USD remains in a long flat. The GBP is under pressure due to weak reports on business activity in the UK. GBP/USD is consolidating around 1.30150-1.30550 with further descent prospects. Keep an eye on Brexit and open positons from the key levels.
At 11:30(GMT+2:00) the UK will publish a service industry PMI.
The price fixed below 50 MA and 200 MA which points to the power of the sellers.
The MACD histogram is in the negative zone but above the signal line, which gives a weak signal to sell GBP/USD.
The Stochastic Oscillator is in the neutral zone, the %K line is crossing the %D line. There are no signals at the moment.
Trading recommendations
Support levels: 1.30150, 1.29500
Resistance levels: 1.30550, 1.31000, 1.31350
If the price fixes below the local support of 1.30150 expect the quotes to fall toward 1.29750-1.29500.
Alternatively the quotes can grow toward the round 1.31000.
The USD/CAD currency pair
Technical indicators of the currency pair:
Prev Open: 1.30891
Open: 1.31112
% chg. over the last day: +0.08
Day’s range: 1.31022 – 1.31211
52 wk range: 1.2248 – 1.3664
The CAD stabilized. USD/CAD are moving in a flat. The key support and resistance levels are 1.31000 and 1.31350. A technical correction is possible after a long fall. Keep an eye on the US news feed and open positions from the key levels.
The indicators do not provide precise signals, the price has crossed 50 MA.
The MACD histogram is close to 0.
The Stochastic Oscillator is in the neutral zone, the %K line is above the %D line, which points towards a correction of USD/CAD.
Trading recommendations
Support levels: 1.31000, 1.30700
Resistance levels: 1.31350, 1.31650, 1.32000
If the price fixes above 1.31350 expect the USD/CAD quotes to correct toward 1.31650-1.32000.
Alternatively the quotes can fall toward 1.30700-1.30500.
The USD/JPY currency pair
Technical indicators of the currency pair:
Prev Open: 109.513
Open: 109.858
% chg. over the last day: +0.48
Day’s range: 109.779 – 110.040
52 wk range: 104.56 – 114.56
USD/JPY is consolicating after a significant rally at the beginning of the month. The key levels are 109.800 and 110.100. The USD is supported by the positive Treasury bonds yield dynamic. The quotes have a potential to grow further. Keep an eye on the US economic reports.
The Economic News Feed for 05.02.2019 is calm.
The price fixed above 50 MA and 200 MA which points to the power of the buyers.
The MACD histogram is in the positive zone but below the signal line, which gives a weak signal to sell USD/JPY.
The Stochastic Oscillator is in the neutral zone, the %K line is above the %D line which points to a bullish mood.
Trading recommendations
Support levels: 109.800, 109.500, 109.200
Resistance levels: 110.100, 110.500
If the price fixe above 110.100 expect the quotes to grow toward 110.500-110.700.
Alternatively the quotes can descend toward 109.600-109.400.
It’s hard to say that AUD bulls were disappointed by the RBA’s first decision to keep rates unchanged this month, as there was next to no expectation of an increase on the cards.
In fact, AUD was seen a little stronger in response to the meeting since bulls were relieved by the lack of dovish commentary. Some players were expecting to hear the RBA talking about the potential need for further monetary support given the ongoing issues within the economy.
The statement from the RBA told a familiar story, with the central bank lamenting the continued decline in domestic house prices, headlined by their sharpest drop in 35 years over the final month of 2018, saying:
“The housing markets in Sydney and Melbourne are going through a period of adjustment, after an earlier large run-up in prices. Conditions have weakened further in both markets and rent inflation remains low. Credit conditions for some borrowers are tighter than they have been.”
Downside Risks Have Increased
However, the RBA governor Phillip Lowe did note that “downside risks have increased,” which is the perspective currently shared by the majority of G10 central banks. In this context, Lowe forecasts domestic GDP to rise “around 3% this year and by a little less in 2020 due to slower growth in exports of resources.”
Data just ahead of the meeting was mixed, with weaker December retail sales pushing AUD down before a better than expected trade balance figure helping prop price up again.
Nevertheless, the contribution from net exports is likely not the main driver given the 8% of oil imports seen in response to much lower prices recently.
Most Players Now Forecasting A Rate Cut Next
Conditions around the housing market have fuelled a surge in rate cut expectation among market players. With some regional banks increasing their mortgage rates out of cycle last year, the average owner-occupier mortgage has now jumped 14% since September 2018.
Such conditions could force the RBA to cut rates again. This would be in order to buffer against higher funding costs for households which remain heavily indebted and suffering from low incomes.
Indeed, the current conditions certainly prohibit an RBA rate rise, which is reflected in the dramatic shift we have seen in market pricing.
The last adjustment by the RBA was when it cut rates in August 2016 to sit at the current, record lows of 1.5%. Over the past two years, market sentiment has shifted dramatically with the number of players forecasting a hike having fallen to around 40% from 80%.
Technical Perspective
Despite the heavy fundamental conditions, AUDUSD is still threatening a bullish reversal here. After breaking down below the .7021 support level at the start of the year, price reversed sharply higher and has since traded back up to test the bearish trend line from 2018 highs, moving above the local high of .7237.
If price can stay above here, bulls will be looking for a break of the .7393 level to engage in further topside momentum. However, there is plenty of structural resistance overhead, given that price is sitting in the low end of the three-year range we have seen. Therefore, any upward move is likely to be choppy and labored.