Author Archive for InvestMacro – Page 283

The Analytical Overview of the Main Currency Pairs on 2019.02.18

Analytics by JustForex

The EUR/USD currency pair

Technical indicators of the currency pair:
  • Prev Open: 1.12939
  • Open: 1.12901
  • % chg. over the last day: -0.05
  • Day’s range: 1.12894 – 1.13248
  • 52 wk range: 1.1214 – 1.2557

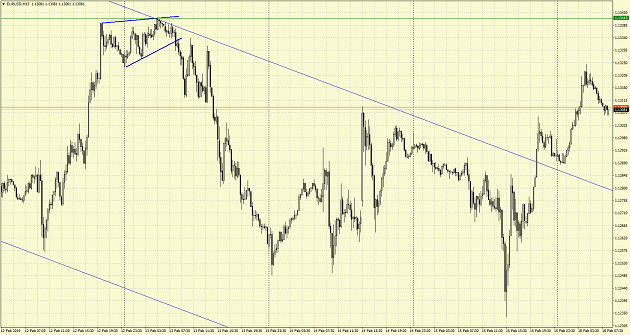
EUR started to recover and retreated from the monthly minimums. The trading negotiations between the US and China remain in the spotlight. Both sides try to reach a compromise that would prevent an increase of fees on Chinese wares after March 1. This week the countries will continue negotiations in Washington. The FOMC minutes are set to release on Wednesday, February 20. EUR/USD is consolidating around 1.13000-1.13250. You should open positions from these levels.

The US and Canadian financial markets are closed due to the holidays.

EUR/USD

The indicators do not provide precise signals, the price fixed between 50 MA and 200 MA which act as strong dynamic support and resistance levels.

The MACD histogram is in the positive zone and above the signal line which points to further correction of the EUR.

The Stochastic Oscillator is in the neutral zone, the %K line is below the %D line, which points to a descend of EUR/USD quotes.

Trading recommendations
  • Support levels: 1.13000, 1.12700, 1.12500
  • Resistance levels: 1.13250, 1.13500, 1.13750

If the price fixes above 1.13250, expect the recovery toward 1.13500-1.13750.

Alternatively, the quotes can fall toward 1.12700-1.12500.

The GBP/USD currency pair

Technical indicators of the currency pair:
  • Prev Open: 1.27972
  • Open: 1.29005
  • % chg. over the last day: +0.61
  • Day’s range: 1.28914 – 1.29203
  • 52 wk range: 1.2438 – 1.4378

On Friday, February 15, GBP/USD had an aggressive buyout. The quotes grew by 100 points and updated the local maximums. The demand grew after the positive economic reports from the UK. Right now the quotes are consolidating around 1.28750 and 1.29200. The pound can recover further. Keep an eye on the Brexit conundrum.

The Economic News Feed for 18.02.2019 is calm.

GBP/USD

The indicators do not provide precise signals, the price has crossed 200 MA.

The MACD histogram is in the positive zone but below the signal line which gives a weak signal to buy GBP/USD.

The Stochastic Oscillator is in the neutral zone, the %K line is below the %D line which points to a bearish mood.

Trading recommendations
  • Support levels: 1.28750, 1.28400, 1.28000
  • Resistance levels: 1.29200, 1.29500, 1.29850

If the price fixes above 1.29200 expect the quotes to grow further toward 1.29500-1.29800.

Alternatively, the quotes can recover toward 1.28500-1.28200.

The USD/CAD currency pair

Technical indicators of the currency pair:
  • Prev Open: 1.32905
  • Open: 1.32509
  • % chg. over the last day: -0.38
  • Day’s range: 1.32250 – 1.32538
  • 52 wk range: 1.2248 – 1.3664

USD/CAD started to descend. On Friday the quotes fell by 50 points and are consolidating around the monthly minimums. The local support and resistance are 1.32250 and 1.32600. The trading instrument has a tendency to descend further. The additional support is provided by the positive oil quotes dynamics.

The Canadian financial markets are closed due to a holiday.

USD/CAD

The indicators do not provide precise signals, the 50 MA us crossing the 200 MA.

The MACD histogram is in the neutral zone, the %K line is crossing the %D line. There are no signals at the moment.

The Stochastic Oscillator is in the neutral zone, the %K line is crossing the %D line. There are no signals at the moment.

Trading recommendations
  • Support levels: 1.32250, 1.32000, 1.31600
  • Resistance levels: 1.32600, 1.32850, 1.33250

If the price fixes below 1.32250, expect the qutoes to fall toward 1.32000-1.31700.

Alternatively, the quotes can recover toward 1.32800-1.33000.

The USD/JPY currency pair

Technical indicators of the currency pair:
  • Prev Open: 110.440
  • Open: 110.500
  • % chg. over the last day: +0.02
  • Day’s range: 110.457 – 110.613
  • 52 wk range: 104.56 – 114.56

USD/JPY has an ambiguous technical picture. The trading instrument is moving sideways, the investors are waiting for additional drivers. The safe haven currency is testing the key levels of 110.400 and 110.650. The USD/JPY quotes have a tendency to correct after a long rally. You should open positions from the key levels.

The Economic News Feed for 18.02.2019 is calm.

USD/JPY

There are no precise signals, the price has crossed 50 MA.

The MACD histogram is close to 0.

The Stochastic Oscillator is in the neutral zone, the %K line is crossing the %D line. There are no signals at the moment.

Trading recommendations
  • Support levels: 110.400, 110.250, 110.000
  • Resistance levels: 110.650, 110.850, 111.000

If the price fixes below 110.400, expect the quotes to correct toward the round 110.000.

Alternatively, the quotes can grow toward 110.850-111.000.

Analytics by JustForex

The US Dollar Slightly Weakened

by JustForex

On Friday, the US dollar slightly weakened against a basket of major currencies. The US dollar index (#DX) closed in the negative zone (-0.07%). At the moment, investors are focused on trade relations between the US and China. The next round of negotiations between the delegations of the countries will be held in Washington. Last week, the US and China reported on progress in trade negotiations, but the US President, Donald Trump, said the negotiations were difficult and he could postpone the increase in duties on Chinese goods scheduled for March 1.

On Wednesday, the FOMC meeting minutes will also be published, which may provide additional information on US monetary policy. In addition, important US economic reports will be released, including data on the durable goods orders, as well as the real estate market. At the moment, the currency majors are consolidating.

The “black gold” prices are rising. At the moment, futures for the WTI crude oil are testing the mark of $56.50 per barrel. A decrease in oil production by OPEC+ countries supported oil quotes.

Market Indicators

On Friday, the bullish sentiment was observed in the US stock market: #SPY (+1.09%), #DIA (+1.37%), #QQQ (+0.42%).

The 10-year US government bonds yield is at 2.66-2.67%.

The news feed on 18.02.2019:

Today, the publication of important economic data is not expected. Financial markets of the US and Canada are closed. Family Day is celebrated in Canada, and Presidents’ Day is celebrated in the US.

by JustForex

Learn to protect your investment in easy steps

If you are working with a very unstable market for trading, there will have to be a lot more work. The right management of the trades will have to be done. We mentioned the right management of the trades because it is very important for saving your investment. Before making any proper income from the trading business, the trading performance should save the investment. When you can learn about that properly, there can be good progress for the right income. But that will also require some attention from the traders.

We are talking about the right selection of the trading position sizes. It helps the traders a lot to establish their trades in the market. In the currency trading business, the traders will have to strictly follow this concept. From there, you will also need to select some proper protection tool for the trades. Those will help the rightful closing of the trades. When you will have to deal with a much too volatile market like Forex, it will be necessary for the trading performance. In this article, we are going to talk about the right placement of those tools.

Stop-losses is all about setting a closing point

There are two protective tools for currency trades. One of them is the stop-losses. The traders will have to set this properly for the closing of their trades when the trend is not in their support. Think about getting into a trade. You have selected a proper reward like about 2R from your trades. Then based on that, you are finding the signals to satisfy that criterion. Eventually, you have also got the most perfect possibility for a trade. Does that mean, your trade will be good for the income you have intended from it? There can be a change in the trend and the signal can go against your trade at an instant. In this condition, if you miss that change, the trade will keep running and make you lose a lot of money. For this kind of condition in the currency trading business, the traders will have to make the right selection of the stop-losses.

Find a reputed broker

Leading your dream life based on Forex trading profession requires access to the best Forex account Australia. For this very reason, successful traders always prefer reputed brokers like Rakuten. They don’t want to face any unnecessary problems associated with their trading environment. Never try to cut down the trading cost by choosing an unregulated broker. It’s even better to pay a premium fee just to ensure a professional trading environment. So chose your broker very wisely to make a consistent profit.

Work with the proper placement of the take-profit

The right protection will also have to be given with the profit limit. Think of the same kind of condition in the business. If a trader has placed the trades based on a perfect signal. But this time, the right performance is happening with the proper trend. Eventually, you will have reached the right position which satisfies your profit target of 2R. However, the change in the signal can still come right after that. For that, the traders will have to close their trades in the right position to make profits also. That is where the concept of take-profit comes into play for traders. It will be the limit (based on the exchange rate) reference from your profit target.

Selection of the profit margins

So, we learned about the right placement of the take-profits and stop-losses. But the traders will have to be right on another thing for that. It would be the proper selection of the profit target from a trade. It will work as a reference for the market analysis as well as for those tools. If you can manage the business with that, you will be secure from undue losses.

By Taylor Wilman

EURUSD: growth target at the 1.1341 resistance

By Vadim Iossub, Alpari

In the first half of Friday’s trading, the EURUSD pair continued its decline within the downwards channel with a drop from 1.1294 to 1.1234 to revisit the low from the 13th of November of last year. However, the pair underwent a sharp reversal ahead of the US session, and went on to climb to 1.1308, breaking through the upper boundary of the downwards channel that has been dictating this pair’s trajectory since the end of January. The pair then closed the week at 1.1292.

This growth was not so much the result of positives from Europe as it was negatives from the US. The USA’s import price index for January declined by 0.5% MoM against expectations of 0.1%. A reduction in import prices is a sign that inflation is slowing down, which is one factor that will go towards delaying any tightening of monetary policy. This is negative for the dollar. Moreover, capacity utilization in the US in January came out at 78.2% against an expected 78.7%, while industrial production suffered a sudden decline of 0.6% MoM where markets had expected a rise of 0.1%.

График пары EURUSD от 18.02.2019The breakout of the downwards channel has provided some impetus for growth, which was reaffirmed on Monday morning. The EURUSD reached 1.1324 before pulling back to 1.1307. The next target for the bulls is the 1.1341 resistance. There aren’t any significant news releases coming from Europe today and US markets are closed due to Presidents’ Day, so activity on the Forex market will be subdued.

Get ready for the Breakout Pattern Setup – Part II

By TheTechnicalTraders.com

Get ready for one of the most complicated price pattern setups we’ve seen in 4~5 years.  Within this multi-part article, we’re highlighting many aspects of our predictive modeling solutions, as well as some very clear patterns that we believe, are tell-all investors to prepare for the next big move.  This is the second part of our research, please take a minute to read PART I of this article.

Now for the fun part, lots of charts and a few new predictions…

Recently, the YM (the Dow Futures Contracts) have begun an upside price breakout that we believe is setting up for an incredible price pattern.  We’ve been suggesting that capital will focus on certain sectors over the past few months (Finance, Technology, Blue-Chips, and Mid-Caps).  We believe the safety provided by these US stocks have become a critical component for many global investors.  Thus, we believe the YM, Transports, and sector analysis are critical for skilled traders.

In order to highlight the price pattern that we believe will continue to set up in the YM, we’ve created a series of the chart to build upon the foundation of this pattern as well as to highlight the eventual outcome of this pattern (based on our current research and predictive modeling tools).

This first chart is a 3 Week YM Chart (where each bar represents a total of 3 weeks).  We are attempting to highlight the Expanding Wedge formation that originates near the highs of 2018 and through the early 2018 rotation.  It continues to expand through the most recent price rotation near the end of 2018 as well.  Our research suggests we are nearing the final leg of this Expanding Wedge formation and we believe this final leg will setup in a very unique pattern that allows skilled traders the opportunity to identify multiple trade entry points.  Let’s continue.


Our research team believes a complex multiple price pattern setup is in the process of forming where, ultimately, a final Pennant/Flag formation will end the complex Wedge formation – setting up a multiple opportunities for skilled traders.  The example below highlights an example of the 2015~2019 market price action.  We’ve simplified this by manually drawing this image to eliminate the moderate price rotations which can often be confusing for some traders.  The intent of this drawing is to show you how and why this pattern is important.

This next Weekly NQ chart shows a bigger picture of the pattern setup.  In the first part of this image (roughly 2015/2016), we can see a downward price channel/wedge that sets up.  Near the end of this price channel, price sets up a “higher low” which is actually a type of Flag/Pennant formation setup.  This “higher low” pattern is unique and important.  Remember our Fibonacci price theory from the first part of this article?

Price must ALWAYS attempt to establish new price highs or new price lows AT ALL TIMES.  Well, this FAILURE to establish a new price low means only one thing..  it MUST, then, attempt to establish a new price high.  The subsequent upside price breakout (a result of a US presidential election cycle as well a renewed optimism) prompted a massive upside price rally in 2017 and created the current Sideways Expanding Wedge formation in early 2018.


The current Wedge formation in this example is a close proximity of the current price rotation in the US markets (you’ll see similarities in some additional chart, below).  The important aspect of this current Expanding Wedge is that we continue to expect the Fibonacci “Failed Low” price rotation before the true upside breakout run happens.  In other words, we are currently in an upside price rally that is attempting to find/isolate the second peak of the Pennant/Flag formation (Green Below) – where it shows “We Are Here”.


Because of this setup, we are continuing to expect price rotation in the near future that will be very healthy for the overall markets.  As we’ve tried to highlight, one of the most critical components of Fibonacci price theory is that “price MUST rotate” while attempting to establish new price highs or new price lows.  Price rotation is a very healthy component of any overall trending and price rotation must occur in order for price to continue trending.  Thus, what we believe will be the setup pattern in the markets is a Pennant/Flag formation near the end of this Expanding Wedge formation.  We believe this Pennant/Flag formation is currently attempting to identify the “second peak” and we believe the next downside price rotation could be in the range of -4% to -5.5% from current highs.

This last chart highlights a longer-term perspective of our analysis and attempts to highlight the range and expectation of the future Pennant/Flag formation.  We’ve drawn this Pennant/Flag formation in MAGENTA (pink) and highlighted the individual price waves of in RED and GREEN.  We’ve also highlighted the Expanding Wedge formation in WHITE.

The range of this recent rotation is much larger than the 2015/2016 price rotation.  The breakout move (early 2017 through early 2018) resulted in a +55% upside rally in the YM.  Could a new breakout move result in another massive upside move in the YM?  If so, how big could this move be?  Well, take a look at the projected Fibonacci Price Target Levels on this chart.  From the December 2018 lows, these Fibonacci projected price targets represent a +35% (29,940) to +51% (32,500) upside move.

From current YM levels, these targets reflect a +16% to +26%.  These are HUGE upside moves.

So, our conclusion is for traders to understand this setup is likely to continue forming over the next 30~45 days and we are expecting a 4~5.5% downside price rotation sometime in the near future.  This move will setup the beginning of the Pennant/Flag formation and begin the final setup for the breakout move.  It is within this Pennant/Flag formation that we suggest skilled traders begin to position their portfolios for the upside breakout that should eventually result in incredible opportunities.  Remember to protect your trade effectively.  The Apex of the Pennant/Flag formation may include a “false rotation/breakout” price move.  This is when price would attempt to break to the downside, then stall (quickly), then reverse back to the upside and “wash out” a bunch of stops in the process.  So be prepared for this move.

Take a look at some of our recent winners to see how we help people, just like you, create success like GDXJ 10.5%, and 18% with ROKU. We believe 2019 and 2020 will be incredible years for skilled traders and we are executing at the highest level we can to assist our members.  In fact, we are about to launch our newest technology solution to better assist members and ourselves to create amazing future success. Become a member of our Wealth Trading Newsletter now and get ready for an incredible couple years of trading and investing.

Chris Vermeulen

TheTechnicalTraders.com

Here We Go – Get ready for the Breakout Pattern Setup

By TheTechnicalTraders.com

We are writing this post today with a few forward-looking expectations while attempting to warn traders that some extended rotation is likely to enter the markets over the next 30+ days.  If you’ve been following our research, you’ll know that we’ve been calling these move months in advance of other researchers and analysts.  Our September 17, 2018 research post highlighting our Adaptive Dynamic Learning predictive modeling system suggested the US stock markets were poised for a massive price rotation followed by a very unique price setup that we are experiencing now.

Currently, the YM (Dow Futures Contracts) are leading the pack on a dramatic upside breakout move.  This is likely a result of the US government spending bill that is recently working its way towards approval and the fact that this new spending bill clears the way for at least 8+ months of uninterrupted market optimism (or at least we hope).  This 300+ point upside move clearly breaks price highs and puts the US stock market, at least the Dow/Blue-Chips, back into “new high trending mode”.  As many of you are likely aware, our Fibonacci price study teaches us that price must ALWAYS seek to establish new price highs or new price lows AT ALL TIMES.  Thus, these new price highs are a very strong indication that the upside trend is dominant and should continue for a while.

Additionally, we want to highlight what we believe will be a similar price pattern to 2015/2016 in the US markets – a multiple Price Wedge formation that could ultimately set up another price leg (which we believe will be higher, to the upside, at this time).

In the next article “PART II” pay close attention to the charts and images as we are attempting to clearly illustrate how and why price rotation is about to hit the US markets and why you need to be prepared for this move.

We continue to read that large amounts of capital are sitting on the sidelines or have been pulled from the markets over the past 12+ months.  We understand this as the rotation in early 2018 frightened many investors and the continued sideways price action, global market concerns and geopolitical issues have caused international investors to want to protect their investments from risk – thus they move their capital into cash.  We get it.  But we also believe the next breakout in the US markets will be a great opportunity for skilled traders to identify and prepare for an incredible profit potential no matter which way the market breaks up or down because technical analysis allows us to closely follow the direction of the market.

The amount of capital that is sitting on OUTSIDE the markets, currently, represents a massive amount of resources that could re-enter the markets when traders/investors decide the timing is right.  We’ve termed this a “Capital Shift”.

In simple terms, it reflects capital/cash moving from one market to another or from actively invested to cash, then back to actively invested.  Our belief is that capital operates in a manner to always protect itself from risk while attempting to identify suitable returns.  The best environment for capital is always a relatively safe investment with protective values and a high probability of decent returns.  Therefore, this massive amount of capital not being deployed in the global markets will, at some time, re-enter the markets and will likely increase pricing valuations.

How and when will this capital re-enter the markets?  What will price activity look like and how will we know when the timing is right for our own strategic deployment of our trading capital?  Continue reading to learn why we believe we are only 30~45 days away from an incredible trading setup.  You won’t want to miss this one.

Please take a minute to visit TheTechnicalTraders.com to learn how we can help you find and execute better trade in 2019 and stay ahead of these market moves. We are confident that you will find our Daily Video, Detailed Market Research, Proprietary Research Tools and Detailed Trading Signals will help you make 2019 an incredibly successful year.

Chris Vermeulen
Technical Traders Ltd.


Lunar New Year sales in line with expectations

By Dan Steinbock

According to some international observers, the Lunar New Year sales indicate a plunge in Chinese consumption. Economic realities tell a different story.

Chinese Lunar New Year can be seen as a barometer for Chinese private consumption, due to gift-giving and family reunions. Consequently, both holiday data and its international coverage are of great interest.

Here’s the bottom line: During the Lunar New Year holiday in early February, Chinese retail and catering businesses generated a record over 1 trillion yuan ($148 billion). Sales by retail businesses rose 8.5% from a year earlier.

Here’s how the data has been reported internationally: “the slowest increase since at least 2011” (Bloomberg), “Cooler pace of [sales] growth added to evidence the economy is slowing” (Reuters), “China’s lunar new-year spending growth slowest since 2005” (Financial Times).

A dramatic plunge in Lunar New Year sales would indicate that China’s ongoing rebalancing is failing – and yet, that’s not the case.

Shifts in retail sales

One of the key reasons for retail pessimism in international media is that holiday spending appears to have hit profits of foreign high-end companies, such as Apple, Swatch Group and luxury car makers.

But what’s so surprising about that? Good times drive consumer nondurable and durable goods, while uncertainty undercuts the sales of relatively more expensive consumer durables (e.g., cars, appliances, furniture), and over time even cheaper nondurables (e.g., clothing, food, and clothing).

Other observers have lamented that auto purchases are in contraction for the first time in almost three decades. Inevitably, the Trump administration’s unilateral tariffs on U.S. car imports are weighing on Chinese consumers. Last year GM’s car sales were down 10%, Ford fell 37%, Tesla had to cut prices for Model 3 in China and Jaguar Land Rover temporarily closed a factory.

U.S. tariff wars have contributed to the gains of China’s domestically- manufactured models, which grew some 3.9% last year and made up more than nine of ten cars sold in January. And in the absence of tariffs, Japanese Toyota is expanding in China. Sales of the Japanese carmaker’s vehicles surged 14%, while Volkswagen held its ground.

In the 1970s and ‘80s, Japanese carmakers beat U.S. giants because the former offered smaller, more fuel-efficient and affordable models. Today, Japanese and European producers push attractive hybrid vehicles. Trump’s America does not take climate change seriously; China, Japan and Europe do.

Until spring 2018, global prospects still looked positive and expansion in the U.S. and Europe had momentum. It was the White House’s new protectionism that undermined the promising future, as evidenced by the Baltic Dry Index. It rose to almost 1,800 until July 2018. After the Trump White House began to implement its tariffs against China, the Index has plunged to less than 600 – lower than amidst the 2008 global crisis.

Consumption on track

Like their counterparts in the West, Chinese consumers are now more cost-conscious as they should be, thanks to tariff wars. But it does not follow that Chinese rebalancing toward consumption and innovation is falling.

Despite international negative hoopla, Chinese GDP growth in 2018 was broadly in line with expectations since the beginning of the year, as even World Bank has acknowledged.

Much of international media mistakes secular, long-term trends with cyclical, short-term fluctuations. So the deceleration of Chinese growth is portrayed as secular slowdown. In reality, deceleration reflects the eclipse of the intensive phase of industrialization, which heralds a shift to post-industrial society, and deleveraging, which will make that transition more resilient.

In the early 19th century, England experienced its “growth miracle.” In the late 19th century, US growth accelerated. As these countries began to move toward post-industrial services, growth acceleration gave way to deceleration. That’s the norm with industrializing economies. Similarly, a decade ago, China still enjoyed double-digit growth. But today growth is slowing relative to its past performance.

Chinese consumption is a different story, however. In 2018, it contributed 76% to GDP growth. Retail sales, the key component of consumption, rose 9% from one year earlier, down from 10.2% in 2017. Yet, both figures were 2-3% higher relative to overall GDP growth.

In other words, China’s structural rebalancing toward consumption and innovation remains on track. That’s why most analysts see consumption as the largest driver of the Chinese economy in the 2020s.

Recently, Chinese economy has accounted for some 30-40% of global growth, thanks to Chinese consumption. If and when U.S. tariff wars penalize that consumption more, global growth prospects will be undermined accordingly.

That’s the not-so-secret secret of the ongoing tariff wars. Due to its importance to global economy, China fuels growth prospects of many other economies. Consequently, unilateral tariff against China will penalize global economic prospects.

About the Author:

Dr Dan Steinbock is an internationally recognized expert of the multipolar world economy. He is the founder of Difference Group and has served at the India, China and America Institute (US), Shanghai Institute for International Studies (China) and the EU Center (Singapore). For more, see www.differencegroup.net/  

The original commentary was released by China Daily on February 14, 2019


Forex Technical Analysis & Forecast 15.02.2019 (EURUSD, GBPUSD, USDCHF, USDJPY, AUDUSD, USDRUB, GOLD, BRENT)

Article By RoboForex.com

EURUSD, “Euro vs US Dollar”

EURUSD may choose an alternative scenario and form one more ascending structure to continue the correction towards 1.1320. However, the main scenario implies that the price may fall to reach 1.1240. Possibly, today the pair may fall towards 1.1275 and then form one more ascending structure with the target at 1.1320. Later, the market may resume trading inside the downtrend to reach 1.1240.

EURUSD
Risk Warning: the result of previous trading operations do not guarantee the same results in the future

GBPUSD, “Great Britain Pound vs US Dollar”

GBPUSD has almost completed the descending structure; right now, it is consolidating near the lows. Today, the pair may fall towards 1.2770 and then grow to reach 1.2831. After that, the instrument may start a new correction with the target at 1.2900.

GBPUSD
Risk Warning: the result of previous trading operations do not guarantee the same results in the future

USDCHF, “US Dollar vs Swiss Franc”

USDCHF is consolidating; it has reached the downside border. Possibly, today the pair may start a new growth towards the upside border at 1.0100. Later, the market may form a new descending structure to reach 1.0070 and then resume trading upwards with the target at 1.0110.

USDCHF
Risk Warning: the result of previous trading operations do not guarantee the same results in the future

USDJPY, “US Dollar vs Japanese Yen”

USDJPY is moving downwards. Today, the pair may reach 110.17 and then form one more ascending structure towards 110.49. After that, the instrument may resume falling with the first target at 109.88.

USDJPY
Risk Warning: the result of previous trading operations do not guarantee the same results in the future

AUDUSD, “Australian Dollar vs US Dollar”

AUDUSD is consolidating around 0.7093. Possibly, the pair may form a new descending structure towards 0.7030 and then resume trading upwards with the target at 0.7160.

AUDUSD
Risk Warning: the result of previous trading operations do not guarantee the same results in the future

USDRUB, “US Dollar vs Russian Ruble”

USDRUB has completed the ascending structure, which may be considered as a part of the Head & Shoulders reversal pattern. The target of the pattern is at 67.14. Possibly, today the pair may reach this target and then fall to break 66.83. On the other side, the price may to extend the structure towards 67.45.

USDRUB
Risk Warning: the result of previous trading operations do not guarantee the same results in the future

XAUUSD, “Gold vs US Dollar”

Gold is still consolidating around 1308.25. If later the instrument breaks this range to the upside, the price may resume trading upwards to reach 1325.45; if to the downside – continue the correction towards 1290.40.

GOLD
Risk Warning: the result of previous trading operations do not guarantee the same results in the future

BRENT

Brent is trading upwards. Today, the pair may reach 65.19 and then start a new decline towards 62.90, at least. Later, the market may form one more ascending structure with the target at 65.55.

BRENT

Article By RoboForex.com

Attention!
Forecasts presented in this section only reflect the author’s private opinion and should not be considered as guidance for trading. RoboForex LP bears no responsibility for trading results based on trading recommendations described in these analytical reviews.

2019 Starting to Shine But is it a Long Con for Investors?

By TheTechnicalTraders.com

An odd thing happened at the beginning of 2019 for the markets – price levels across almost all sectors were deeply depressed as a result of the October through December 2018 price correction.  We’re noticing that almost all sectors of the SP500 were relatively deeply depressed just before Christmas 2018 and the recent price rally has set up an interesting psychological phenomenon – a self-propelling bullish mantra for US Stocks.

Yes, 2018 ended with a drop – almost a CRASH.  Yet, 2019 is starting off on a terror rally that is beginning to lay the grounds for a very dramatic Q1 and possibly Q2 recovery for many in the managed and passive funds.  Remember the news in early January 2019?  Hedge funds losing 12~22% or more for the 2018 end of year returns?  Remember the feeling that these firms just couldn’t find any means of success when almost the entire 2018 year was mired in deep price rotations and sideways trading?

So far, 2019 is starting out vastly different but I have to wonder if the mega players/market movers of the world planned for a very week 2018. Maybe the big plan here is to make the first half of 2019 looks incredibly strong like the bull market is still in full force to convince new money to enter while they secretly unload shares before the bear market takes hold?

If you follow our research, you’ll recall our September 17, 2018 market prediction that an “Ultimate Low” would setup after the US November 2018 elections prompting an incredible upside price rally.  You can read out exact wording here.  We followed that article with an Elections Cycle research article showing how US election cycles tend to create FEAR in the markets, read it here.

Lastly, we followed up these research pieces with our Global Market research suggesting that perceptions are changing across the planet in terms of what is an acceptable risk and where capital will likely flow in the future. If you have not read this yet be sure to do so.

We believe the psychological results of the US markets pushing very strong Q1 and Q2 returns from a very deep price origination point could drive this global capital shift to target the US markets much more quickly than we expected.  If the US markets continue to push higher with fairly narrow volatility going forward, we believe global capital will rush into the US market and undervalued technology, healthcare, basic materials and other sectors chasing the opportunity for the +5 to +8% returns on the back of a potentially strong US Dollar.  It may seem odd that this type of capital shift could even take place right now, but we believe this renewed boost of foreign capital into the US stock markets has already started and will play a big roll in a final run higher in the overall US equities market for a few months.

This Weekly NQ chart shows our Predictive Fibonacci price modeling system and suggests that volatility has already begun to narrow.  You can see the CYAN “Immediate Upside Target” level that is our current price target and the first level where resistance may be found.  Beyond that level, we enter the upward sloping YELLOW price channel from 2018 that suggests price may attempt a rally up towards the $8400 level.  You can also see our Fibonacci Projected Targets labeled “Ultimate Upside Projected Targets”.  These levels are created by an adaptive learning price modeling system where volatility, price range, price rotation, and an active learning Fibonacci modeling tool are suggesting “could be” the ultimate upside objectives.  Imagine the NQ starting 2019 near $6400 and ending it near $9200 (+43%) or $9600 (+50%) for the year??  It would be incredible and it is a possibility.

The reality is, it does not matter what the markets do, go up or down from there. Technical analysis will keep the odds in our favor for us to follow the market closely and generate strong annual gains. No one truly knows which way the markets are headed next. Personally, I feel stocks will struggle to make new highs before rolling over to start a bear market, but our ADL adaptive statical system says we should be prepared of the possibility of a 50% rally.

So who/what is correct? It does not matter, either way, we will make money, but I a bear market does start then long-term investments will need to be moved to cash or inverse investments at that time.

Take a minute to consider how the global markets will react to uncertainty and rotation while remembering that the US stock market and economy are very unique from the rest of the world.  The US economy seems to operate beyond the limitations of many other foreign markets and could turn into a safe-harbor for global capital throughout the next 2~5+ years.  Time will tell.

Please take a minute to visit TheTechnicalTraders.com to learn how we can help you find and execute better trade in 2019 and stay ahead of these market moves.

Chris Vermeulen

By TheTechnicalTraders.com


Fibonacci Retracements Analysis 15.02.2019 (BITCOIN, ETHEREUM)

Article By RoboForex.com

BTCUSD, “Bitcoin vs US Dollar”

As we can see in the H4 chart, the short-term correctional downtrend continues. After breaking the resistance at 3618.00, BTCUSD may start a new rising impulse towards the high at 3704.8 or even the mid-term retracement of 50.0% at 3786.00.

BTCUSD1
Risk Warning: the result of previous trading operations do not guarantee the same results in the future

In the H1 chart, the pair has been corrected downwards by 38.2%. In the future, the decline may continue towards the retracements of 50.0% and 61.8% at 352100 and 3478.00 respectively. At the same time, there is a convergence on MACD, which may indicate the slowdown in the downtrend.

Bitcoin
Risk Warning: the result of previous trading operations do not guarantee the same results in the future

ETHUSD, “Ethereum vs. US Dollar”

As we can see in the H4 chart, after reaching the retracement of 38.2%, ETHUSD is starting a new pullback towards the retracement of 23.6% at 114.35. The next ascending wave will be heading towards the retracements of 50.0% and 61.8% at 130.30 and 137.40 respectively.

ETHUSD1
Risk Warning: the result of previous trading operations do not guarantee the same results in the future

In the H1 chart, the pair is trading between the retracements of 23.6% and 38.2%.

Ethereum
Risk Warning: the result of previous trading operations do not guarantee the same results in the future

Article By RoboForex.com

Attention!
Forecasts presented in this section only reflect the author’s private opinion and should not be considered as guidance for trading. RoboForex LP bears no responsibility for trading results based on trading recommendations described in these analytical reviews.