Author Archive for InvestMacro – Page 207

Investors Expect the Fed Chairman’s Speech

by JustForex

The US dollar continues to hold positions against a basket of major currencies. Yesterday, the US dollar index (#DX) closed trading session with a slight increase (+0.10%). After the publication of positive data on the US labor market last week, investors expect the Fed to be less aggressive concerning further interest rate lowering. Today, the speech by the Fed Chairman J. Powell on monetary policy in the House Committee on Financial Services is in the focus of attention. According to the monetary policy report, the regulator is open to lowering the base interest rate to stimulate economic growth. According to CME FedWatch Tool, more than 95% of financial market participants believe that the Central Bank will reduce the range of key interest rate by 25 basis points to 2.00% -2.25% at a meeting in July.

UK Brexit Minister Stephen Barclay said that in order to avoid the “hard” Brexit, the withdrawal agreement should be renegotiated. The official believes that Brexit will be disruptive, first of all, not for the UK, but for the whole European Union, especially for Ireland.

The “black gold” prices are moving in different directions. At the moment, futures for the WTI crude oil are testing $57.80 per barrel. At 23:30 (GMT+3:00) API weekly crude oil stock will be published.

Market Indicators

Yesterday, there was the bearish sentiment in the US stock markets: #SPY (-0.55%), #DIA (-0.45%), #QQQ (-0.70%).

The 10-year US government bonds yield has been recovering. Currently, the indicator is at the level of 2.04-2.05%.

The News Feed on 2019.07.09:

– JOLTS job openings at 17:00 (GMT+3:00).

by JustForex

Huge Gap between US Markets and International Trade

By Dan Steinbock

Globalization is not a concern to the Trump administration, which seeks to sustain high market valuations that are not supported by the fundamentals. As a result, a global recession in 2020 would not be the worst scenario.

Since the mid-1980s, the Baltic Dry Index (BDI) has been used as a barometer of international commodity trade. It is also seen as an economic indicator of future economic growth and production.

During the years of globalization, the Index heralded the peak of the oil prices and soared to a record high in May 2008 reaching 11,793 points. But as the financial crisis spread in the advanced West, the BDI plunged by 94% to 663 points, the lowest since 1986. That’s when marine shippers were moving dangerously close to the combined operating costs of vessels, fuel, and crews.

As China and other large emerging economies chose to support the ailing advanced economies amid the global crisis in fall 2008, the US, the EU and Japan pledged they would accelerate reforms in global governance. Moreover, the central banks of the major advanced economies launched massive fiscal stimulus packages and monetary easing.

As a result, the Index returned to 4,661 in 2009. However, as promises of reforms were ignored and stimulus policies expired, the BDI bottomed out at 1,043 in early 2011, amid the European sovereign debt crisis.

During the past years, advanced economies have sustained a semblance of stability by relying on historically ultra-low interest rates (while the US Federal Reserve did exit from normalization, it is now pondering a return to rate cuts) and massive injections of quantitative easing.

Stagnation, despite hyper-monetary policies

Yet, these huge shifts have not been reflected by the BDI, which continues to stagnate, as do the advanced economies.

Another turn for the worse followed with US protectionist moves. As long as the Trump administration engaged in protectionist rhetoric but avoided a trade war, the BDI climbed to almost 1,600. As Trump opted for the trade war, the Index fell to less than 700 in early 2019 – close to its historical low amid the 2008 crisis.

Recently, there has been much optimism about the “resurgence” of the Index as the trade truce has supported its rise back to over 1,700. Yet, this increase is predicated on the trade truce. Moreover, it is a level that the Index first reached already in 2000 and the mid-1990s.

Here’s the bottom line that should worry us all: Despite huge stimulus packages after the 2008 global crisis, a decade of massive monetary injections and record-low interest rates, there has been no corresponding pickup in world trade.

In contrast, the fate of the equities, as evidenced by the Dow Jones Industrial Average (DJIA), has been very different. In the past decade, the DJIA more than tripled from its crisis low of less than 8,000 to its peak of 26,966 in early 2018, before Trump launched his war path. Supported with the trade truce, it is now again close to its historical high at more than 26,900 (Figure).

Figure Years of Globalization, Years of Stagnation, 1985-2019

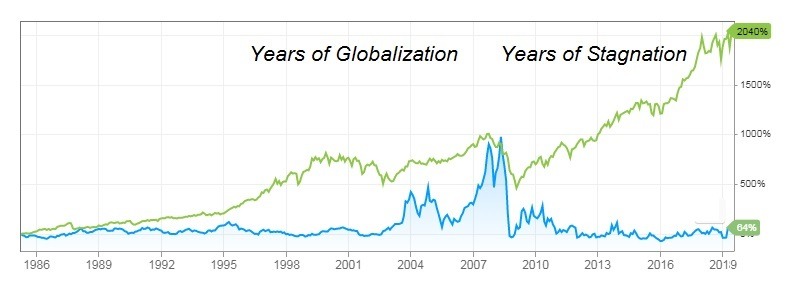
Source: Bloomberg; Baltic Dry Index; CNBC; Difference Group


Huge gap between US markets and international realities

Since the 1980s, international commodity trade, as proxied by the Baltic Dry Index, has increased by 64 percent. It remains today a tenth of its high in 2008. Meanwhile, US equities, as proxied by the Dow Jones Index, have increased by 2,040 percent. US equities have grown more than 30 times faster than international trade.

But why has the BDI not returned to its pre-crisis high? And why has it not climbed beyond that peak as the equity markets have done so triumphantly?

After all, in the past decade, world population has increased by some 1 billion people (more than three times the US population) and world GDP by almost $25 trillion (or the size of all 28 EU economies plus Japan together). Given presumably peaceful conditions, it is only fair to expect international trade would expand accordingly.

What is clear is that the current gap between US market highs and international economic realities is precipitating a global recession by 2020, given the current trends. And that is the benign – not the malignant – scenario. US market prices remain twice as high as their historical averages (in light of the cyclically-adjusted price-earnings ratio).

Worse, as US markets thrive whereas international fundamentals – including trade – stagnate, the gap between the two is paving way to a drastic market correction in the future that could prove far more disruptive and longer-lasting than the 2008 crisis.

[The commentary is based on Dr Steinbock’s recent presentation: “The Anomaly of US Markets and International Trade”]

About the Author:

Dr. Dan Steinbock is an internationally recognized strategist of the multipolar world and the founder of Difference Group. He has served at India, China and America Institute (US), Shanghai Institutes for International Studies (China) and the EU Center (Singapore). For more, see https://www.differencegroup.net/  


PART III – Debt Crisis To Be Reborn In 2020

By TheTechnicalTraders.com

This final portion of our multiple part research post regarding the future of a crisis-like price revaluation event will focus on two components that we want to highlight for every trader, investor, and reader.  It does not matter if you are invested in anything at this point – you need to read this last portion of our research because you need to plan for and prepare for this next event.

On March 31, 2019, we published this research post regarding our cycle analysis predictions and the belief that a major price cycle top would likely form in July 2019.

On June 11, 2019, we updated our research and published this post regarding our belief that current cycle forecasting suggested the top in the market would now be set up for some time in late August or early September 2019.

This SPY chart highlights what our research team believes to be the current outcome of the US stock market given our predictive modeling systems, price rotation modeling and other proprietary utilities we use to conduct our research.  We believe the current upside price rally is a push to establish price levels above $300 on this SPY chart, just as we suggested in the June 11 article, and that this attempt a major psychological price level ($300) will likely become an exhaustion rally point where price immediately rotates lower – attempting to find support.  We believe temporary price support will be found near $287 to $298 where the price will briefly stall and move slightly higher into August 2019.

It is at this point that our cycle research becomes critical for technical traders.  This price rotation will set up a final leg to a larger Pennant/Flag formation with the potential for that last upside price leg, in August, to become a “washout high” price move.  This happens when price fakes a price move/trend, causing investors to believe a breakout or breakdown more is taking place and JUMP IN, then price immediately reverses direction.

It is extremely important for all technical traders to understand our original price predictions, from March 31, 2019, and our current price predictions, from June 11, 2019, align with this current article in certain aspects.  Price is going to target the psychological $300 level in the SPY.  Price is going to continue forming into a Pennant/Flag formation.  And the price will likely peak in late August or early September – just as we have predicted.

We expect this price rotation, or price revaluation event, to attempt to find support as we have highlighted on this chart.  If these levels fail to hold as price support, then we could be in for a much deeper price revaluation event.  We don’t believe that will be the case as the US elections and other factors should prevent the price from falling too far below the $245 level.

Expect some increased price volatility over the next 30+ days.  Expect Gold and Silver to properly reflect the FEAR and GREED that is prevalent within the global markets.  Expect many traders will be caught off guard when this $300 level on the SPY is breached as many will be thinking “we are off to the races – time to pile into the LONG SIDE”.  We believe this is the wrong action to take.

We’ll keep you informed as this plays out with Wealth Building & Global Financial Reset Newsletter and if you like what I offer, join me with the 1 or 2-year subscription to lock in the lowest rate possible and ride my coattails as I navigate these financial market and build wealth while others lose nearly everything they own during the next financial crisis. Join Now and Get a Free 1oz Silver Round or Gold Bar!

I can tell you that huge moves are about to start unfolding not only in metals, or stocks but globally and some of these super cycles are going to last years. A gentleman by the name of Brad Matheny goes into great detail with his simple to understand charts and guide about this. His financial market research is one of a kind and a real eye-opener. PDF guide: 2020 Cycles – The Greatest Opportunity Of Your Lifetime

As a technical analysis and trader since 1997, I have been through a few bull/bear market cycles. I believe I have a good pulse on the market and timing key turning points for both short-term swing trading and long-term investment capital. The opportunities are massive/life-changing if handled properly.

Chris Vermeulen – TheTechnicalTraders.com


Oil Started Consolidating

By Dmitriy Gurkovskiy, Chief Analyst at RoboForex

At the beginning of the week, Oil prices are stable as Brent is trading at 64.42 USD.

Right now, there are no obvious speculative drivers that may push the commodity market in some particular direction. According to the weekly report on the Crude Oil Inventories and the Natural Gas Storage, both indicators are going down, which is quite okay for this time of the year. The Middle-East factor is rather calm, so there is no support to aggressive buyers. Moreover, the USD is looking pretty stable, but this week may change a lot.

The Baker Hughes Oil Rig Count report published last week turned out to be in favor of bulls. The report showed -4 units in comparison with the previous week and 963 units total. On YoY, the decline has already reached 89 units, which is quite serious.

To be more detailed, the current number of oil rigs is 788 units, while the highest number in 2018 was 888 units.

In the H4 chart, Brent is trading upwards. Possibly, the pair may grow with the first target at 67.50. Later, the market may start a new correction to reach 63.75 and then resume trading inside the uptrend with the short-term target at 70.00. From the technical point of view, this scenario is confirmed by Stochastic Oscillator, as its signal has reversed away from the “oversold area” and is currently moving upwards.

As we can see in the H1 chart, Brent is trading to break 64.90. After that, the instrument may continue trading inside the uptrend with the short-term target at 65.50 and then start a new correction towards 65.00. Later, the market may form one more ascending structure with the first target at 67.50. From the technical point of view, this scenario is confirmed by MACD Oscillator, as its signal line has broken 0 to the upside. As a result, the price may boost its growth towards 66.50.

Disclaimer

Any predictions contained herein are based on the authors’ particular opinion. This analysis shall not be treated as trading advice. RoboForex shall not be held liable for the results of the trades arising from relying upon trading recommendations and reviews contained herein.

PART II – Is The Debt Crisis About To Be Reborn In 2020?

By TheTechnicalTraders.com

There are some key elements of political and economic Super-Cycles that all traders must stay aware of listed below. But if you have not yet read PART I do so now.

_  Very often, 12+ months before a major US political election cycle, the US stock market typically enters a Bearish trend phase that lasts until 8+ month before the actual election date.

_   The Transportation Index has not recovered to levels from the September 2018 peak.  This lower price rotation in the Transportation Index suggests the global economy is not expecting growth in the near future.

_   Other than Precious Metals, the Commodities sector has rebounded off of recent lows but has yet to see any real price advancement – suggesting that demand for raw commodities is rather weak.

_   The Real Estate sector in the US is starting to falter near a current high price level.  We are seeing price decreases hit the markets as sellers are desperate to attract buyers.  This could be a warning that a price revaluation event is about to unfold in the US.

_   Super-Cycles suggest a moderately sized price rotation between now and early 2020 (likely greater than 20% in size).  This rotation, should it happen, will become a price revaluation event that could attempt to “shake loose” some of the sector pricing and forward expectations we’ve mentioned (above).

Our bigger concern is the localized state and federal pension and retirement issues that continue to respond with higher levels of financial commitments and greater levels of annual budgets as related to ongoing capacity and operational activities in the US.

If an unwinding event was to unfold in or near 2020, it is our belief that a pricing revaluation event related to any of the core economic factors above (particularly with Real Estate, Economic Cycles, the US Presidential Elections, and a soft/weakening US economy) could result in a much larger price revaluation event taking place.  This would create extended pressures on local State and Federal expenses and highlight debt issues that can often be hidden behind “creative accounting” tricks.

State and Local Government Debt Securities and Loan Liability levels have stayed elevated, yet somewhat flat over the past 10+ years.  It is very likely that these debt levels have been contained because of the US easy money policies of the past 10+ years.  When the US Dollar is cheap and easy to repay, these debt levels don’t look so difficult.

Pension and retirement systems/fund are a completely different story for State and Local government agencies.  Asset flows have dramatically increased in volatility after 2000.  Additionally, the depth and magnitude of asset outflows have become quite dangerous while price revaluation events were unfolding (2000 to 2004 and 2008 to 2015).  Outflows in state and federal pension and retirement funds create large forward operational pressures and shortfalls in expected funding levels.  These decreases in funding should be made whole by the State or City – but they are rarely ever repaid in full.

As these “wholes” in the pension and retirement systems continue to fester (resulting in decreased funds for pensioners and decrease fund to be deployed as investment assets), the problems begin to compound over time.  More and more retirees and pensioners start drawing benefits while the system continues to take in less and less – never actually catching up in total value.

One big revaluation event, or possibly two, from now and we believe the entire system will create a multiple Trillion Dollar debt crisis within the US and possibly throughout the modern world.  We believe the under-estimated state and federal pension/retirement funding issue is the next shoe to drop and that it will take a price revaluation event to expose the risks that are evident within this failed “Ponzi” scheme.  Read the recent news about Chicago and Illinois to learn just how dangerous these entitlement contraptions really are.

Let’s assume that a revaluation event does take place within the next 5 to 10+ years – this would be something like a Real Estate price correction or some type of stock market, asset market price correction related to local or global economic issues.  Could these massive asset funds handle an extended DRAWDOWN from their funds while Cities, States, and Federal agencies attempt to deal with declining revenues?  How much time would it take for these pension and retirement funds to fall into crisis or insolvency?

By our estimates, the current asset levels in the US retirement/pension system have just started to breach the lower asset level channel originating from 1970 to 1999 attribution levels.  It has taken 20+ years of  US Fed and global Central Bank market manipulation, as well as President Trump’s incredible US economic and stock market rally, to recover to these levels.

Overall, skilled technical traders must be aware of the risks that are ever-present for another crisis event or what we are calling a “price revaluation event” that could create havoc on anyone’s retirement accounts, trading portfolios and/or simple family life/future.  We’re trying to help to highlight what we believe will be the future 16 to 24 months of pricing activity within the US Stock market based on our research tools and our experience/knowledge.

I urge you visit my Wealth Building Newsletter and if you like what I offer, join me with the 1 or 2-year subscription to lock in the lowest rate possible and ride my coattails as I navigate these financial market and build wealth while others lose nearly everything they own during the next financial crisis. Join Now and Get a Free 1oz Silver Round or Gold Bar!

I can tell you that huge moves are about to start unfolding not only in metals, or stocks but globally and some of these super cycles are going to last years. A gentleman by the name of Brad Matheny goes into great detail with his simple to understand charts and guide about this. His financial market research is one of a kind and a real eye-opener. PDF guide: 2020 Cycles – The Greatest Opportunity Of Your Lifetime

As a technical analysis and trader since 1997, I have been through a few bull/bear market cycles. I believe I have a good pulse on the market and timing key turning points for both short-term swing trading and long-term investment capital. The opportunities are massive/life-changing if handled properly.

Chris Vermeulen – TheTechnicalTraders.com


Forex Technical Analysis & Forecast 08.07.2019 (EURUSD, GBPUSD, USDCHF, USDJPY, AUDUSD, USDRUB, GOLD, BRENT)

Article By RoboForex.com

EURUSD, “Euro vs US Dollar”

EURUSD has reached the predicted downside target; right now, it is consolidating around 1.1222. If later the price breaks the range to the upside, the instrument may start a new correction towards 1.1295; if to the downside – resume trading inside the downtrend with the target at 1.1200.

EURUSD_Технический анализ
Risk Warning: the result of previous trading operations do not guarantee the same results in the future

GBPUSD, “Great Britain Pound vs US Dollar”

GBPUSD has reached the short-term downside target; right now, it is trading upwards with the target at 1.2546. Later, the market may start another decline towards 1.2515 and then form one more ascending structure to reach 1.2584.

GBPUSD_Технический анализ
Risk Warning: the result of previous trading operations do not guarantee the same results in the future

USDCHF, “US Dollar vs Swiss Franc”

After breaking the consolidation range to the upside, USDCHF has almost completed the first expansion at 0.9930. Possibly, today the pair may test 0.9890 from above. If later the price breaks 0.9930 to the upside, the instrument may resume trading inside the uptrend towards 0.9960; if 0.9888 to the downside – continue the correction with the target at 0.9845.

USDCHF_Технический анализ
Risk Warning: the result of previous trading operations do not guarantee the same results in the future

USDJPY, “US Dollar vs Japanese Yen”

USDJPY is trading downwards with the short-term target at 108.18. After that, the instrument may start a new growth towards 108.38 and then continue trading downwards to reach 108.14.

USDJPY_Технический анализ
Risk Warning: the result of previous trading operations do not guarantee the same results in the future

AUDUSD, “Australian Dollar vs US Dollar”

AUDUSD is trading upwards with the target at 0.6990. After that, the instrument may form a new descending structure towards 0.6975 and then form one more ascending structure to reach 0.7020.

AUDUSD_Технический анализ
Risk Warning: the result of previous trading operations do not guarantee the same results in the future

USDRUB, “US Dollar vs Russian Ruble”

USDRUB is trading upwards with the short-term target at 64.06. After that, the instrument may start another decline towards 63.40 and then continue trading upwards with the first target at 64.40.

USDRUB_Технический анализ
Risk Warning: the result of previous trading operations do not guarantee the same results in the future

XAUUSD, “Gold vs US Dollar”

Gold has finished the first descending impulse; right now, it is being corrected towards 1404.30. Later, the market may form a new descending structure to break 1383.00 and then continue trading downwards with the target at 1330.00.

GOLD_Технический анализ
Risk Warning: the result of previous trading operations do not guarantee the same results in the future

BRENT

Brent has completed the ascending structure at 64.86. Today, the pair may be corrected towards 63.65, thus forming a new consolidation range. If later the price breaks this range to the upside, the instrument may resume trading inside the uptrend towards 67.70; if to the downside – continue the correction to reach with the target at 62.00.

BRENT_Технический анализ

Article By RoboForex.com

Attention!
Forecasts presented in this section only reflect the author’s private opinion and should not be considered as guidance for trading. RoboForex LP bears no responsibility for trading results based on trading recommendations described in these analytical reviews.

Fibonacci Retracements Analysis 08.07.2019 (GOLD, USDCHF)

Article By RoboForex.com

XAUUSD, “Gold vs US Dollar”

In the H4 chart, XAUUSD tried to form a new rising impulse to update the high, but faced the strong resistance from bears, which made the pair return to the local low. As a result, the price may yet continue the correction towards 38.2% and 50.0% fibo at 1374.30 and 1354.34 respectively. The resistance is the high at 1438.97. If the pair breaks it, the instrument may continue growing towards long-term 618% fibo at 1510.00.

GOLD_H4_fibo-08072019
Risk Warning: the result of previous trading operations do not guarantee the same results in the future

As we can see in the H1 chart, the pair is trading between the high and the target Fibonacci retracement, 38.2% at 1374.30.

GOLD_H1_Анализ по Фибоначчи
Risk Warning: the result of previous trading operations do not guarantee the same results in the future

USDCHF, “US Dollar vs Swiss Franc”

As we can see in the H4 chart, after reaching 50.0% fibo, USDCHF is forming a new correctional uptrend, which is heading towards the resistance at 23.6% fibo at 0.9989. After completing the pullback, the price may fall towards 61.8% fibo at 0.9588.

USDCHF_H4_Анализ по Фибоначчи
Risk Warning: the result of previous trading operations do not guarantee the same results in the future

In the H1 chart, the uptrend continues. At the same time, there is a divergence on MACD, which may indicate a possible reverse soon. If the pair breaks the local support at 38.2% fibo at 0.9835, the instrument may start a new wave to the downside.

USDCHF_H1_Анализ по Фибоначчи

Article By RoboForex.com

Attention!
Forecasts presented in this section only reflect the author’s private opinion and should not be considered as guidance for trading. RoboForex LP bears no responsibility for trading results based on trading recommendations described in these analytical reviews.

The Analytical Overview of the Main Currency Pairs on 2019.07.08

by JustForex

The EUR/USD currency pair

Technical indicators of the currency pair:
  • Prev Open: 1.12833
  • Open: 1.12221
  • % chg. over the last day: -0.52
  • Day’s range: 1.12197 – 1.12328
  • 52 wk range: 1.1111 – 1.2009

On Friday, the US published a fairly optimistic report on the labor market in June, which caused an increase in demand for USD. The dollar index (#DX) set new monthly highs. In the non-agricultural sector of the country, 224,000 new jobs were created, which is significantly higher than the forecasted value of 160,000. The growth of the average hourly wage did not meet market expectations and amounted to 0.2%. At the same time, the previous figure was revised upwards to 0.3%. The unemployment rate rose from 3.6% to 3.7%. At the moment, EUR/USD quotes are consolidating in the range of 1.12100-1.12400. Trading instrument has the potential to further decline. We recommend to open positions from key levels.

The Economic News Feed for 08.07.2019 is calm.

EUR/USD

The price has fixed below 50 MA and 100 MA, which indicates the power of the sellers.

The MACD histogram is in the negative zone, but above the signal line, which gives a weak signal to sell EUR/USD.

The Stochastic Oscillator is located near the overbought zone, the %K line crossed the %D line. There are no signals at the moment.

Trading recommendations
  • Support levels: 1.12100, 1.11600
  • Resistance levels: 1.12400, 1.12750, 1.13100

If the price consolidates below the local support of 1.12100, the quotes will drop to 1.11700-1.11500.

Alternatively, quotes could recover to 1.12700-1.13000.

The GBP/USD currency pair

Technical indicators of the currency pair:
  • Prev Open: 1.25763
  • Open: 1.25248
  • % chg. over the last day: -0.43
  • Day’s range: 1.25207 – 1.25334
  • 52 wk range: 1.2438 – 1.3631

Currency pair GBP / USD once again moved to a decline. The demand for USD has grown after the release of positive reports from the labor market. Tje rading tool updated key extremums and is consolidating in a rather narrow range of 1.25150-1.25350. In the near future, we deem a technical correction possible. Keep an eye on Brexit and open positions must be opened from key levels.

The Economic News Feed for 08.07.2019 is calm.

GBP/USD

The price has fixed below 50 MA and 100 MA, which indicates the power of the sellers.

The MACD histogram is in the negative zone, but above the signal line, which gives a weak signal to sell GBP/USD.

The Stochastic Oscillator is in the neutral zone, the %K line is above the %D line, which indicates a bullish mood.

Trading recommendations
  • Support levels: 1.25150, 1.24850
  • Resistance levels: 1.25350, 1.25600, 1.26000

If the price consolidates below 1.25150, the quotes will move to 1.24850-1.24600.

Alternatively, the quotes may rise toward 1.25600-1.25800.

The USD/CAD currency pair

Technical indicators of the currency pair:
  • Prev Open: 1.30492
  • Open: 1.30660
  • % chg. over the last day: +0.19
  • Day’s range: 1.30660 – 1.30834
  • 52 wk range: 1.2727 – 1.3664

On Friday USD/CAD had rather high trading activity. CAD was under pressure after a weak report on the labor market in Canada. At the moment, USD/CAD quotes are consolidating. Local levels of support and resistance are 1.30600 and 1.30850. Trading instrument can grow further. Pay attention to the dynamics of oil prices and open positions from key levels.

The Economic News Feed for 08.07.2019 is calm.

USD/CAD

Indicators do not give accurate signals: the price crossed 50 MA and 100 MA.

The MACD histogram is located near the 0 mark.

The Stochastic Oscillator is in the neutral zone, the% K line crossed the% D line. There are no signals at the moment.

Trading recommendations
  • Support levels: 1.30600, 1.30400, 1.30000
  • Resistance levels: 1.30850, 1.31150, 1.31450

If the price consolidates above 1.30850, the quotes will grow to 1.31150-1.31400.

Alternatively, the quotes can descend to 1.30400-1.30200.

The USD/JPY currency pair

Technical indicators of the currency pair:
  • Prev Open: 107.811
  • Open: 108.435
  • % chg. over the last day: +0.61
  • Day’s range: 108.280 – 108.585
  • 52 wk range: 104.97 – 114.56

The USD/JPY currency pair has stabilized after a sharp rise during Friday’s trading. At the moment, the trading instrument is consolidating. The key support and resistance levels are 108.250 and 108.600, respectively. USD/JPY quotes can grow further. Pay attention to the dynamics of the yield of US Treasury Bonds. Positions must be opened from key levels.

The Economic News Feed for 08.07.2019 is calm.

USD/JPY

The price has fixed above 50 MA and 100 MA, which indicates the strength of buyers.

The MACD histogram is in the positive zone, but below the signal line, which gives a weak signal to buy USD/JPY.

The Stochastic Oscillator is in the oversold zone, the %K line crossed the %D line. There are no signals at the moment.

Trading recommendations
  • Support levels: 108.250, 108.000, 107.700
  • Resistance levels: 108.600, 109.000

If the price consolidates above the resistance level of 108.600, the quotes can grow to 109.000 round level.

Alternatively the quotes can fall to 108.000-107.800.

by JustForex

The US Currency Is in the Green

by JustForex

On Friday, the US dollar updated monthly highs against the publication of optimistic statistics on the labor market for June. Thus, the number of people employed in the nonfarm sector increased by 224K in June, while experts forecasted growth by 160K. The average hourly earnings growth did not meet market expectations and counted to 0.2%. At the same time, the previous figure was revised upwards to 0.3%. The unemployment rate rose from 3.6% to 3.7%. Traders suggest that the Fed will not sharply reduce the interest rate after such fairly positive data. On Friday, the US dollar index (#DX) closed in the positive zone (+0.58%).

On Friday, weak economic releases from Canada were also published. Thus, the employment rate fell by 2.2K in June, while investors expected an increase by 10.0K. Ivey PMI counted to 52.4 in June instead of the expected 55.0.

Boris Johnson, a front-runner to replace British Prime Minister, said that the country would most likely exit from the EU without a deal by October 31. “We were pretty much ready on March 29. And we will be ready by October 31,” he told the Sunday Telegraph. The official believes that the UK partners should understand that the country is ready for no-deal Brexit and should be worried about this. We recommend following the current information on the Brexit issue.

The “black gold” prices show positive dynamics. At the moment, futures for the WTI crude oil are testing the mark of $57.70 per barrel.

Market Indicators

On Friday, there was the bearish sentiment in the US stock markets: #SPY (-0.11%), #DIA (-0.11%), #QQQ (-0.20%).

The 10-year US government bonds yield has been recovering. Currently, the indicator is at the level of 2.02-2.03%.

The News Feed on 2019.07.08:

Today the publication of important economic news is not expected.

by JustForex

Bearish divergence in the DAX30 CFD – test of 12,450 ahead?

By Admiral Markets

July 08, 2019 11:00

Source: Economic Events July 8, 2019 – Admiral Markets’ Forex Calendar

Since the economic calendar is very thin for the start of the week, we want to focus on the technical side and have a look at the DAX30 CFD.

After Friday’s NFPs came in at 224k and significantly above expectation, the German index nevertheless kept on sharpening a bearish divergence on H1 in the RSI.

In general, such a divergence is only an indication that the latest bullish momentum is about to diminish and Long engagements should be carefully considered from a risk-reward perspective.

Still, we see short-term bearish potential at least as low as 12,440/450 points, going hand in hand with the close of the gap which occurred after the announced truce between the US and China in their trade war at the G20 summit at the June 29.

If we get to see such a bearish push, traders should carefully watch the price action against 12,440/450: usually this region should act as a potential long-trigger, but if bulls fail to regain momentum and the DAX30 CFD keeps on dropping and falls below 12,400 points, the bearish divergence could be considered confirmed and further losses are a serious option.

On the other hand: if no bearish momentum is taken on and the DAX30 CFD takes out 12,650 points, further gains up to 12,850/900 are very likely:

Source: Admiral Markets MT5 with MT5-SE Add-on DAX30 CFD Hourly chart (between June 17, 2019, to July 5, 2019). Accessed: July 5, 2019, at 10:00pm GMT – Please note: Past performance is not a reliable indicator of future results, or future performance.

In 2014, the value of the DAX30 CFD increased by 2.65%, in 2015, it increased by 9.56%, in 2016 it increased by 6.87%, in 2017 it increased by 12.51%, in 2018 it fell by 18.26%, meaning that after five years, it was up by 10.5%.

Source: Admiral Markets MT5 with MT5-SE Add-on DAX30 CFD daily chart (between 23 March 2018 to 05 July 2019). Accessed: 05 July 2019 at 10:00 PM GMT

Investing in Forex with Admiral Markets

Admiral Markets offers professional traders the ability to trade with a custom, upgraded version of MetaTrader 5, allowing you to experience trading at a significantly higher, more rewarding level. Experience benefits such as the addition of the Market Heat Map, so you can compare various currency pairs to see which ones might be lucrative investments, access real-time trading data, and so much more. Click the banner below to start your FREE download of MT5 Supreme Edition!

Download MetaTrader 5 and begin trading today!

Disclaimer: The given data provides additional information regarding all analysis, estimates, prognosis, forecasts or other similar assessments or information (hereinafter “Analysis”) published on the website of Admiral Markets. Before making any investment decisions please pay close attention to the following:

  1. This is a marketing communication. The analysis is published for informative purposes only and are in no way to be construed as investment advice or recommendation. It has not been prepared in accordance with legal requirements designed to promote the independence of investment research, and that it is not subject to any prohibition on dealing ahead of the dissemination of investment research.
  2. Any investment decision is made by each client alone whereas Admiral Markets shall not be responsible for any loss or damage arising from any such decision, whether or not based on the Analysis.
  3. Each of the Analysis is prepared by an independent analyst (Jens Klatt, Professional Trader and Analyst, hereinafter “Author”) based on the Author’s personal estimations.
  4. To ensure that the interests of the clients would be protected and objectivity of the Analysis would not be damaged Admiral Markets has established relevant internal procedures for prevention and management of conflicts of interest.
  5. Whilst every reasonable effort is taken to ensure that all sources of the Analysis are reliable and that all information is presented, as much as possible, in an understandable, timely, precise and complete manner, Admiral Markets does not guarantee the accuracy or completeness of any information contained within the Analysis. The presented figures refer that refer to any past performance is not a reliable indicator of future results.
  6. The contents of the Analysis should not be construed as an express or implied promise, guarantee or implication by Admiral Markets that the client shall profit from the strategies therein or that losses in connection therewith may or shall be limited.
  7. Any kind of previous or modeled performance of financial instruments indicated within the Publication should not be construed as an express or implied promise, guarantee or implication by Admiral Markets for any future performance. The value of the financial instrument may both increase and decrease and the preservation of the asset value is not guaranteed.
  8. The projections included in the Analysis may be subject to additional fees, taxes or other charges, depending on the subject of the Publication. The price list applicable to the services provided by Admiral Markets is publicly available from the website of Admiral Markets.

Leveraged products (including contracts for difference) are speculative in nature and may result in losses or profit. Before you start trading, you should make sure that you understand all the risks.

By Admiral Markets