On Thursday the 18th of July, trading on the euro closed significantly up to completely recover the losses incurred earlier in the week. The 1.1280 mark was reached once again, revisiting the high set on Monday. In the Asian session, the pair reached 1.1241, while the euro tumbled to 1.1205 during trading in Europe. This was brought about by very strong retail sales data from the UK. Growth across the retail sector increased by a factor of 1.5 – 3, both in monthly and annual terms.
The euro’s decline was also helped along by the Bank of England’s credit conditions survey. It’s worth remembering, however, that the tensions in the UK surrounding the change in government and Brexit still reign supreme. In the US session, the single currency began its recovery. Jobs data and the Philadelphia Fed manufacturing survey weakened the dollar, allowing the euro to rise, while FOMC members Rafael Bostic and John Williams added to the downside pressure on the greenback later on.
Day’s news (GMT+3):
11:30 UK: public sector net borrowing (Jun).
15:30 Canada: retail sales (May).
18:05 US: Fed’s Bullard speech.
23:30 US: Fed’s Rosengren speech.
Current situation:
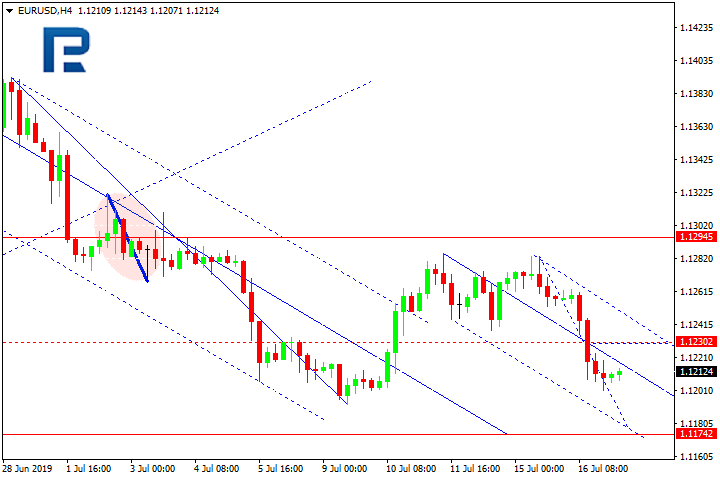
Yesterday’s range, in which the EURUSD pair continues to trade today, will most likely remain intact. The current situation is uncertain, however. We can’t rule out breakouts of both the upper (1.1287) and lower (1.1194) boundaries of this range. A breakout to either side will set the tone for the near future.
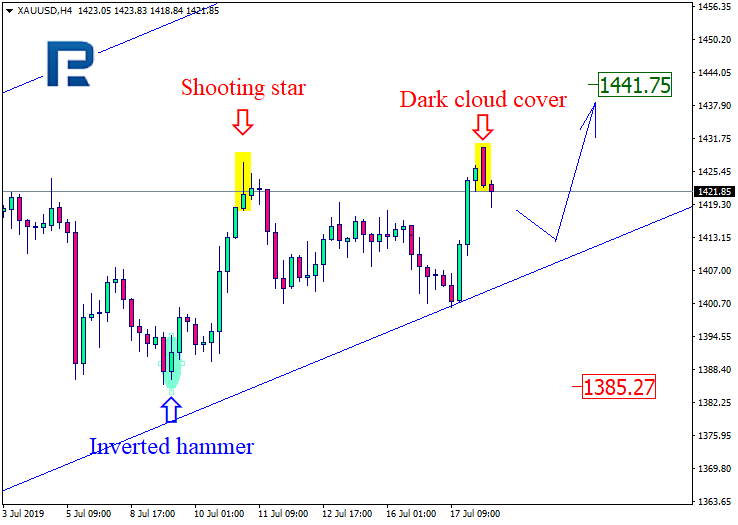
Gold keeps forming an ascending trend. On H4 the instrument has formed a Dark Cloud Cover at the horizontal resistance level. Currently, we are contemplating the signal for a reverse pattern start realizing. In case of further decline the price may reach 1385.27. At the same time a reverse scenario is not impossible: a breakthrough of the resistance line and a renewal of the maximum of 1441.75 may follow.
NZDUSD
On H4 the pair formed a Harami upon testing the horizontal resistance level at 0.6730. In the present situation a realization of the signal for a reverse pattern is not highly possible; further growth and testing of the next resistance level at 0.6800 are more likely. What is more, a vice versa scenario is not to be excluded: a bounce off the resistance line and a drop to 0.6662 may follow.
Attention! Forecasts presented in this section only reflect the author’s private opinion and should not be considered as guidance for trading. RoboForex LP bears no responsibility for trading results based on trading recommendations described in these analytical reviews.
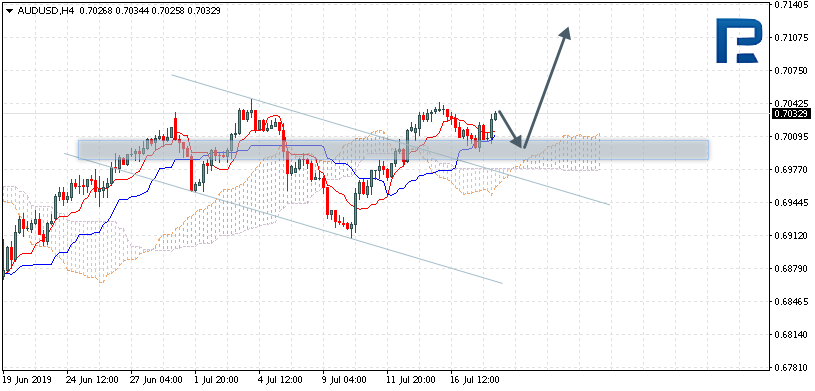
The instrument is trading at 0.7032 above the Cloud, which suggests an ascending trend. Testing of the signal lines of the indicator near 0.7005 is expected, followed by growth to 0.7110. Yet another signal of growth may be a bounce off the support line. The scenario may no longer be valid in case the lower border of the Cloud is broken and trading closes under 0.6950, which may be followed by a further decline below 0.6875.
NZDUSD
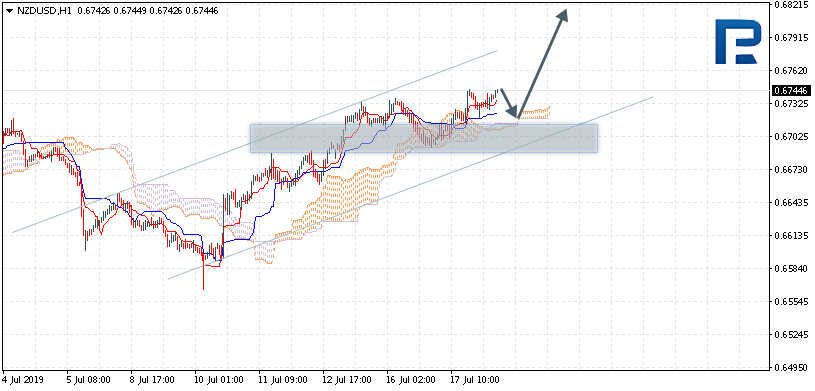
The instrument is trading at 0.6744 above the Ichimoku Cloud which suggests an ascending trend. A test of the upper border of the Cloud near 0.6725 is expected, followed by growth to 0.6820. Yet another signal of growth may be a bounce off the support line. The scenario may no longer be valid in case the lower border of the Cloud is broken and trading closes under 0.6700, which may be followed by further decline to 0.6625.
USDCAD
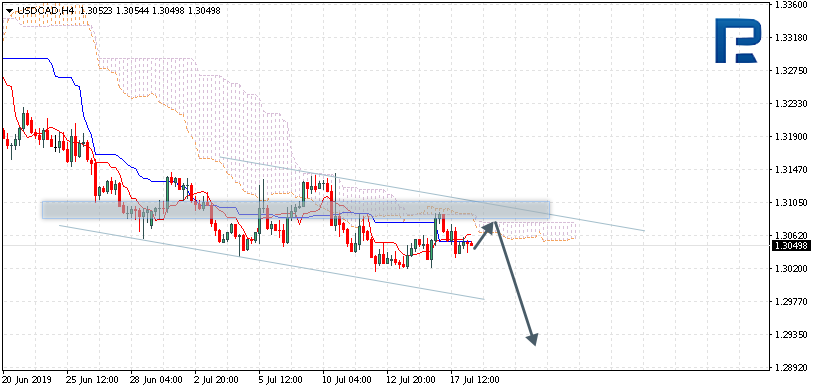
The instrument is trading at 1.3049 below the Ichimoku Cloud which suggests a descending trend. Testing of the upper border of the Cloud near 1.3065 is expected, followed by a decline to 1.2925. Yet another signal of decline may be a bounce off the upper border of the descending channel. The scenario may no longer be valid in case the upper border of the Cloud is broken and trading closes above 1.3125, which may be followed by further growth to 1.3205.
Attention! Forecasts presented in this section only reflect the author’s private opinion and should not be considered as guidance for trading. RoboForex LP bears no responsibility for trading results based on trading recommendations described in these analytical reviews.
Our researchers identified this critical Double-Top pattern in the Transportation Index after a very strong price rally on Friday, July 12. Double-Top patterns are very important in terms of Fibonacci price structure because they reflect a complete price rejection at a certain price level. In this case, the TRAN Double Top level is $10,655 and our research team believes weakness at this level will push a downward price swing which should attempt to break through the $10,250 level and possibly attempt to move much lower.
The Transportation Index reflects future expectations for shipping of goods and raw materials across the US and, of course, is somewhat related to global economic activity. If the Transportation Index falls in price, then future expectations are for weaker economic activity. If it rises, then investors expect the economy to continue to strengthen.
This Double-Top formation in the TRAN could set up to become a very ominous warning sign for traders and investors.
Recent news about the contraction of China’s economy and the fact that Q2 earnings are about to hit the US markets and global markets could become a key factor in the future for volatility and price. We believe the markets are already setting up a topping pattern after breaching key psychological levels last week.
MINERS ARE OUTPERFORMING US EQUITIES – TOP IS NEAR!
Last month I talked about how I have been waiting for gold miners to start outperforming the US stocks market. Once miners start outperforming in a big way (just like we saw in 2007), we know the stock market is topping out and something really bad is about to happen.
In the last couple of weeks, the gold miners index is up over 20% while the SP500 is up only 4%, this feels like the start-of-the-end if you know what I mean.
Gold miners and silver broke out today in a big way which could very well be the start of an epic rally for the precious metals sector as we heading into the end of the year.
Looks at the SP500 index in the chart below which is of the 2007 bull market top. Currently, the SP500 has formed a very similar pattern in 2019 and with the precious metals rocketing higher I think it almost lights out for the US equities.
TRANSPORTS, INDUSTRIALS, and SMALL-CAP STOCKS Confirm Market Is Topping
Based on the 2008 weekly chart below the US stock market could be literally 2-6 weeks away from collapsing. What makes this even scarier is that the market liquidity is the worst its been in my 23 years of trading. This means when the selling starts we will likely see some sort of flash crash as we saw in 2008, 2015, and 2018. Price drops so quickly that by the time you figure out what you want to do and get your money properly positioned most of the move is already finished. See 2008 and 2019 Comparison Charts here.
CONCLUDING THOUGHTS:
Pay attention to our research because we feel the market could breakdown on weakness later this week or early next week. Our predictive modeling systems are suggesting an August 19th, 2019 breakdown date and we are only about 25 trading days away from that date.
In short, the bear market has been a long time coming, but finally, almost all the signs are showing that it’s about to start. As a technical analyst since 1997 having lost a fortune and making a fortune from bull and bear markets I have a good understanding of how to best attack the market during its various stages. Stay Tuned for My Cycle Analysis Article Next!
Be prepared for these incredible price swings before they happen and learn how you can identify and trade these fantastic trading opportunities in 2019, 2020, and beyond with our Wealth Building & Global Financial Reset Newsletter. You won’t want to miss this big move, folks. As you can see from our research, everything has been setting up for this move for many months – most traders/investors have simply not been looking for it.
Join me with a 1 or 2-year subscription to lock in the lowest rate possible and ride my coattails as I navigate these financial market and build wealth while others lose nearly everything they own during the next financial crisis. Join Now and Get a 1oz Silver Round or Gold Bar Shipped To You Free.
As a technical analysis and trader since 1997, I have been through a few bull/bear market cycles. I believe I have a good pulse on the market and timing key turning points for both short-term swing trading and long-term investment capital. The opportunities starting to present themselves will be life-changing if handled properly.
FREE GOLD or SILVER WITH MEMBERSHIP!
So kill two birds with one stone and subscribe for two years to get your FREE PRECIOUS METAL and get enough trades to profit through the next metalsbull market and financial crisis!
Yesterday, the greenback weakened against a basket of world currencies. The EUR/USD quotes updated local highs. Demand for the US currency weakened after the release of weak data on the real estate market, as well as a decrease in the yield of US government bonds. The IMF statements put additional pressure. The regulator said that the US dollar was overvalued by 6-12%, based on short-term economic indicators. At the moment, the EUR/USD quotes are consolidating in the range of 1.12250-1.12450. We recommend opening positions from these marks.
The news feed on 2019.07.18:
– The number of initial jobless claims in the US at 15:30 (GMT+3:00);
– Philadelphia Fed Manufacturing Index at 15:30 (GMT+3:00).
Indicators do not send accurate signals: the price has fixed between 50 MA and 100 MA.
The MACD histogram is in the positive zone and above the signal line, which gives a strong signal to buy EUR/USD.
Stochastic Oscillator is located near the overbought zone, the %K line has crossed the %D line. There are no signals at the moment.
Trading recommendations
Support levels: 1.12250, 1.12000, 1.11500
Resistance levels: 1.12450, 1.12750, 1.12850
If the price fixes below 1.12250, the EUR/USD currency pair is expected to decline. The movement is tending to 1.12000-1.11800.
An alternative could be a further recovery of the EUR/USD quotes to 1.12700-1.12850.
The GBP/USD currency pair
Technical indicators of the currency pair:
Prev Open: 1.24075
Open: 1.24313
% chg. over the last day: +0.20
Day’s range: 1.24243 – 1.24478
52 wk range: 1.2397 – 1.3385
The GBP/USD currency pair has begun to recover after a prolonged fall. The trading instrument has updated local extremes. This movement was largely caused by technical factors. At the moment, the GBP/USD quotes are testing a local resistance of 1.24500. The mark of 1.24200 is already a “mirror” support. The pound has the potential for further correction. We recommend keeping track of current information on Brexit. Positions must be opened from key levels.
At 11:30 (GMT+3:00), the UK retail sales statistics for June will be published.
Indicators do not send accurate signals: the price has fixed between 50 MA and 100 MA.
The MACD histogram has started to rise, which signals a further correction of the GBP/USD quotes.
Stochastic Oscillator is located near the overbought zone, the %K line has crossed the %D line. There are no signals at the moment.
Trading recommendations
Support levels: 1.24200, 1.23850
Resistance levels: 1.24500, 1.24800, 1.25100
If the price fixes above the local resistance of 1.24500, a further correction of the GBP/USD quotes is expected. The movement is tending to the round level of 1.25000.
An alternative would be reduction of the GBP/USD currency pair to 1.24000-1.23800.
The USD/CAD currency pair
Technical indicators of the currency pair:
Prev Open: 1.30830
Open: 1.30520
% chg. over the last day: -0.25
Day’s range: 1.30421 – 1.30556
52 wk range: 1.2727 – 1.3664
During the last trading sessions, the USD/CAD currency pair is quite active. At the same time, a unidirectional trend is not observed. At the moment, the loonie is consolidating. Investors expect additional drivers. Local levels of support and resistance are: 1.30350 and 1.30600, respectively. The trading instrument is tending to recover. We recommend paying attention to the dynamics of oil prices. Positions must be opened from key levels.
Today, the news feed on the Canadian economy is calm.
Indicators do not give accurate signals: the price has crossed 50 MA and 100 MA.
The MACD histogram is in the negative zone, but above the signal line, which gives a weak signal to sell USD/CAD.
Stochastic Oscillator is in the neutral zone, the %K line is above the %D line, which indicates the bullish sentiment.
Trading recommendations
Support levels: 1.30350, 1.30200, 1.30000
Resistance levels: 1.30600, 1.30750, 1.30900
If the price consolidates above 1.30600, a correction in the USD/CAD currency pair is expected. The movement is tending to 1.30800-1.31000.
An alternative could be a fall of the USD/CAD quotes to 1.30200-1.30000.
The USD/JPY currency pair
Technical indicators of the currency pair:
Prev Open: 108.226
Open: 107.942
% chg. over the last day: -0.28
Day’s range: 107.618 – 107.980
52 wk range: 104.97 – 114.56
On the USD/JPY currency pair the bearish sentiment is prevailing. During yesterday’s and today’s trading sessions, the drop in quotes has exceeded 50 points. The trading instrument has updated key lows. A negative dynamics of the yield of US government bonds puts additional pressure on the “greenback”. The demand for “safe” assets is still high due to the uncertainty in trade relations between the United States and China, as well as the situation around Brexit. At the moment, the USD/JPY quotes are consolidating in the range of 107.600-107.800. The trading instrument is tending to further decline. Positions must be opened from key levels.
In the Asian trading session, ambiguous data on the trade balance of Japan was published.
The price has fixed below 50 MA and 100 MA, which indicates the power of the sellers.
The MACD histogram is located in the negative zone and below the signal line, which gives a strong signal to sell USD/JPY.
Stochastic Oscillator is in the neutral zone, the %K line has crossed the %D line. There are no signals at the moment.
Trading recommendations
Support levels: 107.600, 107.300, 107.000
Resistance levels: 107.800, 108.100, 108.350
If the price fixes below 107.600, a further fall in the USD/JPY quotes is expected. The movement is tending to 107.300-107.000.
An alternative could be the growth of the USD/JPY currency pair to 108.000-108.200.
The US dollar is falling against a basket of major currencies amid weak economic reports, as well as a sharp drop in US government bond yields. Thus, the number of building permits issued in June fell to 1,220M instead of the forecasted value of 1,300M. The Fed’s Beige Book was also published yesterday, having stated that the growth rate of economic activity in the United States remained modest. The yield of 10-year US government bonds has updated weekly lows. The pressure on the US currency is also put by prolonged trade negotiations between the United States and China. The US dollar index (#DX) closed yesterday in the red zone (-0.19%).
The British pound has recovered some losses against the US dollar. This movement is caused largely by technical factors. Investors have begun to partially fix positions on the pound after a long fall. Optimistic data on retail sales in the UK in June supports the pound. Financial market participants expect new information on Brexit. Earlier, the EU coordinator at the Brexit talks, Michel Barnier, noted that Britain would face serious consequences if it decided to break ranks with the EU.
The single currency has updated local highs against the US dollar. Yesterday, the consumer price index in the eurozone was published, the figure of which was 1.3% in June instead of 1.2%.
Also in the Asian trading session weak data on the labor market in Australia were published. Thus, the level of employment rose in June by only 0.5K instead of the forecasted value of 9.1K.
The “black gold” prices show a negative trend. At the moment, the WTI crude oil inventories are testing $56.65 a barrel.
Market Indicators
Yesterday, the bearish sentiment was observed in the US stock markets: #SPY (-0.66%), #DIA (-0.42%), #QQQ (-0.49%).
The yield on 10-year US government bonds fell significantly. Currently, the indicator is at the level of 2.04-2.05%.
The news feed 2019.07.18:
– The number of initial jobless claims in the US at 15:30 (GMT+3:00); – Philadelphia Fed Manufacturing Index at 15:30 (GMT+3:00).
On Wednesday the 17th of July, trading on the euro closed up against the dollar, recovering about half of the losses incurred on Tuesday. The pair inched upwards during the Asian session, before dropping sharply to 1.1199 ahead of ECB member Benoît Cœuré’s speech. Reaction to the economist’s comment subsequently strengthened the euro against the dollar.
The UK’s inflation report showed consumer inflation unchanged at 2%, as had been predicted by experts. Core inflation in the Eurozone rose by 0.4%; 0.1% higher than the previous month. The euro continued to rise throughout the day, continuing into the US session. The pair closed day 0.1% up, which was undoubtedly facilitated in part by the Fed’s Beige Book.
In the short term, the EURUSD is likely to move within a range of 1.1194 to 1.1287. A breakout of 1.1194 will provide good reason to open short positions. We also shouldn’t rule out the possibility of revisiting the 1.1287 high.
Recently, the Duterte administration has been targeted by UN human rights chiefs, democracy promoters, data-trackers, even the Clooneys. But these influence networks share a common triple nexus.
Recently, the UN Human Rights Council accepted a resolution to initiate a “comprehensive” review of the Philippine drug war. The resolution passed narrowly (18 to 14, with 5 abstentions). Yet, it authorized the UN human rights chief Michelle Bachelet to examine evidence of “thousands of deaths at the hands of the police.”
Why has the tiny Iceland in the Atlantic been pushing a resolution in Southeast Asia? Well, that is a net effect of the triple nexus (see Figure).
Figure The Triple Nexus
The human rights nexus (read: Soros)
Actually, Iceland joined the Human Rights Council only in mid-2018, filling the seat vacated by the United States, which withdrew from the body. The key role belonged to Iceland’s permanent UN representative Bergdís Ellertsdóttir who is better known for security issues, NATO, EU security, bilateral US relations, international trade and security. She won’t stay in the Council; she will become Iceland’s US ambassador.
US is vital to Iceland, which joined NATO already in 1949, although amid great domestic opposition. Two years later, a defense agreement was signed with the US and US troops stayed in Iceland until 2006.
From Iceland, the mantle of the Philippine drugs review will move to Michelle Bachelet, a veteran Chilean politician. Her ratings plunged during her second Chilean presidency in the 2010s when she was linked with the land-purchase debacle by her son and daughter-in-law.
Like her predecessor, former UN Commissioner Zeid Raad Al Hussein, a vocal critique of the Duterte administration, Bachelet supports many causes funded by George Soros and has been applauded by the billionaire investor’s Open Society Foundations. But not all of these causes are as progressive. Despite Soros’s stated support of all kind of transparency initiatives, in 2016 Panama Papers revealed his deep money ties to secretive weapons and intel investment firm Carlyle Group, alongside members of Saudi Arabian Bin Laden family, according to Fox News.
The most recent Michelet debacle involves her Venezuela report. Despite appeals by an array of victims of right-wing violence, Michelet ignored them, along with the devastating impact of US sanctions and regime-change efforts since 2015. As a result, critics, including Jeffry Sachs and Mark Weisbrot argue that her report may result in thousands of new premature civilian deaths.
The democracy-promotion nexus (read: Albright)
Reportedly, Amal Clooney will lead a team of international lawyers representing Maria Ressa, Rappler’s CEO who faces numerous court cases and investigations. The Clooneys threw their support behind Ressa during her US visit in May.
Since the 2000s, both Clooneys have been active in Democratic causes. In 2010, George Clooney was nominated for life membership in the Council on Foreign Relations, US bipartisan think-tank promoting democracy.
After his “philanthropic missions” in Africa, he was linked in the early 2010s with Luis Moreno Ocampo, former chief prosecutor of the International Criminal Court (which enjoys Soros funding and has also targeted the Duterte administration). In a balanced analysis, European Investigative Collaborations have concluded that the ICC, Clooney, Omidyar may actually have “interfered in the pursuit of global justice.”
In turn, both Clooneys and Ocampo are linked with Madeleine Albright, former US Secretary of State who has often denounced Ressa’s arrests. Albright has a vital role in US democracy promotion. When the National Endowment for Democracy (NED) was insulated from the CIA in the early 1980s, it also led to the establishment of subsidiaries, such as the National Democratic Institute, which Albright chairs. NDI has participated in regime change efforts in Pinochet’s Chile and the Nicaraguan Revolution since the 1980s.
It’s also good business. Albright chairs her Albright Stonebridge Group (ASB), a “global business strategy” firm, and the affiliated Albright Capital Management, an “emerging markets investment firm.” Through NDI/NED, one can shape world events in poorer economies; through ASB/ACM, one can cash on the consequent changes.
The data-tracking nexus (read: Omidyar)
In addition to Clooneys and Soros, Ocampo has been linked with Pierre Omidyar, eBay’s founder and owner, and Rappler’s billionaire funder. The official version about Omidyar’s riches is that he created eBay for his then-fiancee as an online marketplace for her to improve a collection of Pez candy dispensers, as Time once reported (the magazine Albright has used to defend Ressa).
According to Yasha Levine’s Surveillance Valley (2018), the story is a bit different. eBay grew after it created an internal police and intelligence agency of former FBI agents in 1999 to spy on eBay users and track down fraud. They “worked closely with intelligence and law enforcement agencies in every country where it operated — including the United States, Canada, Brazil, Mexico, Malaysia, India, Russia, Czech Republic and Poland.” In the process, eBay handed over user data to the NSA and FBI, without requiring subpoenas or court orders.
It all paid off royally. Today eBay’s annual revenue is close to $11 billion and its total assets are estimated at more than $25 billion. Omidyar made his money through daily real-time information on media consumers, a slate of connections to national security, and a media empire that protects him from critical scrutiny, while profiling him as a “progressive philanthropist.”
The neoconservatives
As Omidyar’s media muscle has expanded internationally, so have the odd bedfellows. Thanks to his contributions, Omidyar forged close ties with President Obama whom he met often in the White House. Rappler is just one of many media gadgets in the Omidyar Network, whose chief of policy and advocacy is Ben Scott, an Obama official who also served in Hillary Clinton’s State Department.
While Omidyar sponsors the Interceptled by the prominent US civil rights advocate Glenn Greenwald, he is in control with the NSA whistleblower Snowden’s files. Yet, only a fraction of those files have been released, while, Robert Lietzke, Snowden’s former boss at Booz Allen Hamilton, has joined “Omidyar Fellows Program.”
Similarly, Omidyar’s funds the Center for Public Integrity, which promotes political transparency, yet puts his money into neoconservative leader William Kristol’s Defending Democracy Together and Alliance for Securing Democracy, a project of the German Marshall Fund which he also donates to, and The Bulwark. They are all reminiscent of the bygone neoconservative think-tank Project for New American Century (PNAC), created by Kristol and Robert Kagan, that paved the ideological way to multiple wars in the past two decades, with little transparency.
Why should a progressive do-gooder associate with such warmongers? In 2016, Kristol and Kagan led an open revolt against candidate Trump and for Hillary Clinton. The Biden-Pelosi offspring hope to keep neoconservatives in 2020 and 2024 as well.
Rappler’s “Creepy business model”
Only a few critical accounts have been published about the reclusive Omidyar. In part perhaps, such accounts are missing because he also funds the watchdogs. Last fall, Ressa was awarded by the Committee to Protect Journalists (CPJ), which was touted widely around the world. What was left unsaid is that Omidyar funds the CPJ, along with many other high-profile journalist consortia.
It’s a bit as if Oscars would be prioritized to movies whose producers fund the Oscars. That seems to keep some journalists from biting the hand that feeds them. After all, Omidyar also pushes “fact-checking” media groups (which tends to target particularly those causes that he opposes).
Many Filipinos seem to regard Rappler as a sort of “Voice of America,” yet it portrays itself as an independent outfit, despite murky financial flows and politics. Moreover, right after Ressa’s arrest and release, the Omidyar Network and the Omidyar-funded CPJ raised $500,000 for her legal defense fund (that will pay lawyers who will defend her, which will push Rappler, which will promote the Omidyar Network and so on). In return, Ressa has paid her dues. Last October, she complained at the NATO-backed Atlantic Council’s Stratcom conference in Washington about a campaign of legal intimidation and online trolling by Duterte supporters.
However, Rappler’s user-tracking model has also attracted concern because it couples journalism with behavior profiling, as Yasha Levine stresses. Prior to Omidyar’s investment ,Rappler boasted about another investor (North Base Media), which has been associated with Soros funding and destabilization. Last year, Rappler launched a civil engagement arm, MovePH, which is of great interest to Omidyar’s coordination with state and intel operations. Unlike Greenwald’s Intercept which has exposed the abuses of the US security state, say Omidyar critics Alexander Rubinstein and Max Blumenthal, “Rappler’s mission in the Philippines appears to have an ulterior and entirely opposite agenda. In announcing Omidyar’s investment in the digital media site, Rappler touted its one-of-a-kind and arguably extremely creepy business model.”
_ _ _ _ _ _
What is most tragic but telling about the triple nexus is that all these associated international rights organizations, watchdogs and foreign governments, which are now targeting Philippines, were so silent about rights abuses before 2016, when drugs and political corruption reigned and rule of law was diluted.
Human rights matter. Democracy matters. Media integrity matters. None of them should be undermined at the expense of economic profits, political power or geopolitical gains.
About the Author:
Dr. Dan Steinbock is an internationally recognized strategist of the multipolar world nd the founder of Difference Group. He has served at India, China and America Institute (US), Shanghai Institutes for International Studies (China) and the EU Center (Singapore). For more, see https://www.differencegroup.net/
The original commentary was released by The Manila Times on July 15, 2019
The pair is trading under pressure for decline. Today it might hit 1.1180, then make a correction to 1.1295.
GBPUSD
The instrument has reached the goal of the decline. Currently, a consolidation area may form on the minimums. In case the price goes up, it might make a correction to 1.2500. The goal is first.
USDCHF
The instrument is growing towards 0.9900. However, at the moment a decline to 0.9870 should not excluded, followed b growth towards 0.9900. After that a correction to 0.9860 may be expected.
USDJPY
The pair has broken through 108.12, hitting the local goal of growth. A decline to 108.12 and testing top down may be expected, followed by growth to 108.44.
AUDUSD
The instrument has completed the first declining impulse. Currently, there is a possibility of growth towards 0.7024, testing the level from below. A drop below 0.7000 may follow. The aim is local, estimated at 0.6990.
USDRUB
The instrument is trading in the consolidation area around 62.91. Today a decline below 62.22 seems possible. The goal is local.
GOLD
Gold keeps developing the consolidation area around 1408.20. If the price goes up, it may it 1430.00; on the other hand, a decline to 1393.00 should not be excluded, followed by growth to 1430.00.
BRENT
Oil is still correcting, trading to 64.00. At te moment it has hit the local goal at 64.20. Currently, technical growth towards 65.85 is not impossible, followed by a decline to 64.00 and subsequent gowth to 70.00.
Attention! Forecasts presented in this section only reflect the author’s private opinion and should not be considered as guidance for trading. RoboForex LP bears no responsibility for trading results based on trading recommendations described in these analytical reviews.
On the daily timeframe the descending of the instrument has reached a long-term minimum of 1.2395. Hence there is a convergence forming, a pullback to the resistance area of 61.8% (1.2770) may be expected. Further descending may be aiming at the post-correction amplification area of 138.2-161.8% (1.2019-1.1790) Fibo.
On H4 a short-term decline to the local post-correction amplification area of 138.2-161.8% (1.2386-1.2353) Fibo may be expected. However, judging by the convergence, a correction upwards to the local resistance at 1.2579 may follow.
EURJPY
The instrument remains in the correction corridor, testing the level around 61.8% Fibo in relation with the previous ascending trend. The goals of the subsequent decline are the same: 76.0% (120.25) and the long-term minimum of 117.96.
On H4 the instrument is developing a descending movement towards the local minimum of 120.78 after a correction upwards. Upon breaking through the minimum, the quotations may head for the new goal a 76.0% (120.25), and later to the post-correction amplification area of 138.2-161.8% (119.80-119.20) Fibo. The main resistance is at 123.36.
Attention! Forecasts presented in this section only reflect the author’s private opinion and should not be considered as guidance for trading. RoboForex LP bears no responsibility for trading results based on trading recommendations described in these analytical reviews.
 Current situation: