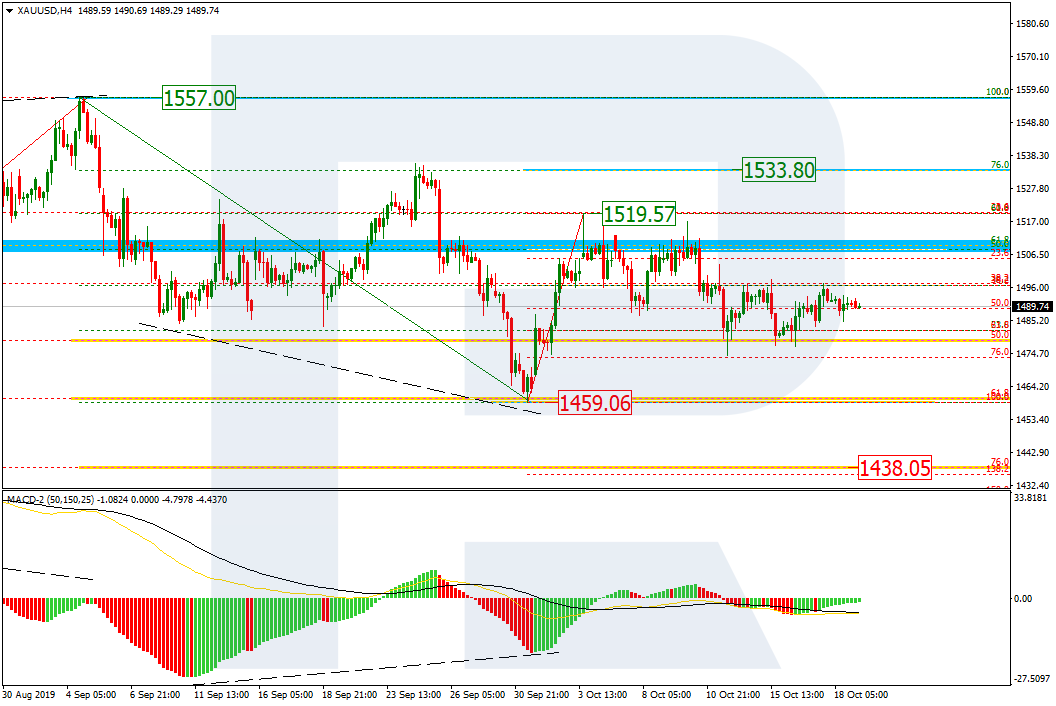
As we can see in the H4 chart, XAUUSD is correcting downwards after completing the ascending impulse. After rebounding from 76.0% fibo, the pair hasn’t been able to go any further, which means that bears probably “ran out of gas”. In this situation, both growth and decline are possible. In case of further decline, the price may break the low at 1459.09 and continue falling towards mid-term 76.0% fibo at 1428.05. otherwise, the instrument may break the resistance at 1519.57 and continue the correction to reach 76.0% fibo at 1533.08 and the key high at 1557.00.
In the H1 chart, the pair is moving sideways between 38.2% and 76.0% fibo and this consolidation may continue in the future. As a result, this technical picture implies further decline towards 76.0% fibo at 1473.60. Later, the market may even break this level and then continue falling to reach 1459.06.
USDCHF, “US Dollar vs Swiss Franc”
As we can see in the H4 chart, after finishing the correction, USDCHF started a new descending impulse, which has already reached 50.0% fibo and may yet continue towards 61.8% and 76.0% fibo at 0.9801 and 0.9748 respectively. the key resistance is the high at 1.0028.
In the H1 chart, there is a convergenceт MACD. If the price fails to break the low at 0.9840 in the nearest future, the instrument may start a new rising correction to reach 23.6%, 38.2%, and 50.0% fibo at 0.9877, 0.9900, and 0.9918 respectively.
Attention! Forecasts presented in this section only reflect the author’s private opinion and should not be considered as guidance for trading. RoboForex LP bears no responsibility for trading results based on trading recommendations described in these analytical reviews.
On Friday, the US dollar weakened against a basket of currency majors. The dollar index (#DX) closed the trading session in the red zone (-0.34%). Currently, the US currency is consolidating. Investors are focused on the news concerning Brexit.
Last weekend, British parliament officials were supposed to vote on the Brexit deal, but MPs refused to vote on it and obligated British Prime Minister Boris Johnson to ask the European Union to postpone the country’s exit from the bloc. Boris Johnson was totally against the delay, but the deputies voted and demanded him to appeal to the EU. Johnson’s letter to the President of the European Council, Donald Tusk, states that the Prime Minister is asking for a Brexit delay until January 31, 2020.
Meanwhile, on the weekend, the British took to the streets for a manifesto asking for a second Brexit referendum. The mayor of London, Sadiq Khan, also took part in the march. We recommend following current information on Brexit.
The “black gold” prices are declining. At the moment, futures for the WTI crude oil are testing the $53.45 mark per barrel.
Market Indicators
On Friday, there was the bearish sentiment in the US stock markets: #SPY (-0.44%), #DIA (-1.01%), #QQQ (-0.96%).
The 10-year US government bonds yield has risen again. Currently, the indicator is at the level of 1.77-1.78%.
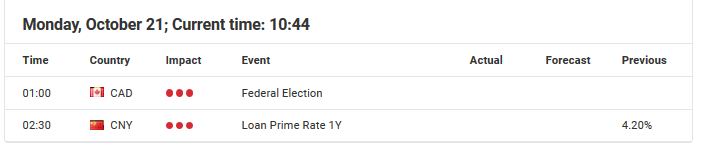
The Economic News Feed for 21.10.2019:
Today, the publication of important economic releases is not expected.
While the economic calendar is thin for the start of the week, what’s of higher interest is the expectation of finally seeing a Brexit deal.
Over the weekend, the British parliament voted to put off a decision on the deal negotiated during the prior week, forcing Boris Johnson to ask the EU for yet another Brexit delay.
With that in mind, it remains unclear in which direction the equity markets, especially the DAX30 CFD will move.
When looking at the price action of the last week, one could assume that any deal should be initially bullish (and vice versa…), but with the erratic price action over the last few days has likely priced in a lot of these types of deals, so the positive impact remains low, at least in our opinion.
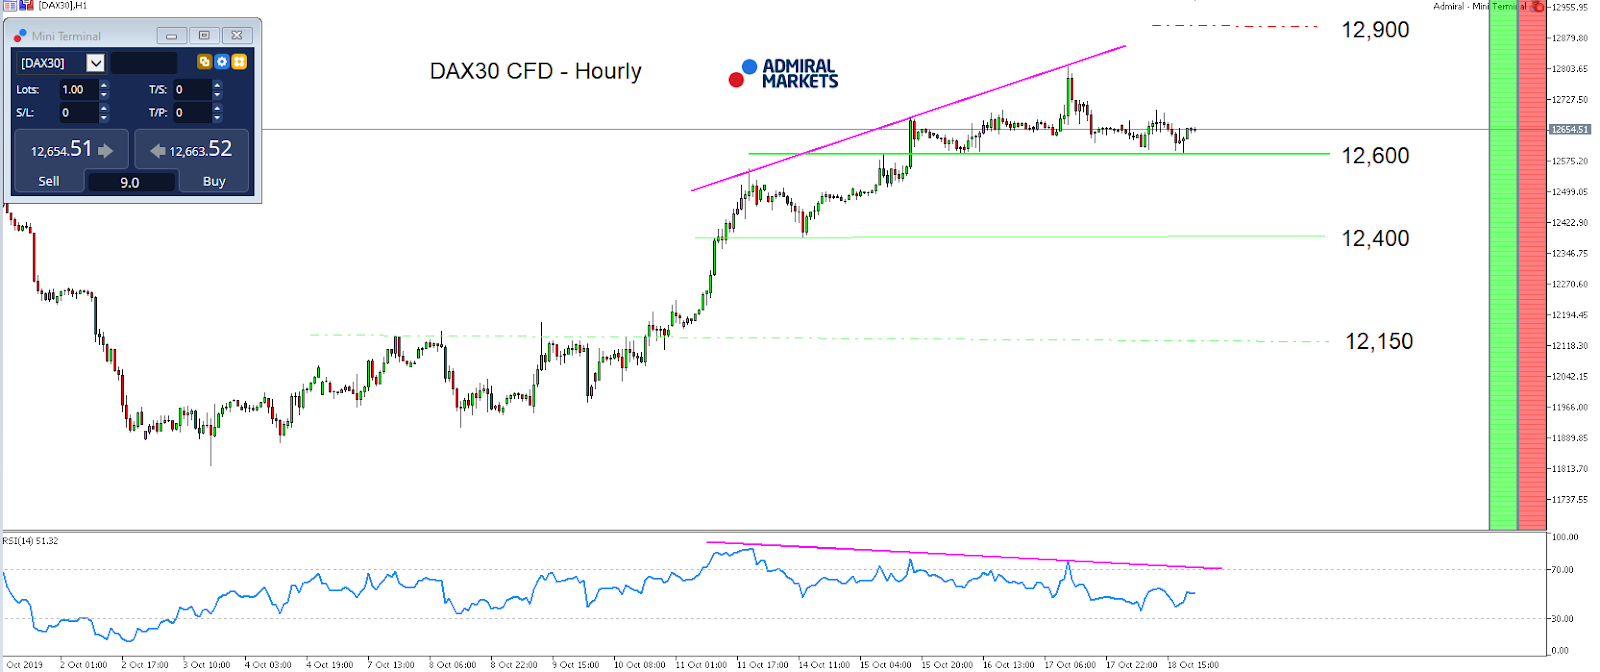
From a purely technical perspective, the key level on the downside can be found around 12,600 points. A break lower makes a weak weekly start very likely, activating the region around 12,400 points as a first target on the downside.
On the upside the main focus can be found around the pre-weekly highs around 12,800/820 points where a break higher makes further gains up to 12,900/930 points an option:
Source: Admiral Markets MT5 with MT5-SE Add-on DAX30 CFD Hourly chart (between October 1, 2019, to October 18, 2019). Accessed: October 18, 2019, at 10:00pm GMT
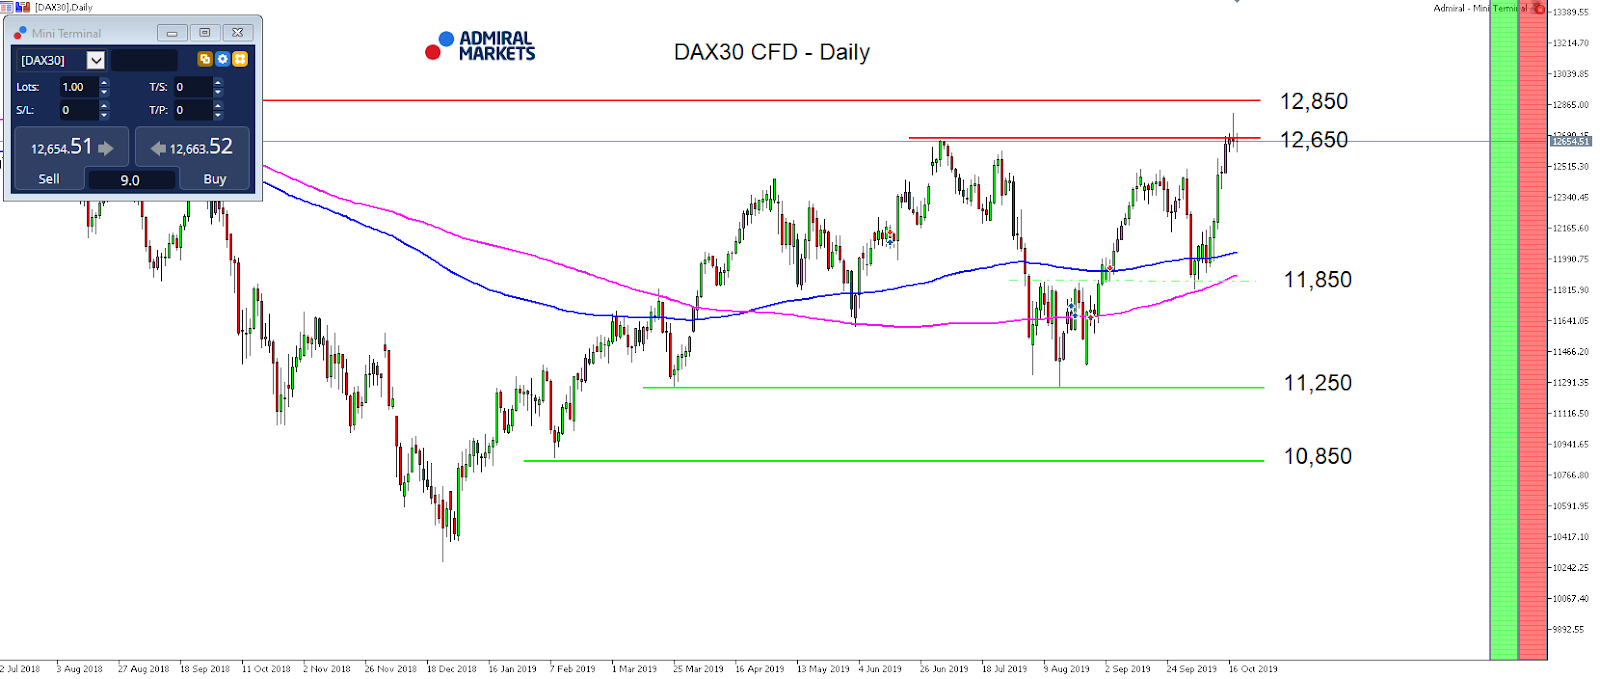
Source: Admiral Markets MT5 with MT5-SE Add-on DAX30 CFD Daily chart (between July 12, 2018, to October 18, 2019). Accessed: October 18, 2019, at 10:00pm GMT – Please note: Past performance is not a reliable indicator of future results, or future performance.
In 2014, the value of the DAX30 CFD increased by 2.65%, in 2015, it increased by 9.56%, in 2016 it increased by 6.87%, in 2017 it increased by 12.51%, in 2018 it fell by 18.26%, meaning that after five years, it was up by 10.5%.
Discover the world’s #1 multi-asset platform
Admiral Markets offers professional traders the ability to trade with a custom, upgraded version of MetaTrader 5, allowing you to experience trading at a significantly higher, more rewarding level. Experience benefits such as the addition of the Market Heat Map, so you can compare various currency pairs to see which ones might be lucrative investments, access real-time trading data, and so much more. Click the banner below to start your FREE download of MT5 Supreme Edition!
Disclaimer: The given data provides additional information regarding all analysis, estimates, prognosis, forecasts or other similar assessments or information (hereinafter “Analysis”) published on the website of Admiral Markets. Before making any investment decisions please pay close attention to the following:
This is a marketing communication. The analysis is published for informative purposes only and are in no way to be construed as investment advice or recommendation. It has not been prepared in accordance with legal requirements designed to promote the independence of investment research, and that it is not subject to any prohibition on dealing ahead of the dissemination of investment research.
Any investment decision is made by each client alone whereas Admiral Markets shall not be responsible for any loss or damage arising from any such decision, whether or not based on the Analysis.
Each of the Analysis is prepared by an independent analyst (Jens Klatt, Professional Trader and Analyst, hereinafter “Author”) based on the Author’s personal estimations.
To ensure that the interests of the clients would be protected and objectivity of the Analysis would not be damaged Admiral Markets has established relevant internal procedures for prevention and management of conflicts of interest.
Whilst every reasonable effort is taken to ensure that all sources of the Analysis are reliable and that all information is presented, as much as possible, in an understandable, timely, precise and complete manner, Admiral Markets does not guarantee the accuracy or completeness of any information contained within the Analysis. The presented figures refer that refer to any past performance is not a reliable indicator of future results.
The contents of the Analysis should not be construed as an express or implied promise, guarantee or implication by Admiral Markets that the client shall profit from the strategies therein or that losses in connection therewith may or shall be limited.
Any kind of previous or modeled performance of financial instruments indicated within the Publication should not be construed as an express or implied promise, guarantee or implication by Admiral Markets for any future performance. The value of the financial instrument may both increase and decrease and the preservation of the asset value is not guaranteed.
The projections included in the Analysis may be subject to additional fees, taxes or other charges, depending on the subject of the Publication. The price list applicable to the services provided by Admiral Markets is publicly available from the website of Admiral Markets.
Leveraged products (including contracts for difference) are speculative in nature and may result in losses or profit. Before you start trading, you should make sure that you understand all the risks.
The EUR/USD currency pair continues to show a positive trend. On Friday, the trading instrument updated the local highs once again. Currently, EUR/USD quotes are consolidating. EUR found resistance at 1.11700. 1.11350 is already a mirror support. The technical picture signals further growth. We recommend that you up-to-date with the information regarding the settlement of the trade conflict between the US and China, as well as the Brexit process. Open positions from key levels.
The Economic News Feed for 21.10.2019 is calm.
The price fixed above 50 MA and 100 MA, which signals the strength of buyers.
The MACD histogram is in the positive zone, but below the signal line, which gives a weak signal to buy EUR/USD.
Stochastic Oscillator is in the neutral zone, the %K line crossed the %D line. There are no signals at the moment.
Trading recommendations
Support levels: 1.11350, 1.11000, 1.10850
Resistance levels: 1.11700, 1.12000
If the price consolidates above the resistance level of 1.11700, 1.12000-1.12200.
Alternatively, the quotes can descend toward 1.11000.
The GBP/USD currency pair
Technical indicators of the currency pair:
Prev Open: 1.28907
Open: 1.29488
% chg. over the last day: -0.54
Day’s range: 1.28741 – 1.29502
52 wk range: 1.1959 – 1.3385
The GBP/USD currency pair stabilized after a protracted rally. GBP is currently consolidating. The key support and resistance levels are 1.28550 and 1.29800, respectively. Market participants are waiting for new information regarding the Brexit process. Voting on an agreement reached last week between London and Brussels is postponed until Monday. British lawmakers on Saturday supported the amendment, requiring Boris Johnson to request the EU to postpone Brexit. We recommend opening positions from key levels.
The Economic News Feed for 21.10.2019 is calm.
Indicators do not give accurate signals: the price is consolidating near 50 MA.
The MACD histogram has approached 0.
Stochastic Oscillator is in the neutral zone, the %K line is below the %D line, which indicates a bearish sentiment.
Trading recommendations
Support levels: 1.28550, 1.27600, 1.26500
Resistance levels: 1.29800, 1.30500
If the price consolidates above the resistance level of 1.29800, expect further growth toward 1.30400-1.30600.
Alternatively, the quotes could reduce toward 1.27600-1.27400.
The USD/CAD currency pair
Technical indicators of the currency pair:
Prev Open: 1.31352
Open: 1.31330
% chg. over the last day: -0.02
Day’s range: 1.31266 – 1.31382
52 wk range: 1.2727 – 1.3664
The USD/CAD currency pair is dominated by bearish sentiment. The trading instrument has reached the three-month lows. CAD is currently consolidating. The local support and resistance levels are: 1.31200 and 1.31500, respectively. USD/CAD quotes have the potential to further decline. We recommend that you pay attention to the dynamics of prices of “black gold”. Positions must be opened from key levels.
The Economic News Feed for 21.10.2019 is calm.
Indicators point to the strength of sellers: the price has fixed below 50 MA and 100 MA.
The MACD histogram is in the negative zone, but above the signal line, which gives a weak signal to sell USD/CAD.
The Stochastic Oscillator is in the neutral zone, the %K line crossed the %D line. There are no signals at the moment.
Trading recommendations
Support levels: 1.31200, 1.31000
Resistance levels: 1.31500, 1.31800, 1.32100
If the price consolidates below 1.31200, expect a further drop toward 1.30800-1.30600.
Alternatively, the quotes could grow toward 1.31800-1.32000.
The USD/JPY currency pair
Technical indicators of the currency pair:
Prev Open: 108.648
Open: 108.434
% chg. over the last day: -0.08
Day’s range: 108.289 – 108.554
52 wk range: 104.97 – 114.56
The technical picture on the USD/JPY currency pair is still ambiguous. The trading instrument is in lateral movement. Investors expect additional drivers. At the moment, the local support and resistance levels are 108.300 and 108.650, respectively. In the near future, technical correction of the USD/JPY quotes is highly possible. We recommend that you pay attention to the dynamics of the yield of US government securities. Positions must be opened from key levels.
During the Asian trading session, Japan published a weak report on the trading balance.
Indicators do not give accurate signals: 50 MA crossed 100 MA.
The MACD histogram is in the negative zone but above the singal line, which gives a weak signal for selling USD/JPY.
The Stochastic Oscillator is in the overbought zone, the %K line crossed the %D line. There are no signals at the moment.
Trading recommendations
Support levels: 108.300, 108.000, 107.750
Resistance levels: 108.650, 108.900
If the price consolidates above 108.650, expect further growth of the USD/JPY toward 108.900-109.200.
Alternatively, the quotes could decrease toward 108.000-107.800.
On Friday the 18th of October, trading on the euro closed up. The bullish phase started in the European session and continued throughout the rest of the day. The euro rose on the back of a broadly weaker dollar, which was put under pressure by the UK’s EU withdrawal agreement. The EURUSD pair rose to 1.1172 without any corrections.
Day’s news (GMT+3):
13:00 Germany: German Buba monthly report.
18:00 UK: BoE’s Haldane speech.
Current situation:
Friday’s expectations were met. Geopolitical developments are maintaining the pair’s bullish trend. Having reached fresh highs, a correction was expected. This correction has begun, although the pair is now trading sideways.
On Saturday the 19th of October, the British parliament passed an amendment forcing Prime Minister Boris Johnson to seek an extension to Brexit. The UK’s exit from the EU drags on. Nevertheless, this is good for the pound. The European Parliament will most likely hold a vote to ratify the Brexit agreement today.
The FOMC has a meeting on the 30th of October. US economic data is mixed. Vice Chair of the Federal Reserve Richard Clarida said on Friday that the US economy is in good shape, although there are still some evident risks to keep an eye on. According to CME’s FedWatch Tool, there’s an 84% chance of an interest rate reduction. The euro has a week to hit fresh highs and break through the weekly trend line projected from 1.2350.
We’re expecting fresh highs today followed by a rebound to the LB. The pair is currently trading around the trend line, so it will be interesting to see how big the rebound is in order to better understand the bulls’ intentions. There was growth on Friday, so today we should have predicted a Monday v Friday scenario. However, due to the geopolitical situation and the euro crosses, we expect a correction to take place only after hitting fresh highs.
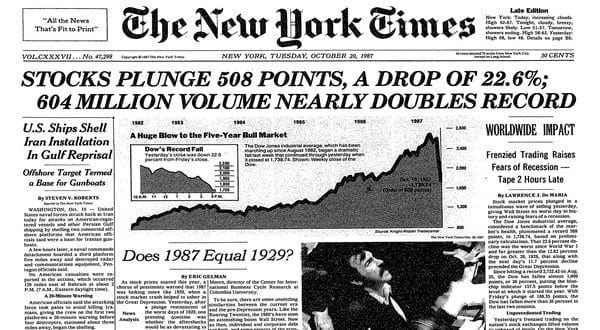
Back in the day, for those of you that are old enough to remember and have experienced one of the most incredible trader psychology driven stock market decline in recent history.
The difference between “Black Monday” and most of the other recent stock market declines is that October 19, 1987, was driven by a true psychological panic, what we consider true price exploration, after an incredible price rally.
It is different than the DOT COM (2001) decline and vastly different than the Credit Market Crisis (2008-09) because both of those events were related to true fundamental and technical evaluations. In both of those instances, prices have been rising for quite some time, but the underlying fundamentals of the economics of the markets collapsed and the markets collapsed with future expectations. Before we get too deep, be sure to opt-in to our free market trend signals newsletter.
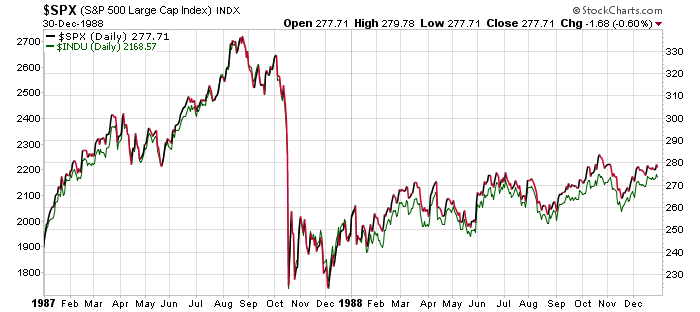
Our researchers believe the setup prior to the Black Monday collapse is strangely similar to the current setup across the global markets. In 1982, Ronald Reagan was elected into his second term as the US President. Since his election in 1980, the US stock market has risen over 300% by August 1987.
Reagan, much like President Trump, was elected after a long period of US economic malaise and ushered in an economic boom-cycle that really began to accelerate near August 1983 – near the end of his first term. The expansion from the lows of 1982, near 102.20, to the highs of 1987, near 337.90, in the S&P 500 prompted an incredible rally in the US markets for all global investors.
This is very similar to what has happened since 2015/16 in the markets and particularly after the November 2016 elections when the S&P500 bottomed near 1807.5 and has recently set hew highs near 3026.20 – a 67.4% price rally in just over 3 years.
One can simply make the assumption that global investors poured capital in the US markets in 1983 to 1986 as the US markets entered a rally mode just like we suspect global investors have poured capital into the US markets after the 2016 US elections and have continued to seek value, safety, and returns in the US markets since. These incredible price rallies setup a very real potential for “true price exploration” when investors suddenly realize valuations may be out of control.
So, what actually happened on October 19th, 1987 that was different than the last few market collapse events and why is it so similar to what is happening today?
On October 19, 1987, a different set of circumstances took place. This was almost a perfect storm of sorts for the markets. The US markets had risen nearly 44% by August 1987 from the previous yearly close – a huge rally had taken place. Computer trading, which some people suspected may have been a reason for the price decline on October 19, was largely in its infancy.
Floor traders were running the show in New York and Chicago. The London markets closed early the Friday, October 16, because of a weather event that was taking place. The “setup” of these events may have played a roll in the liquidity issues that became evident on Black Monday and pushed the US markets down 22.61% by the end of trading.
The US markets had set up a top near 2,722 in early August 1987 after rising nearly 44% from the 1986 end of year closing price level of 1,895. The SPX rotated lower from this peak to set up a sideways price channel near 315 throughout the end of August and through most of September. On October 5, 1987, the SPX started a downward price move that attempted to test the lower support channel near 312. On October 12, one week later, the SPX broke below this support channel and closed at 298.10 (below the psychological 300 level). The very next weekend was October 17 & 18 – the weekend before Black Monday.
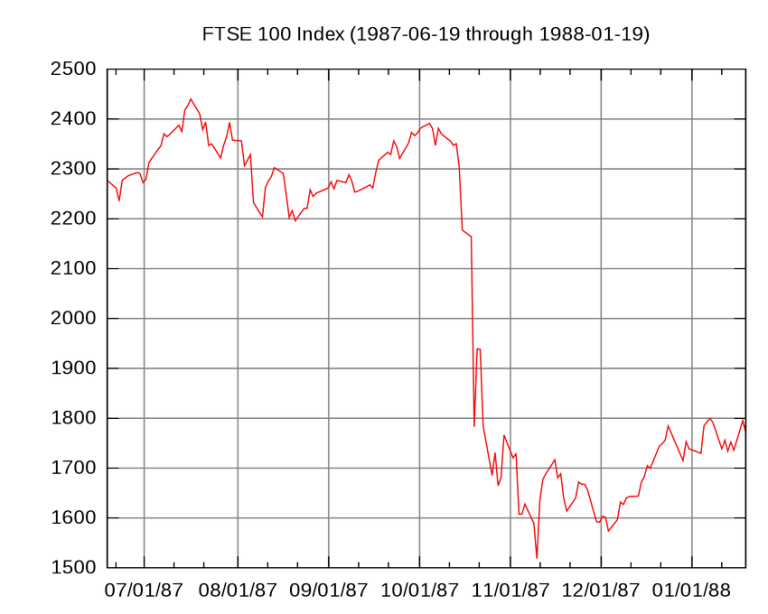
Sunday night, October 18, in the US, the Asian markets opened for trading and a price sell-off began taking place in Hong Kong. Because the London markets has closed early on the 16th due to the storm, by the time they opened the UK markets began tanking almost immediately. Early in the day on Monday, October 19, the FTSE100 had collapsed over 136 points.
Our researchers believe the declines in the US markets in early October 1987 set up a breakdown event that, once support was broken, prompted a collapse event where liquidity issues accelerated the price decline volatility – much like the “flash crash”. Global investors were unprepared for the scale and scope of the price decline event and panicked at the speed of the price collapse.
In fact, at the height of the 1987 crash, systemic problems (mostly solvency and brokerage house operations) continued to threaten a much larger financial market collapse. Within days of Black Monday, it became evident that margin accounts and solvency issues related to operating capital, large scale risks and continued fear that the markets may continue to collapse presented a very real problem for the US and for the world. Have we reentered another Black Monday type of setup across the global markets?
As new economic data continues to suggest the global markets are economically contracting and stagnating, the US Federal Reserve has started buying assets again while the foreign central banks continue to push negative interest rates while attempting to spark any signs of real economic growth. The US stock market has continued to push higher – almost attempting new all-time highs again just recently. The US stock market is up nearly 68% over the past 3.5 years since Trump was elected and as of Friday, October 18, 2019, the US stock markets fell nearly 0.75% on economic fears.
In Part II of this article, we’ll explore the potential of another Black Monday type of setup that may be playing out before our very eyes right now in the US stock market.
As a technical analysis and trader since 1997, I have been through a few bull/bear market cycles. I believe I have a good pulse on the market and timing key turning points for both short-term swing trading and long-term investment capital. The opportunities are massive/life-changing if handled properly.
I urge you visit my ETF Wealth Building Newsletter and if you like what I offer, join me with the 1-year subscription to lock in the lowest rate possible and ride my coattails as I navigate these financial market and build wealth while others lose nearly everything they own during the next financial crisis. Join Today to Get a Free 1oz Silver Bar with a subscription – Offer Ends This Week!
The UK economy has been delivered another fresh blow following the drama that has taken place in the British parliament on Saturday.
This is the stark message from the CEO of one of the world’s largest independent financial advisory organizations.
The comments from Nigel Green, chief executive of deVere Group, come as Prime Minister Boris Johnson faced a new setback after MPs backed a move – in the form of the Letwin Amendment – to delay a Brexit deal until further legislation is passed.
Dubbed Super Saturday, it was Parliament’s first weekend session in 37 years.
Mr Green notes: “One of the most important days in British political history became something of a damp squib as the Letwin Amendment rendered the Meaningful Vote meaningless.
“The prospect of a no-deal Brexit is now becoming increasingly likely. As such, the government is said to be upping its no-deal preparations and is set to introduce legislation needed for the UK to leave the EU on October 31.
“The Prime Minister is clear that he will not negotiate a delay and says that the law doesn’t compel him to do so. He will tell EU leaders there should be no delays and that they should reject Parliament’s letter asking for a delay.”
He continues: “These extraordinary goings-on extend and intensify the ongoing Brexit-fuelled uncertainty and chaos.
“The event of not-so-Super Saturday will negatively hit UK financial assets, major investment decisions will continue to be put on hold by companies and organisations, as will big-ticket spending items by households, and confidence and opportunity will continue to be undermined.
“This will, of course, all compromise the British economy.”
He goes on to add: “Much of the chaos has already been priced-in to the pound, so it will be to some degree shielded from the events in parliament today.”
Mr Green concludes: “The tense and volatile geopolitical climate in the UK is one of the main headwinds for domestic UK and international investors around the world as what happens in Westminster can affect returns.
“UK and international investors in UK assets can be expected to respond to the continuing uncertainties by considering removing their wealth and assets away from the UK.
“Amid the uncertainty, one thing is certain: Whatever happens next, the ongoing Brexit nightmare is not going to end on Halloween.”
About:
deVere Group is one of the world’s largest independent advisors of specialist global financial solutions to international, local mass affluent, and high-net-worth clients. It has a network of more than 70 offices across the world, over 80,000 clients and $12bn under advisement
Our research team believes the US Treasuries and the US Dollar will continue to strengthen over the next 2 to 6+ weeks as foreign market and emerging market credit and debt concerns outweigh any concerns originating from the US economy or political theater. Overall, the major global economies will likely continue to see strength related to their currencies and debt instruments simply because the foreign market and emerging markets are dramatically more fragile than the more mature major global economies.
We believe the US Treasuries may surprise investors by rallying from current levels, near price resistance, to levels above $151 on the TLT chart.
Our belief is that further economic concerns related to trade, foreign economic metrics and data and the forward perspective of many emerging and foreign markets will continue to weaken much more dramatically than the US or other major global economies. Thus, we believe capital will continue to pour into the US and more mature major global economic markets (Canada, Japan, Great Britain, Swiss) as a move to safety just as capital is moving into the precious metals markets.
When fear enters the global markets, capital seeks out the safest and most secure environments for investment. If the rest of the world’s economies are becoming weaker and more fragile as trade and economic factors continue to hit the news wires, the more mature major economic countries are naturally going to benefit from their more robust and secure economic power and strength. The flight to safety will result in capital moving away from risk and into the safety of these more mature economies simply because they provide a level of security and risk aversion that can’t be found elsewhere. Make sure to opt-in to our free market trend signals newsletter.
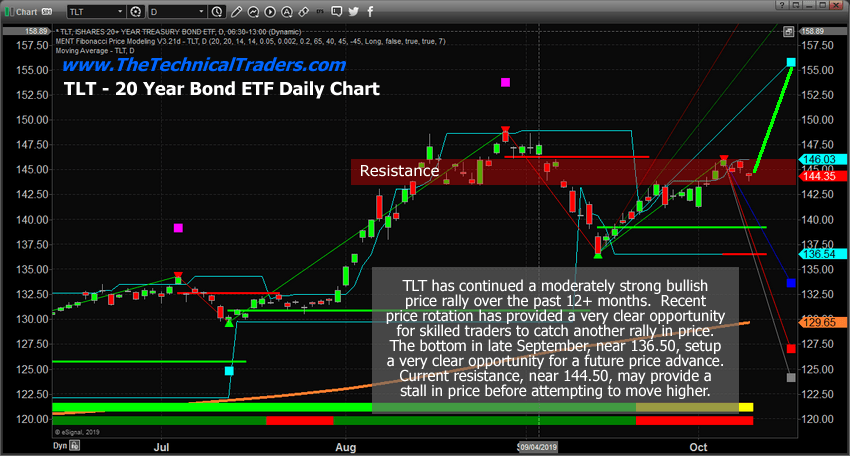
Daily TLT Chart
This Daily TLT chart highlights the resistance level that we believe is current constricting the current price advance from breaking higher. We believe this resistance channel is causing the TLT price to pause below $147 and will continue to keep prices within this channel until some economic news event or positive US economic news item pushes the price higher. The US and global markets are waiting for some type of news event before attempting to make another move. We believe the future news will result in an upside technical breakout and a new rally towards the $152 to $155 level in TLT.
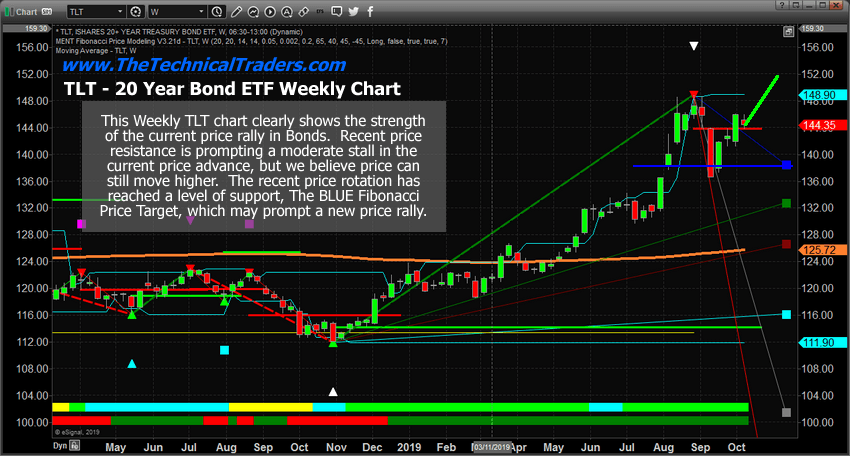
Weekly TLT Chart
This Weekly TLT chart highlights the extended bullish price rally that started back in late October 2018. This upside price move has already rallied more than 40%, but we don’t believe it is over yet. Our Fibonacci price modeling system is suggesting $154 to $155 is the next upside price target. To be a bit more conservative, we’ve targeted the $152 level for skilled traders to work with. Once price achieves the $152 target level, look to cover any open long trades you may have.
If you are an active trader of gold, gold stocks, bonds, or the SP500 and would like to hear a trading style that reduces the amount of trades you take while making the same or better returns listen to this conversion with Adam Johnson who is an x-Bloomberg anchor, and now active trader.
Understanding how pricing and global market dynamics work throughout the stock market and the global market can be confusing at times. How can one attempt to understand what will move in a certain direction, why it will move that way and how one can profit from these opportunities and be difficult for many people to grasp. We do our best to try to help you by highlighting trade setups, explaining our thinking and research, sharing some of the charts with our proprietary trading tools and to help you identify strong opportunities for success.
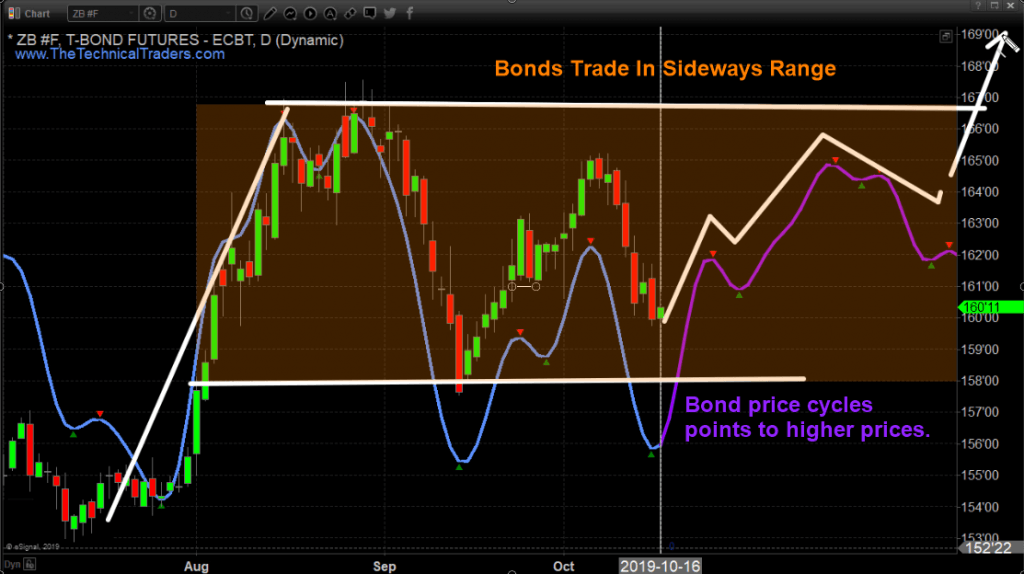
Bonds are likely to continue to trade in a sideways price range before breaking higher near the end of 2019. This aligns with our expectations that foreign markets may come under intense economic pressure while the US economy continues to provide safety for investors for the long term. The support level above 157 is critical going forward.
Daily Price Cycle Predicted Price Trend
While cycle analysis helps us paint a clear picture of what to expect looking forward up to 45 days I still rely on my market trend charts to know when I should be buying or selling positions.
The Technical Traders Concluding Thoughts:
Right now, we believe the markets are waiting for some news events to make their next move. This is the time to take very measured positions when trading. This is NOT the time to go “all-in” on some trade. Be prepared for a spike in volatility and a new price trend to establish within the next 3 to 10 trading days.
As a technical analysis and trader since 1997, I have been through a few bull/bear market cycles. I believe I have a good pulse on the market and timing key turning points for both short-term swing trading and long-term investment capital. The opportunities are massive/life-changing if handled properly.
I urge you visit my ETF Wealth Building Newsletter and if you like what I offer, join me with the 1-year subscription to lock in the lowest rate possible and ride my coattails as I navigate these financial market and build wealth while others lose nearly everything they own during the next financial crisis. Join Today to Get a Free 1oz Silver Bar with a subscription – Offer Ends This Week!
Today I want to talk to you about the SP500 because it’s on the verge of making a very significant move. We could experience a 15% rally or a 15% decline and it could be just around the corner.
Let me recap on both the short-term top this month, and then a look at the bigger picture of what happened last October through December and if we are going to see that happen again. There is the possibility we get a massive rally if the market breaks to new highs. The market is loaded and ready for action. Whichever way it breaks will have a strong impact on precious metals and bonds. Make sure to opt-in to our free market trend signals newsletter.
21 Days Then A Breakdown?
Let’s look at the SP500 for the last 6 months in the chart below. If we were to just draw support trendlines across the lows and a resistance trend line across the highs, you can see we still have some room for the SP500 to work itself higher and still be within the pattern.
Do you see the blue line that is on the chart? You will notice it follows price very closely and you’ll notice the purple line on the hard-right edge as well. This purple line is the forecasted projected cycle price that we are anticipating for the SP500 over the next 45 days.
I should note that as the market evolves and moves this price cycle forecast will change, but it gives us a good idea of current cycles in the market and where the price should go next.
Overall, we’re all you’re looking for SP500 to struggle to move higher because it acts as resistance. If resistance holds then it is likely the market breaks down and tests the August or September Low.
S&P 500 October – December Market Crash to Repeat?
Let’s step back and look at last year’s price action. You can see that the cycle analysis is pointing to potentially another market crash down to those December low. If that is the case then it could be the start of something very significant like a new bear market.
So that’s where we’re at in terms of the SP500 and at this point, we’ve got another 21 days or so before the SP500 should start breaking below our white trendline support level.
While cycle analysis helps us paint a clear picture of what to expect looking forward up to 45 days I still rely on my market trend charts to know when I should be buying or selling positions.
Bonds – The Natural Investor Safe Haven
The first safe haven investors flock to when they become scared are bonds. By looking at the chart we can see they should start to find a bottom based on our cycles. Bond prices are stuck within a large sideways channel and should hold their ground until the SP500 starts collapse. If the SP500 breaks down then we’re going to see bonds move higher and should eventually break out and make new highs.
Gold – The Safest of Safe Havens
The true safe Haven is gold when it comes to a global store of value for all countries and individuals.
Take a look at the price of gold, as you can see it rallied in June and again in August when the cycles bottomed and started an uptrend. Right now the price is in a much larger consolidation (bull flag pattern) which is a positive sign. In fact, this multi-month pause makes gold even more bullish in my opinion. The longer a commodity trades sideway the more powerful the next move will be.
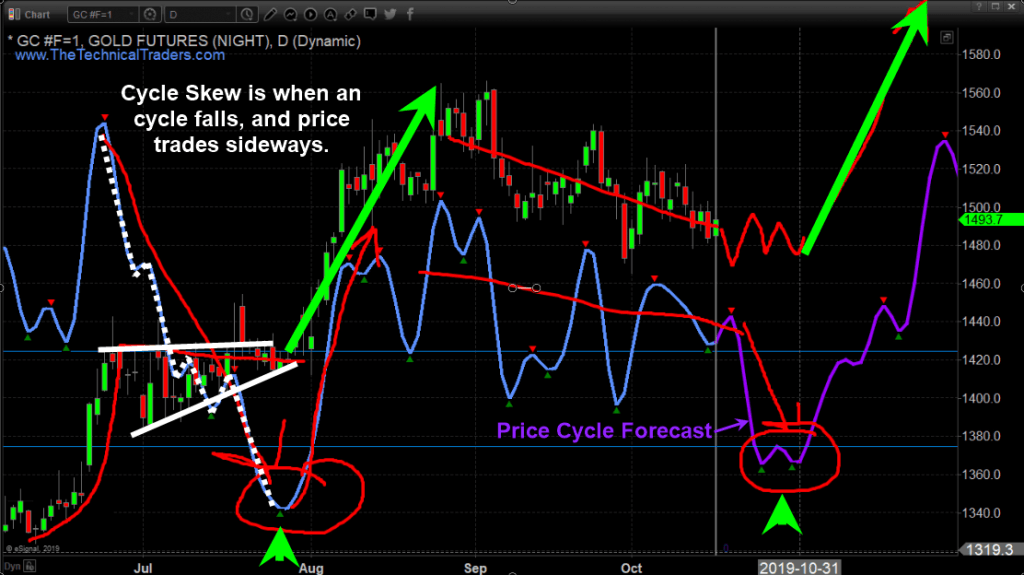
You can see based on our cycles analysis and forecasted price gold still has some potential weakness for a couple of weeks.
Understanding cycles and how to trade with them is much harder than most people think. If you do not understand cycle skew then you will struggle to turn a profit. I have been trading with cycles since 2001 and still, I find them very deceiving at times.
In laymen terms, cycle skew is when a cycle moves against the direction of the underlying asset’s trend. The chart below shows this clearly with the white lines. In short, gold is in an uptrend, and when the cycle moves down against the assets trend price will in most cases trade sideways. Do not try to short cycle tops when the trend is up, no matter how tempting it may be.
The key is to wait for cycles to bottom, then get back into position for the next upward move in the cycle and price.
I had a fantastic chat with Adam Johnson from BullsEyeBrief today and if you are interested in more juicy details on the SP500, Gold, and how I trades be sure to listen to the most recent podcast we did together at the top of his website https://bullseyebrief.com/podcast/
The Technical Traders Thoughts:
In short, the stock market continues to keep the bull market alive, but investors have started to move into gold as a safe haven. The fear of a market downturn is growing which is why gold has rallied and started a new bull market. The money flow into gold is very strong and is warning us that US equities could enter a bear market in the next few months and that possibly something much larger globally could be at play as well.
Gold continues to just hold up well even with the current cycle forecast trending lower. Overall, we’re looking at about 20 days or so and we could see metals and equity prices make some incredible moves.
Keep reading our research because our proprietary tools have been nailing all of these price targets and move many months in advance. The next bottom in metals should set up when our cycle bottoms – then the next upside leg will begin. This time Gold should target $1800 and Silver should target $21 to $24. This will be an incredible move higher if it plays out as we suspect.
I urge you visit my ETF Wealth Building Newsletter and if you like what I offer, join me with the 1-year subscription to lock in the lowest rate possible and ride my coattails as I navigate these financial market and build wealth while others lose nearly everything they own during the next financial crisis. Join Now and Get a Free 1oz Silver Bar!
As a technical analysis and trader since 1997, I have been through a few bull/bear market cycles. I believe I have a good pulse on the market and timing key turning points for both short-term swing trading and long-term investment capital. The opportunities are massive/life-changing if handled properly.
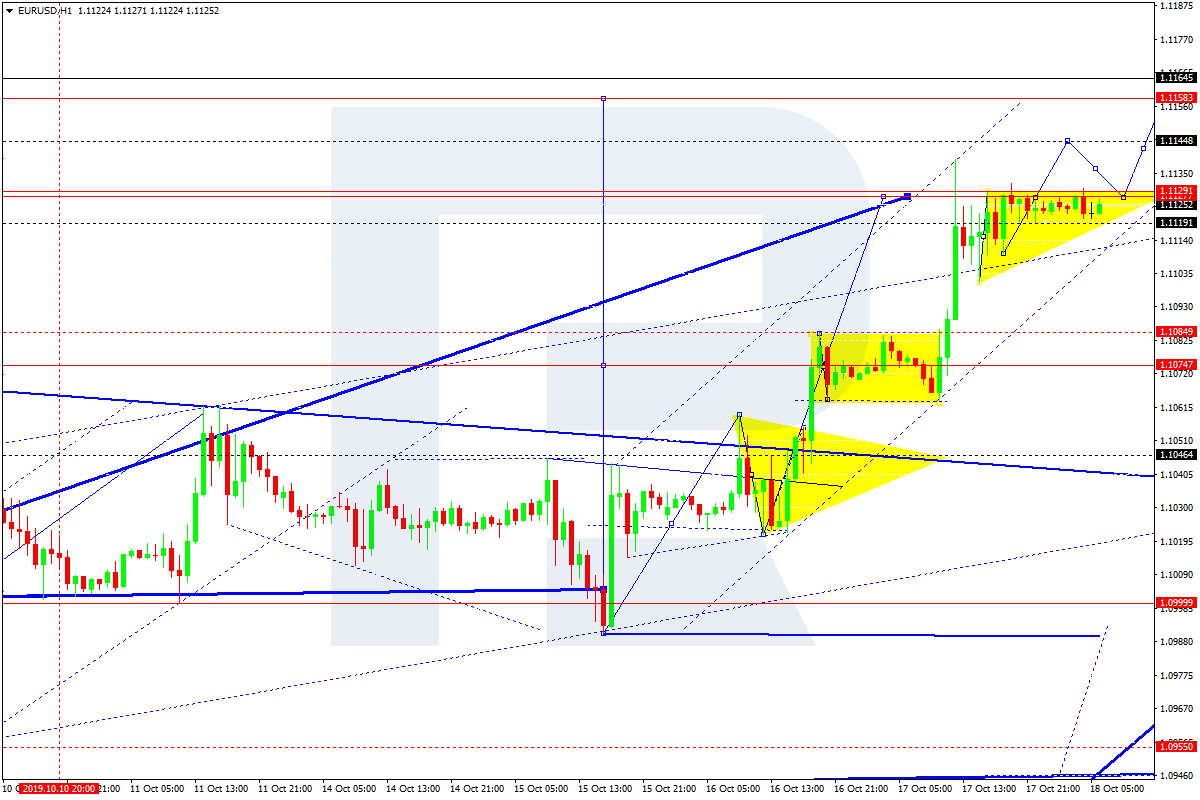
EURUSD continues forming the ascending structure from 1.1074; right now, it is consolidating below 1.1129. Possibly, the pair may break this range to the upside and continue growing towards 1.1144. Later, the market may form a new descending structure to reach 1.1129 and then start another growth towards 1.1158 to complete this ascending wave. After that, the instrument may start a new correction with the target at 1.1000.
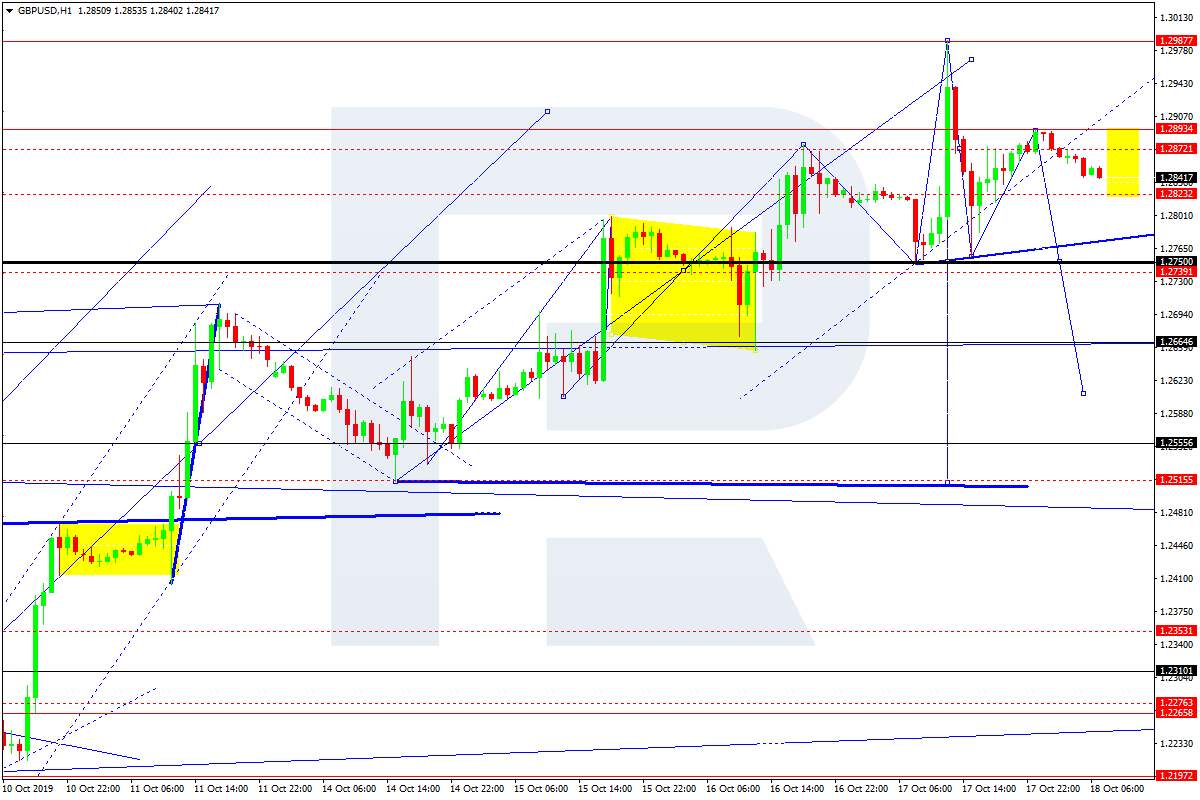
GBPUSD, “Great Britain Pound vs US Dollar”
After reaching the target at 1.2980, GBPUSD has completed the descending impulse at 1.2755 along with the correction towards 1.2893; right now, it is moving downwards. Possibly, the pair may break 1.2750 and then continue trading downwards with the target at 1.2555.
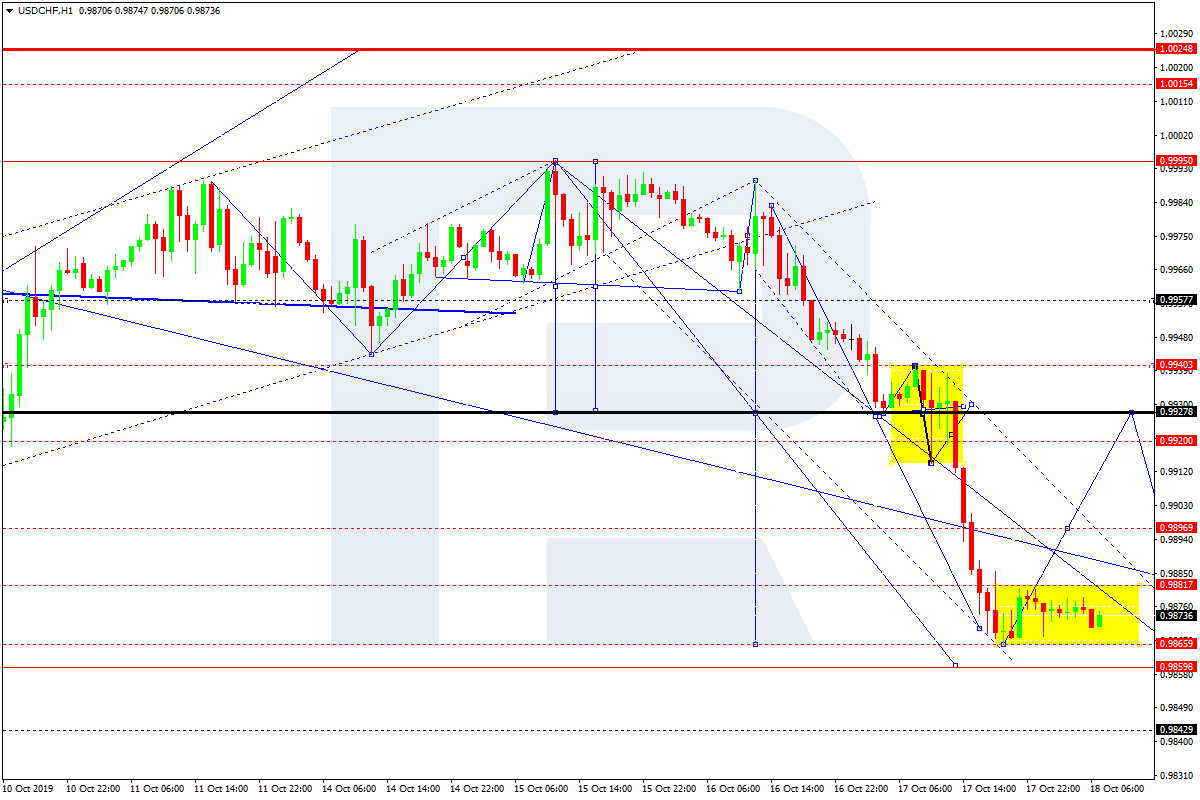
USDCHF, “US Dollar vs Swiss Franc”
After completing another consolidation range around 0.9927, USDCHF has broken it to the downside and may continue the descending correction towards 0.9860. After that, the instrument may resume trading upwards with the first target at 0.9930.
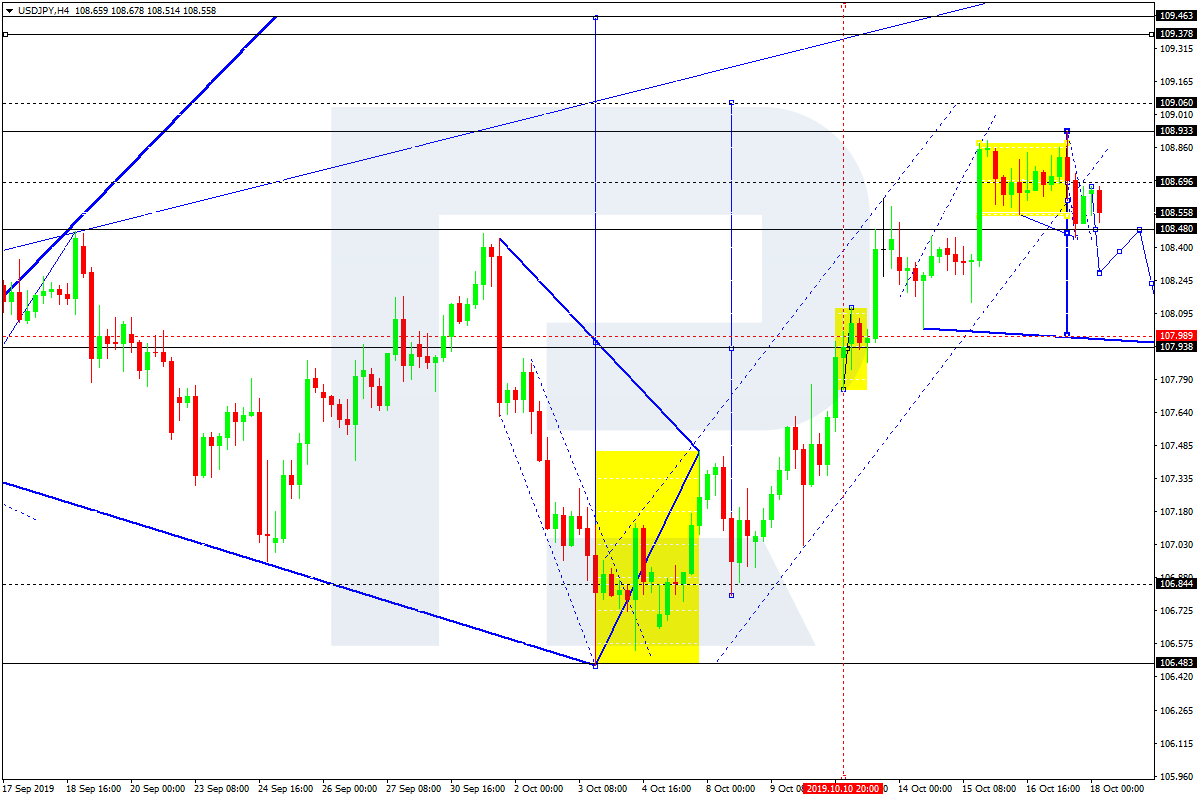
USDJPY, “US Dollar vs Japanese Yen”
USDJPY continues consolidating around 108.69. If later the price breaks this range to the downside, the instrument may form a new descending structure to reach 108.00; if to the upside – resume trading upwards with the target at 109.06.
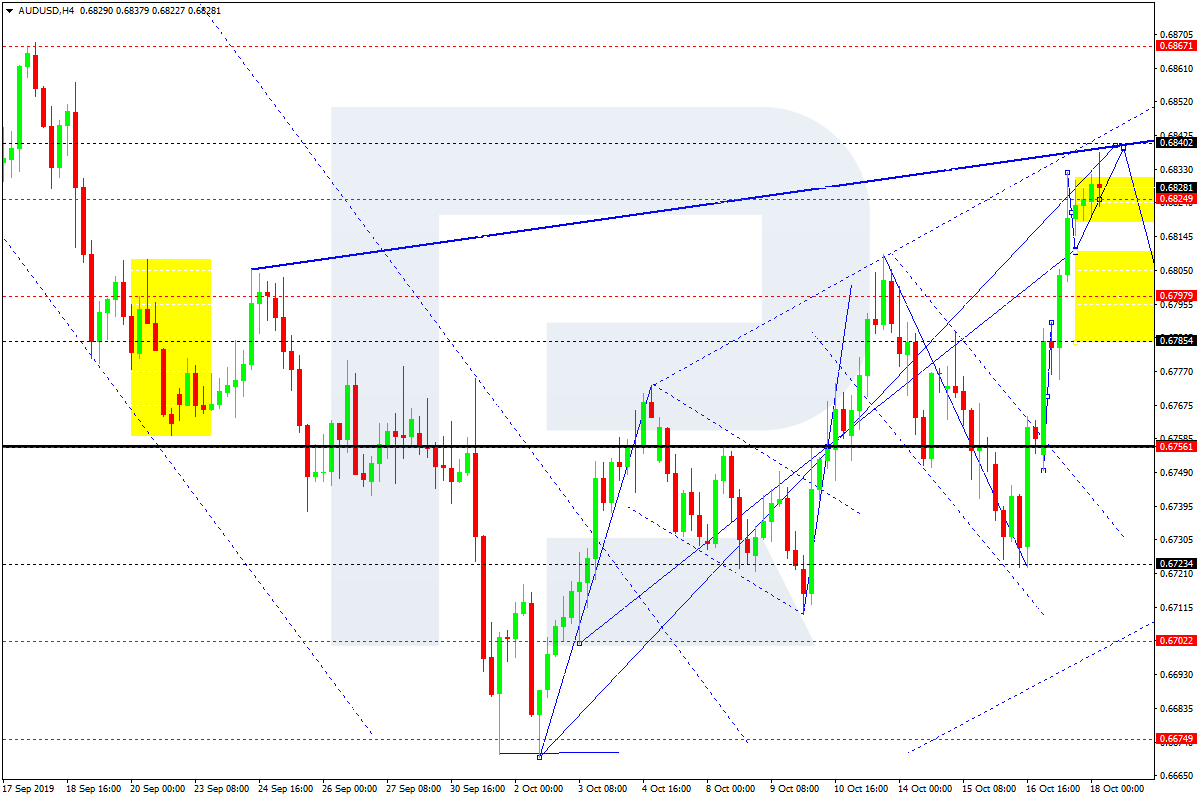
AUDUSD, “Australian Dollar vs US Dollar”
AUDUSD is moving upwards; right now, it is forming the fifth wave with the target at 0.6840. After that, the instrument may consolidate and form a reversal pattern. The first downside target is at 0.6755.
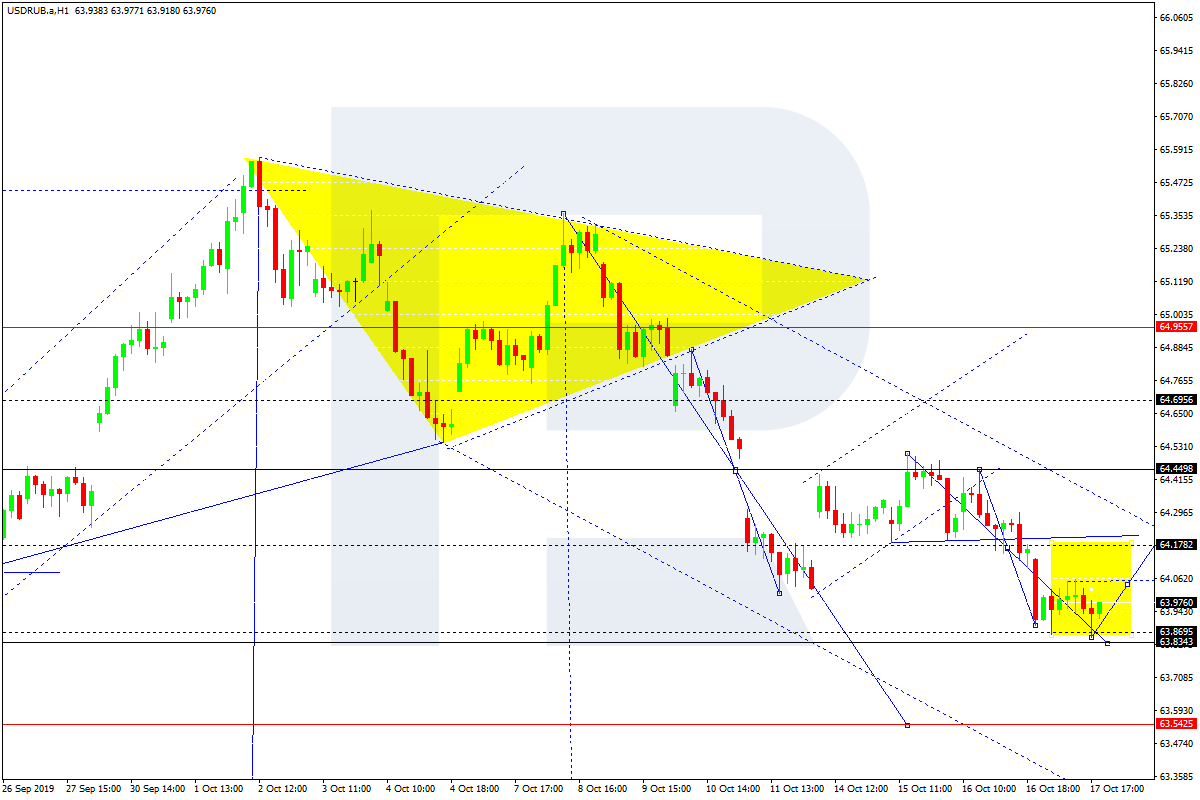
USDRUB, “US Dollar vs Russian Ruble”
USDRUB has reached 63.87; right now, it is consolidating near the lows. Possibly, the pair may grow towards 64.17. Later, the market may continue trading inside the downtrend with the target at 63.54.
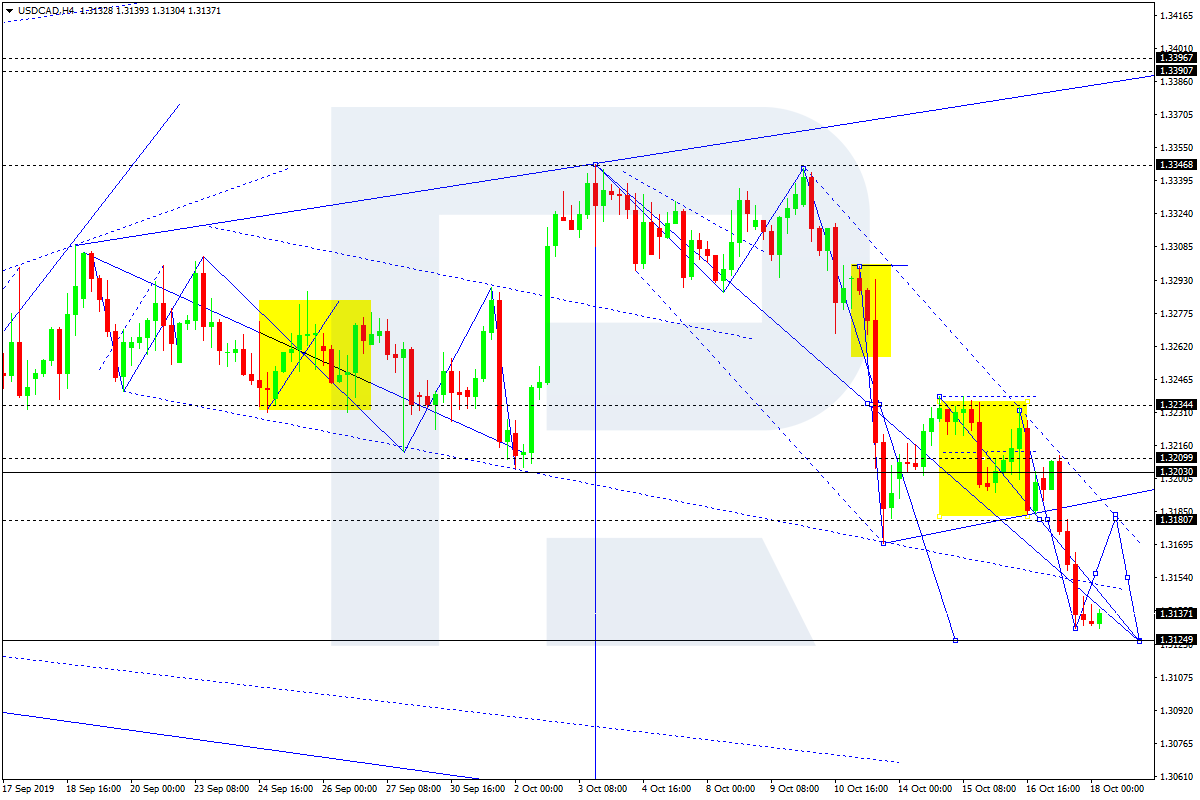
USDCAD, “US Dollar vs Canadian Dollar”
USDCAD continues falling towards 1.3125. Later, the market may consolidate and form a reversal pattern. The pair is expected to form one more ascending structure with the target at 1.3235.
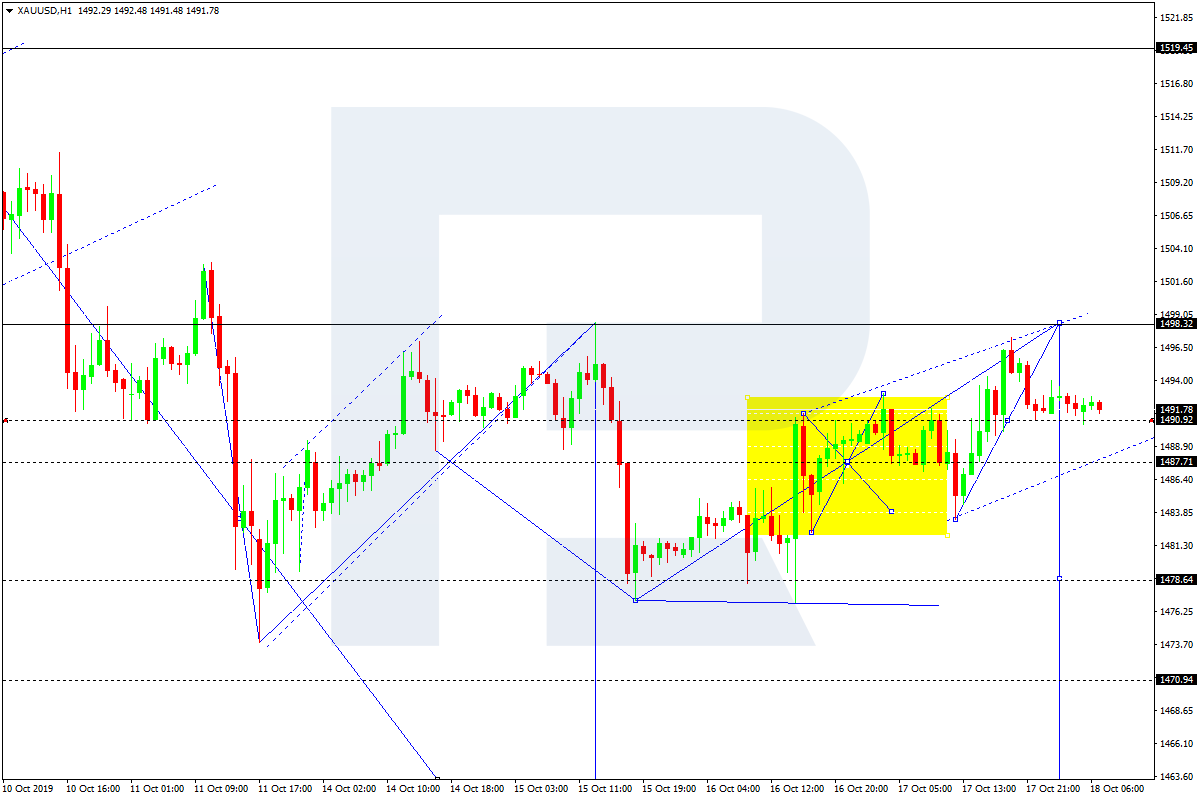
XAUUSD, “Gold vs US Dollar”
Gold is still growing towards 1498.30. After that, the instrument may fall to break 1487.70 and then continue trading inside the downtrend with the predicted target at 1459.33.
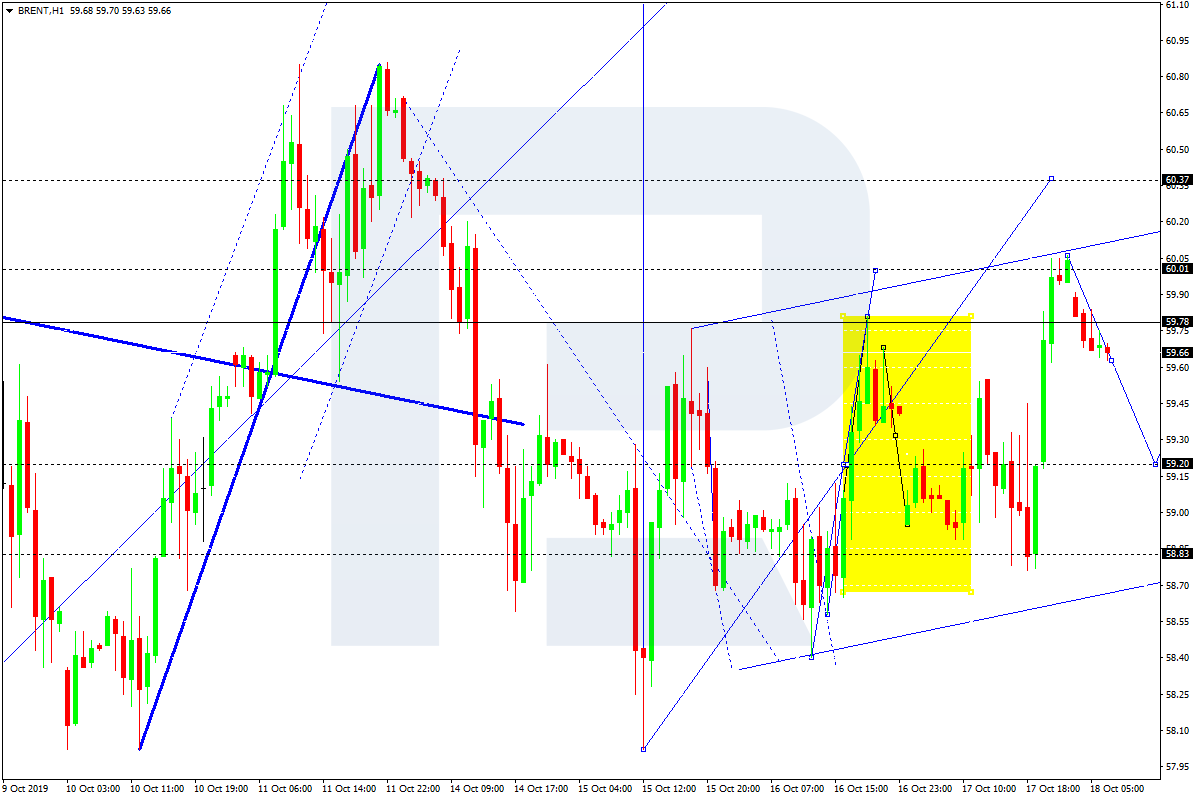
BRENT
НAfter reaching the short-term target at 60.00, Brent is moving downward to reach 59.20. Later, the market may resume trading upwards with the first target at 60.40.
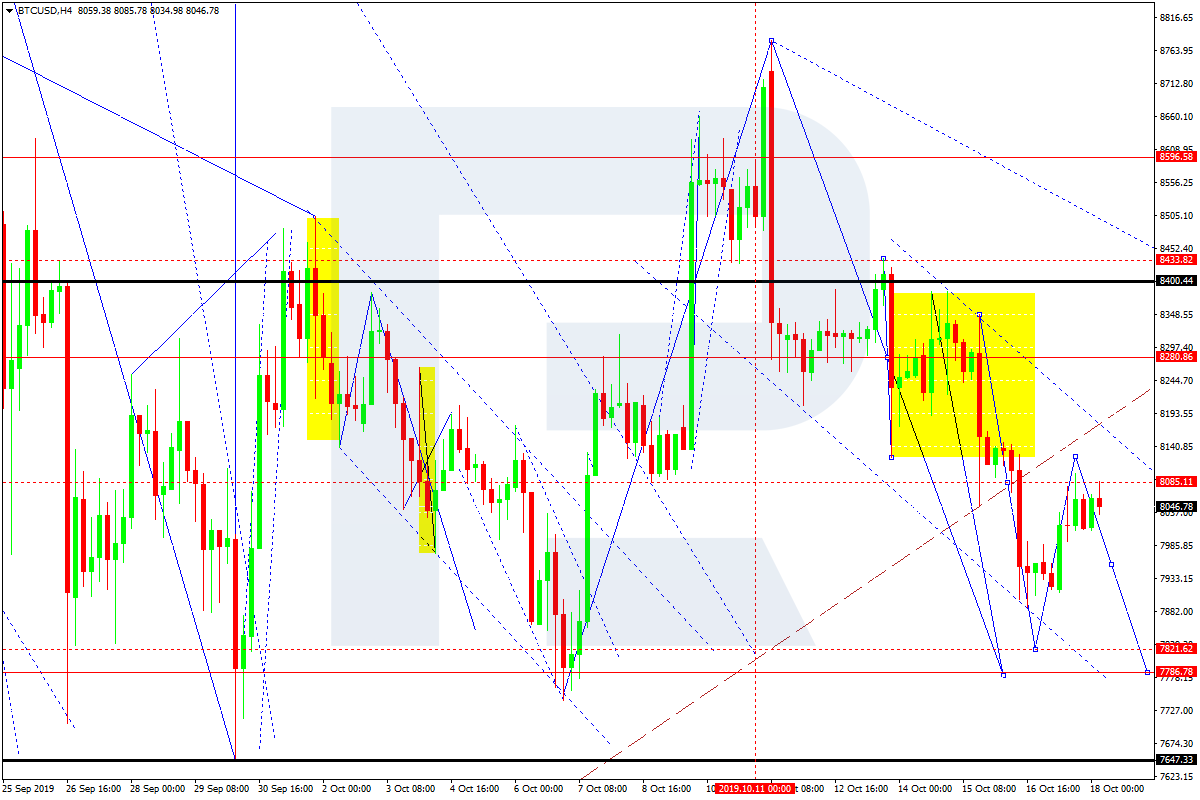
BTCUSD, “Bitcoin vs US Dollar”
BTCUSD has returned to 8085.00. Today, the pair may form a new descending structure to reach 7787.00 and then resume growing towards 8280.00.
Attention! Forecasts presented in this section only reflect the author’s private opinion and should not be considered as guidance for trading. RoboForex LP bears no responsibility for trading results based on trading recommendations described in these analytical reviews.