Author Archive for InvestMacro – Page 135

The Analytical Overview of the Main Currency Pairs on 2019.11.22

by JustForex

The EUR/USD currency pair

Technical indicators of the currency pair:
  • Prev Open: 1.10731
  • Open: 1.10585
  • % chg. over the last day: -0.07
  • Day’s range: 1.10538 – 1.10711
  • 52 wk range: 1.0884 – 1.1623

The EUR/USD currency pair continues to trade flat. There is no defined trend. At the moment, the local support and resistance levels are 1.10550 and 1.10800, respectively. Germany published optimistic data on the country’s GDP for the third quarter. We do not exclude further growth of the trading instrument. Financial market participants continue to monitor the situation around US-China trade negotiations. Today, investors will evaluate a number of important indicators of business activity in Germany and the EU. We recommend opening positions from key levels.

The Economic News Feed for 22.11.2019:

  • – Busines Activity Reports (GER, EU) – 10:30, 11:00 (GMT+2:00);
EUR/USD

Indicators do not give accurate signals: 50 MA crossed 100 MA.

The MACD histogram is in the negative zone, but above the signal line, which gives a weak signal to sell EUR/USD.

The Stochastic Oscillator is in the neutral zone, the %K line crossed the %D line. There are no signals at the moment.

Trading recommendations
  • Support levels: 1.10550, 1.10400, 1.10150
  • Resistance levels: 1.10800, 1.11000, 1.11250

If the price consolidates above the level of 1.10800, expect the quotes to grow toward 1.11000-1.11200.

Alternatively, the quotes could drop toward 1.10200.

The GBP/USD currency pair

Technical indicators of the currency pair:
  • Prev Open: 1.29222
  • Open: 1.29055
  • % chg. over the last day: -0.04
  • Day’s range: 1.29031 – 1.29267
  • 52 wk range: 1.1959 – 1.3385

GBP/USD is still sideways. Unidirectional trends are not observed. Sterling is currently testing a resistance level of 1.29300. 1.28900 is a key support. Investors continue to monitor the situation around Brexit and the upcoming elections in the UK. British opposition leader Jeremy Corbin introduced the Labor Program, which outlines radical plans to transform Britain with higher salaries in the public sector, higher taxes on companies and the rapid nationalization of infrastructure. Open positions from key levels.

At 11:30 (GMT+2:00) a number of indicators on business activity in the UK will be published.

GBP/USD

Indicators do not give accurate signals: 50 MA crossed 100 MA.

The MACD histogram is in the negative zone, but above the signal line, which gives a weak signal to sell GBP/USD.

The Stochastic Oscillator is in the neutral zone, the %K line is above the %D line, which indicates a bullish sentiment.

Trading recommendations
  • Support levels: 1.28900, 1.28650, 1.28350
  • Resistance levels: 1.29300, 1.29700, 1.29850

If the price consolidates above 1.29300, expect the quotes to rise toward 1.29600-1.30000.

Alternatively, the quotes can descend toward 1.28700-1.28500.

The USD/CAD currency pair

Technical indicators of the currency pair:
  • Prev Open: 1.33026
  • Open: 1.32828
  • % chg. over the last day: -0.17
  • Day’s range: 1.32698 – 1.32882
  • 52 wk range: 1.2727 – 1.3664

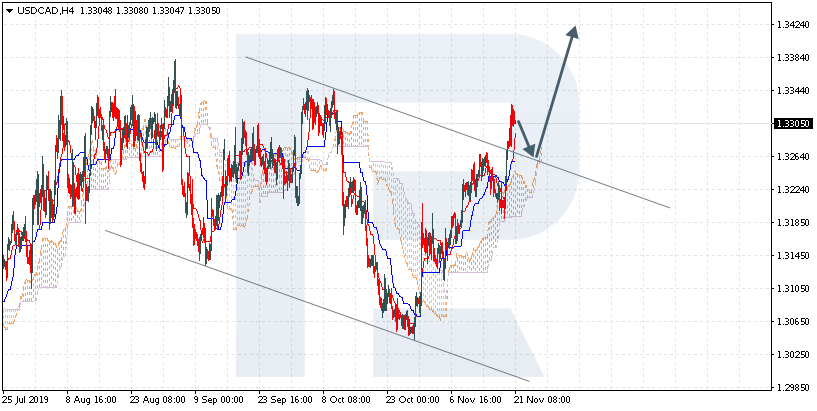
The USD/CAD currency pair went down. CAD updated local lows. At the moment, USD/CAD quotes are consolidating. The local support and resistance levels are 1.32700 and 1.33000, respectively. The Canadian dollar is supported by the positive dynamics of oil quotes. A trading instrument can decline further. We are expecting important economic releases from Canada. Open positions from key levels.

The Economic News Feed for 22.11.2019 is calm.

USD/CAD

Indicators do not give accurate signals: the price has fixed between 50 MA and 100 MA.

The MACD histogram is in the negative zone, but above the signal line, which gives a weak signal to sell USD/CAD.

The Stochastic Oscillator is in the overbought zone, the %K line crossed the %D line. There are no signals at the moment.

Trading recommendations
  • Support levels: 1.32700, 1.32550, 1.32350
  • Resistance levels: 1.33000, 1.33250

If the price consolidates below 1.32700, expect a further drop in the USD/CAD quotes to 1.32500-1.32300.

Alternatively, the quotes could grow toward 1.33200-1.33400.

The USD/JPY currency pair

Technical indicators of the currency pair:
  • Prev Open: 108.580
  • Open: 108.625
  • % chg. over the last day: -0.03
  • Day’s range: 108.570 – 108.709
  • 52 wk range: 104.97 – 114.56

USD/JPY quotes are still in sideways movement. The technical pattern is ambiguous. The trading instrument continues to test local support and resistance levels at 108.450 and 108.700, respectively. Demand for safe haven currencies remains at a fairly high level amid uncertainty in trade negotiations between Washington and Beijing. We recommend you to pay attention to the dynamics of yield on US government bonds. Open positions from key levels.

The Economic News Feed for 22.11.2019 is calm.

USD/JPY

Indicators do not give accurate signals: the price crossed 50 MA and 100 MA.

The MACD histogram has approached the 0 mark. There are no signals at the moment.

The Stochastic Oscillator is in the neutral zone, the %K line is below the %D line, which indicates a bearish sentiment.

Trading recommendations
  • Support levels: 108.450, 108.250, 108.000
  • Resistance levels: 108.700, 108.900, 109.050

If the price consolidates below 108.450, expect the quotes to fall toward 108.000.

Alternatively, the quotes could grow toward 108.900-109.100.

by JustForex

Bulls should be cautious: USD/JPY bears about to take charge

By Admiral Markets

Economic Event

Source: Economic Events November 22, 2019 – Admiral Markets’ Forex Calendar

As we enter the weekly close, we want to focus on the USD/JPY once again. However, we don’t expect to see any big moves from today’s coming economic indications and the resulting elevated volatility.

This will likely not change over the next few days, as Thanksgiving and Black Friday are next week, reducing the chances of risk on/off driven moves in yield and currencies, especially in the JPY.

But recent fundamental developments left us with excitement in regards to the coming weeks, and has made the USD/JPY an exciting currency pair to analyse in our opinion.

With the Fed’s balance sheet expanding at an increasingly faster rate than during QE1, QE2 or QE3, 10-year-US-Treasury yields losing their bullish momentum from the first two weeks of November, and rumours making rounds that the mood in Beijing about a trade deal is rather pessimistic (meaning, tensions between the US and China may be rising again), the USD/JPY bears are probably smelling a kind of advantage in the near-term.

It is speculated that China is getting more and more troubled after repeated signs that no tariff rollback seems to be coming soon (which especially China thought both economies had agreed on in principle), as the strategy switches to “talk only,” and wait due to the recent impeachment developments around Trump.

In fact, this development is not a big surprise to us (as pointed out for example in one of our last weekly market outlooks), but reinforces our sceptical view of the USD/JPY in general.

That said, we still consider the Short-side in the USD/JPY to be more attractive from a risk-reward perspective, and don’t see the recent spikes above 109.00/30 as sustainable, but instead to be potential fake-outs, resulting in the USD/JPY going for another stint to the region around 107.80/108.00.

Still, given our expectation around a subdued volatility outlook, we don’t expect an aggressive attack at the region around 106.80/107.00, at least not for now respectively into the yearly close which would definitely increase chances of a sharper drop from a technical perspective as low as 105.00 and probably even lower:

USDJPY - Daily Chart

Source: Admiral Markets MT5 with MT5-SE Add-on USD/JPY Daily chart (between September 13, 2018, to November 22, 2019). Accessed: November 22, 2019, at 10:00pm GMT – Please note: Past performance is not a reliable indicator of future results, or future performance.

In 2014, the value of the USD/JPY increased by 13.7%, in 2015, it increased by 0.5%, in 2016, it fell by 2.8%, in 2017, it fell by 3.6%, in 2018, it fell by 2.7%, meaning that after five years, it was up by 4.1%.

Discover the world’s #1 multi-asset platform

Admiral Markets offers professional traders the ability to trade with a custom, upgraded version of MetaTrader 5, allowing you to experience trading at a significantly higher, more rewarding level. Experience benefits such as the addition of the Market Heat Map, so you can compare various currency pairs to see which ones might be lucrative investments, access real-time trading data, and so much more. Click the banner below to start your FREE download of MT5 Supreme Edition!

Download MetaTrader 5 and begin trading today!

Disclaimer: The given data provides additional information regarding all analysis, estimates, prognosis, forecasts or other similar assessments or information (hereinafter “Analysis”) published on the website of Admiral Markets. Before making any investment decisions please pay close attention to the following:

  1. This is a marketing communication. The analysis is published for informative purposes only and are in no way to be construed as investment advice or recommendation. It has not been prepared in accordance with legal requirements designed to promote the independence of investment research, and that it is not subject to any prohibition on dealing ahead of the dissemination of investment research.
  2. Any investment decision is made by each client alone whereas Admiral Markets shall not be responsible for any loss or damage arising from any such decision, whether or not based on the Analysis.
  3. Each of the Analysis is prepared by an independent analyst (Jens Klatt, Professional Trader and Analyst, hereinafter “Author”) based on the Author’s personal estimations.
  4. To ensure that the interests of the clients would be protected and objectivity of the Analysis would not be damaged Admiral Markets has established relevant internal procedures for prevention and management of conflicts of interest.
  5. Whilst every reasonable effort is taken to ensure that all sources of the Analysis are reliable and that all information is presented, as much as possible, in an understandable, timely, precise and complete manner, Admiral Markets does not guarantee the accuracy or completeness of any information contained within the Analysis. The presented figures refer that refer to any past performance is not a reliable indicator of future results.
  6. The contents of the Analysis should not be construed as an express or implied promise, guarantee or implication by Admiral Markets that the client shall profit from the strategies therein or that losses in connection therewith may or shall be limited.
  7. Any kind of previous or modeled performance of financial instruments indicated within the Publication should not be construed as an express or implied promise, guarantee or implication by Admiral Markets for any future performance. The value of the financial instrument may both increase and decrease and the preservation of the asset value is not guaranteed.
  8. The projections included in the Analysis may be subject to additional fees, taxes or other charges, depending on the subject of the Publication. The price list applicable to the services provided by Admiral Markets is publicly available from the website of Admiral Markets.
  9. Leveraged products (including contracts for difference) are speculative in nature and may result in losses or profit. Before you start trading, you should make sure that you understand all the risks.

By Admiral Markets

Adaptive Predictive Modeling Suggests Weakness Into 2020

By TheTechnicalTraders.com

Our Adaptive Dynamic Learning (ADL) predictive modeling system is suggesting the Transportation Index will fall to levels near $10,000 over the next 2 to 3 weeks which would indicate moderate price weakness in the US stock market and the global stock market.

Our ADL predictive modeling system attempts to model future price activity by finding and mapping critical price and technical elements within the historical price action.  In a way, this is like mapping the future by attempting to learn from the past. You can get all of my trade ideas by opting into my free market trend signals newsletter.

Weekly Transportation Index Chart #1

This first Weekly Transportation Index chart highlights the ADL predictive modeling results since the end of July 2019.  Notice the CYAN and YELLOW lines drawn on this chart showing what the ADL predictive modeling system suggested would happen over time.  This Technical ADL pattern consisted of SIX historical reference points and suggests the last three weeks’ price levels have a 63 to 84% probability rate.  This would indicate a fairly strong probability that prices will fall as the ADL predicts.

Weekly Transportation Index Chart #2

This second Weekly Transportation Index chart highlights the ADL predictive modeling results from early September 2019.  The results are quite similar across these two charts.  Although the September results highlight a bit more potential price rotation than the earlier July ADL results.

This September ADL predictive modeling chart suggests the TRAN price will fall dramatically to levels below $10,000, then recover a bit.  After that, the price will continue to settle near the $9,700 to $10,000 level throughout the end of 2019.  This downside price move in the Transportation Index suggests the US and Global markets will experience some extended price weakness over the next 3 to 6+ weeks.

The decline in the Transportation Index suggests an overall weakness in the global economy.  If that translates into true price action in the global markets, we could see a series of lower lows set up in the US Stock Market over the next 4 to 6+ weeks.

General price weakness may become a waning anthem for the global stock market headed into the start of 2020.  Take a look at this NQ (Nasdaq) Weekly ADL chart to see what our predictive modeling system is suggesting will happen over the next 60 to 10+ weeks.

If our ADL predictive modeling system is correct, the NQ will fall to price levels near or below $7,700 over the next 2 to 4+ weeks before attempting to settle near $8000 near the end of 2019.  A couple of days ago I shared an interesting article talking about the VIX ready to rocket higher which is linked to this pending decline. As a word of warning, the price can, and often does, move beyond the ADL predictive levels on extended/volatile price swings.  So be prepared for what may happen as price rotates.

As we are nearing the US Thanksgiving holiday weekend, we wanted to alert you to the fact that we’ve created incredible Black Friday membership subscription options for all of our followers to take advantage of.  These special savings rates will run through the end of November – so don’t miss out by joining the Wealth Building Newsletter right now!

Chris Vermeulen – TheTechnicalTraders.com

Ichimoku Cloud Analysis 21.11.2019 (AUDUSD, NZDUSD, USDCAD)

Article By RoboForex.com

AUDUSD, “Australian Dollar vs US Dollar”

AUDUSD is trading at 0.6796; the instrument is moving below Ichimoku Cloud, thus indicating a descending tendency. The markets could indicate that the price may test the cloud’s downside border at 0.6790 and then resume moving downwards to reach 0.6665. Another signal to confirm further descending movement is the price’s rebounding from the resistance level. However, the scenario that implies further decline may be canceled if the price breaks the cloud’s upside border and fixes above 0.6875. In this case, the pair may continue growing towards 0.6965.

AUDUSD
Risk Warning: the result of previous trading operations do not guarantee the same results in the future

NZDUSD, “New Zealand Dollar vs US Dollar”

NZDUSD is trading at 0.6415; the instrument is moving above Ichimoku Cloud, thus indicating an ascending tendency. The markets could indicate that the price may test the cloud’s upside border at 0.6405 and then resume moving upwards to reach 0.6585. Another signal to confirm further ascending movement is the price’s rebounding from the rising channel’s downside border. However, the scenario that implies further growth may be canceled if the price breaks the cloud’s downside border and fixes below 0.6330. In this case, the pair may continue falling towards 0.6235.

NZDUSD
Risk Warning: the result of previous trading operations do not guarantee the same results in the future

USDCAD, “US Dollar vs Canadian Dollar”

USDCAD is trading at 1.3305; the instrument is moving above Ichimoku Cloud, thus indicating an ascending tendency. The markets could indicate that the price may test the cloud’s upside border at 1.3265 and then resume moving upwards to reach 1.3425. Another signal to confirm further ascending movement is the price’s rebounding from the descending channel’s upside border. However, the scenario that implies further growth may be canceled if the price breaks the cloud’s downside border and fixes below 1.3185. In this case, the pair may continue falling towards 1.3105.

USDCAD

Article By RoboForex.com

Attention!
Forecasts presented in this section only reflect the author’s private opinion and should not be considered as guidance for trading. RoboForex LP bears no responsibility for trading results based on trading recommendations described in these analytical reviews.

Murrey Math Lines 21.11.2019 (USDCHF, GOLD)

Article By RoboForex.com

USDCHF, “US Dollar vs Swiss Franc”

As we can see in the H4 chart, USDCHF is still consolidating. In this case, the price is expected to break 4/8 and then continue falling to reach the support at 3/8. However, this scenario may no longer be valid if the price breaks 5/8 to the upside. After that, the instrument may continue growing towards the resistance at 6/8.

USDCHF_H4
Risk Warning: the result of previous trading operations do not guarantee the same results in the future

In the M15 chart, the pair may break the downside line of the VoltyChannel indicator once again and, as a result, continue trading downwards to reach 3/8 from the H4 chart.

USDCHF_M15
Risk Warning: the result of previous trading operations do not guarantee the same results in the future

XAUUSD, “Gold vs US Dollar”

As we can see in the H4 chart, XAUUSD is moving between 6/8 and 7/8. In this case, the price may resume trading downwards, break 6/8, and then continue its decline towards the support at 4/8. However, this scenario may no longer be valid if the price breaks 7/8 to the upside. After that, the instrument may continue growing towards the resistance at 8/8.

GOLD_H4
Risk Warning: the result of previous trading operations do not guarantee the same results in the future

In the M15 chart, the pair may break the downside line of the VoltyChannel indicator again and, as a result, continue trading downwards.

GOLD_M15

Article By RoboForex.com

Attention!
Forecasts presented in this section only reflect the author’s private opinion and should not be considered as guidance for trading. RoboForex LP bears no responsibility for trading results based on trading recommendations described in these analytical reviews.

Three reasons why UK Labour party manifesto will bring economic chaos

By George Prior

Jeremy Corbyn’s Labour party’s radical Marxist manifesto will bring far-reaching economic chaos for Brexit-battered Britain, affirms the boss of one of the world’s largest independent financial advisory organizations.

The founder and CEO of deVere Group, Nigel Green, is speaking out as the opposition Labour leader unveils his party’s manifesto on Thursday ahead of next month’s UK general election.

Mr Green says: “Labour’s Marxist manifesto is the most radical and dangerous in decades.

“It would bring far-reaching economic chaos for a Brexit-battered Britain already on the brink.

“Corbyn and McDonnell’s agenda would create a nightmarish scenario that would hit those very people the most that it is proclaiming to try and support and protect.”

He continues: “There are three fundamental reasons why the Corbyn-led Labour manifesto would damage the UK economy.

“First, it would drive down already stagnate business investment in the UK.

“The mammoth nationalization programme will leave companies thinking ‘who’s next?’ Plus, the snatching of 10 per cent of the shares in every big company and a significant increase in trade union power, including a return to collective bargaining, will leave UK and international investors justifiably concerned that their investments will not be safe under Labour.

“This will seriously erode any attempts to generate long-term, sustainable economic growth.”

Mr Green goes on to say: “Second, it would trigger an exodus of some of the most successful and wealthiest individuals.

“This would likely be due to concerns regarding Labour’s stance on inheritance tax, income tax, stamp duty and capital gains tax, potentially even capital controls, and the slashing of pensions tax relief.

“Typically, these people have the resources to move to safe lower tax jurisdictions if the tax burden in Britain becomes too great.

“Should these largely job and wealth-creating, tax-paying individuals quit Britain, the government’s finances will suffer significantly because they contribute a disproportionately large amount to the state’s coffers. Indeed, they prop-up the system.

“And third, a renegotiation of the Brexit deal, which would be put to a second referendum, would create many more months of uncertainty for businesses.”

The deVere CEO concludes: “Labour’s economic agenda is a risky gamble. Its potential for serious adverse consequences is massive.

“And whilst the radical plans are already far-reaching, this might be just the beginning, with more misguided policies to come.”

About:

deVere Group is one of the world’s largest independent advisors of specialist global financial solutions to international, local mass affluent, and high-net-worth clients.  It has a network of more than 70 offices across the world, over 80,000 clients and $12bn under advisement


The Analytical Overview of the Main Currency Pairs on 2019.11.21

by JustForex

The EUR/USD currency pair

Technical indicators of the currency pair:
  • Prev Open: 1.10774
  • Open: 1.10731
  • % chg. over the last day: -0.01
  • Day’s range: 1.10724 – 1.10794
  • 52 wk range: 1.0884 – 1.1623

Major currency pairs have stabilized. Investors expect additional drivers. According to the FOMC minutes, the Fed will not need to further reduce its key interest rate unless significant changes in the economy occur. Recall that in the current year, the regulator lowered its key interest rate three times. At the moment, the indicator is at the level of 1.50% -1.75%. Doubts about the settlement of the trade conflict between Washington and Beijing intensified amid the tense situation in Hong Kong. We recommend you to keep track of current information on this issue. Today, financial market participants will evaluate a number of important economic releases. Currently, EUR/USD quotes are consolidating in the range of 1.10650-1.10850. Positions must be opened from these marks.

The Economic News Feed for 21.11.2019:

  • – ECB Monetary Policy Meeting Minutes (EU) – 14:30 (GMT+2:00);
  • – Initial Jobless Claims (US) – 15:30 (GMT+2:00);
  • – Manufacturing PMI from Philadelphia’s Fed (US) – 15:30 (GMT+2:00);
  • – Secondary Real-Estate Sales Report (US) – 17:00 (GMT+2:00);
EUR/USD

Indicators do not provide accurate signals, the price crossed 50 MA.

The MACD histogram is close to 0.

The Stochastic Oscillator is in the neutral zone, hte %K line is below the %D line which points to a bearish sentiment.

Trading recommendations
  • Support levels: 1.10650, 1.10550, 1.10400
  • Resistance levels: 1.10850, 1.11000, 1.11250

If the price consolidates above 1,10850, expect further growth toward 1.11200-1.11400.

Alternatively, the quotes could descend toward 1.10400-1.10200.

The GBP/USD currency pair

Technical indicators of the currency pair:
  • Prev Open: 1.29241
  • Open: 1.29222
  • % chg. over the last day: -0.01
  • Day’s range: 1.29103 – 1.29325
  • 52 wk range: 1.1959 – 1.3385

An ambiguous technical pattern has developed on the GBP/USD currency pair. Sterling is currently consolidating. GBP / USD quotes test the resistance level of 1.29300. 1.28900 is a key support. Market participants expect up-to-date information regarding the Brexit process. Today, investors will evaluate important statistics on the US economy. Open positions from key levels.

The Economic News Feed for 21.11.2019 is calm.

GBP/USD

Indicators do not give accurate signals: 50 MA crossed 100 MA.

The MACD histogram has moved into the positive zone, which indicates the development of bullish sentiment.

The Stochastic Oscillator is in the neutral zone, the %K line is below the %D line, which gives a signal to sell GBP / USD.

Trading recommendations
  • Support levels: 1.28900, 1.28650, 1.28350
  • Resistance levels: 1.29300, 1.29700, 1.29850

If the price consolidates above 1.29300, expect the quotes to rise toward 1.29600-1.30000.

Alternatively, the quotes can descend toward 1.28700-1.28500.

The USD/CAD currency pair

Technical indicators of the currency pair:
  • Prev Open: 1.32663
  • Open: 1.33026
  • % chg. over the last day: +0.27
  • Day’s range: 1.33017 – 1.33220
  • 52 wk range: 1.2727 – 1.3664

The USD/CAD currency pair has stabilized after a sharp rally since the beginning of this week. Looney is currently consolidating. Unidirectional trends are not observed. The local support and resistance levels are: 1.33000 and 1.33250, respectively. In the near future, technical correction of the trading instrument is not ruled out. Today we recommend you to pay attention to the news background on the US economy, as well as the dynamics of prices of black gold. Open positions from key levels.

At 15:40 (GMT + 2: 00) a speech will be held by the head of the Bank of Canada.

USD/CAD

The price fixed above 50 MA and 100 MA, which signals the strength of buyers.

The MACD histogram is in the positive zone, but below the signal line, which gives a weak signal to buy USD/CAD.

The Stochastic Oscillator is in the neutral zone, the %K line crossed the %D line. There are no signals at the moment.

Trading recommendations
  • Support levels: 1.33000, 1.32800, 1.32550
  • Resistance levels: 1.33250, 1.33500

If the price consolidates above 1.33250, expect further growth toward 1.33500-1.33700.

Alternatively, the quotes could descend toward 1.32800-1.32600.

The USD/JPY currency pair

Technical indicators of the currency pair:
  • Prev Open: 108.539
  • Open: 108.580
  • % chg. over the last day: -0.06
  • Day’s range: 108.278 – 108.671
  • 52 wk range: 104.97 – 114.56

The technical picture on the USD/JPY currency pair is still ambiguous. The trading instrument continues to consolidate. There is no defined trend. At the moment, the following local support and resistance levels can be distinguished: 108.450 and 108.700. Demand for “safe haven” currencies remains at a fairly high level. Today we expect the release of important economic reports from the United States. Open positions from key levels.

The Economic News Feed for 21.11.2019 is calm.

USD/JPY

Indicators do not give accurate signals: the price crossed 50 MA and 100 MA.

The MACD histogram is close to 0.

The Stochastic Oscillator is in the overbought zone, the% K line crossed the% D line. There are no signals at the moment.

Trading recommendations
  • Support levels: 108.450, 108.250, 108.000
  • Resistance levels: 108.700, 108.900, 109.050

If the price consolidates below 108.450, expect the quotes to fall toward

Alternatively, the quotes could grow toward 108.900-109.100.

by JustForex

Concerns Over the Settlement of the Trade Conflict Are Growing. Investors Assess the FOMC Meeting Minutes

by JustForex

The US dollar is being traded stably against major competitors. Yesterday, the dollar index (#DX) closed the trading session with a slight increase (+0.06%). According to the FOMC meeting minutes, if there are no significant changes in the economy, further reduction of the Fed key interest rate will not be required. It should be recalled that this year the Central Bank lowered its key interest rate three times. At the moment, the indicator is at the level of 1.50%-1.75%.

Investors are worried that the conclusion of a phase one trade agreement between Washington and Beijing may be postponed to next year amid growing disagreements. The US House of Representatives has approved a bill aimed at supporting protesters in Hong Kong. In turn, Beijing criticized these legislative measures, promising to retaliate. These events support the demand for safe haven currencies. Today, investors will assess some important economic releases from the Eurozone and the United States.

The “black gold” prices are consolidating. Currently, futures for the WTI crude oil are testing the $56.85 mark per barrel.

Market Indicators

Yesterday, sales prevailed in the US stock markets: #SPY (-0.37%), #DIA (-0.40%), #QQQ (-0.60%).

The 10-year US government bonds yield has moved away from local lows. At the moment, the indicator is at the level of 1.75-1.76%.

The Economic News Feed for 21.11.2019:
  • – Publication of the ECB monetary policy meeting account at 14:30 (GMT+2:00);
  • – Initial jobless claims in the US at 15:30 (GMT+2:00);
  • – Philadelphia Fed manufacturing index at 15:30 (GMT+2:00);
  • – Existing home sales in the US at 17:00 (GMT+2:00).

by JustForex

The Worst Is Over For Oil Markets

By OilPrice.com

Some analysts see the world dodging a recession next year, which provides some upward room for oil prices.

Last week, the IEA warned last week that “the hefty supply cushion” building up in the first half of 2020 will cause OPEC+ problems as the group tries to balance the oil market. Part of the reason for another potential surplus is the steep drop in demand growth this year, forcing oil forecasters to make multiple downward revisions to their projections.

“With consumption growth of just 830 thousand b/d YoY in 2019, global oil demand has easily expanded at the lowest rate since the global financial crisis 10 years ago,” Bank of America Merrill Lynch said in a note.

The slowdown was particularly concentrated in industrial sectors, which have been hit hard by the trade war. “The manufacturing downturn in 2019 has been so pronounced that we think it could aptly be labeled as the third global industrial recession in the past 10 years, following the activity drops witnessed in 2012 and 2016,” the bank said.

Or, put more succinctly, “The world has just lived through an industrial recession,” Bank of America concluded, and oil prices really only held up because of massive supply outages in 2019. The industrial slowdown spread around the world.

Take India, for example. The “weak picture for the manufacturing and industrial” sectors of the Indian economy continue, JBC Energy said in a note on Monday, which have hit diesel sales. “The 120,000 b/d (7%) y-o-y contraction was greater than even the demonetization-driven downside from January 2017,” JBC Energy said. “With bitumen sales also low, it appears activity in Indian manufacturing and construction is waning.”

But there are some reasons to think that things could turn around. While a lot still depends on the outcome of the U.S.-China trade war and the “partial deal” that the market still believes is likely, recent streams of data have tamped down fears of a recession. “Looking into 2020, we expect an improvement in cyclical demand conditions as manufacturing PMIs seem to have stabilized and in some cases appear to be turning positive,” Bank of America said.

Part of the reason for more optimism is that corporations with global supply chains have held back on purchases over the past year, in large part because of the trade war, and have whittled away at inventory.

The strategy seemed to be an attempt to wait out tariffs in the hopes of a negotiated breakthrough. That makes sense at the individual company level, but it hit manufacturers hard as sales and activity dropped. However, companies will now have to restock in 2020, Bank of America says. That could help steady the economy.

Meanwhile, if the U.S. and China can indeed agree to a partial trade deal, that would “further help boost industrial activity and confidence in the global economy,” Bank of America said, and “any signs of improvement on the trade front could add upward pressure to cyclical energy and metals prices.” The removal of some tariffs could both push down the dollar and raise commodity prices.

Still, a comprehensive breakthrough in the trade war is going to be extremely difficult, and the two sides have been far apart on the big issues. The partial deal, such as it is, would only suspend tariffs in exchange for China buying large sums of agricultural goods.

But even the partial deal has run into trouble. The Trump administration has hyped a $50 billion purchase from China for U.S. agricultural goods, a figure that some say is “not possible.” So, it’s worth noting that even a very narrow and modest agreement has become a challenging prospect, to say nothing of more structural differences between the two countries.

In short, while the tone has softened and both sides have signaled that negotiations are proceeding to a conclusion, the U.S.-China trade war is far from finished.

In fact, right on cue, doubts began to resurface on Monday. CNBC said that the “mood in Beijing about a trade deal is pessimistic due to U.S. President Donald Trump’s reluctance to roll back tariffs.” Beijing may instead decide to sit and wait, betting that Trump’s standing continues to deteriorate in the face of an impeachment inquiry.

“It looks like this is by no means a done deal,” Matthew Miskin, a market strategist

Link to article: https://oilprice.com/Energy/Energy-General/The-Worst-Is-Over-For-Oil-Markets.html

By Nick Cunningham of Oilprice.com

China’s Growth Outlook Beyond 2020

By Dan Steinbock

Despite US tariff wars, Chinese economic prospects remain in line with 2019 expectations and are likely to prevail in 2020, due to deleveraging and structural reforms.

A year ago, I projected that in 2019 Chinese GDP growth could achieve 6.2% in full-year growth, if policymakers can sustain higher-quality growth while suppressing debt accumulation. This scenario has proven pretty valid so far.

Recent international headlines have projected “sub-6% growth” in 2020 China, assuming weakened consumption, cautious private investment and shrinking exports. Such projections have been reported as a negative turn. In reality, Chinese growth deceleration is in line with long-term expectations. Even half a decade ago, the International Monetary Fund expected China’s annual growth to be 6.1-6.2 by 2020. The minor deviation can be attributed to US tariff wars.

In 2020, the final figure may more likely to hover around 5.8-6 percent, though.

Most economic projections focus on growth prospects in 2020. But let’s go beyond the short-term to see how the 2020 economic prospects are likely to support China’s more vital medium- and long-term objectives– deleveraging and structural reforms in 2020-2024 and rebalancing until 2030.

Decelerating growth, but rising incomes

If Chinese government would ignore its commitment to poverty eradication, higher living standards and sustainability, it could achieve more rapid growth, but at the cost of people’s livelihood, living standards and environment. Policymakers cannot accept too much deceleration either. The effort to double living standards – as measured by GDP per capita, with purchasing power parity – between 2010 and 2020 requires growth at about 6.1% in 2019-2020.

Assuming peaceful international conditions and managed trade wars, Chinese growth may decelerate from the 2007 peak of 14.3% to 5.5% by 2024.

In the 2000s, Chinese growth accelerated, while living standards almost doubled. In the 2010s, Chinese growth decelerated, but living standards doubled again. And if things go right, these standards could increase by another half in the mid-2020s.

In contrast, US living standards increased by only 6% in the 2000s and 14% in the 2010s, while growth has halved from 3-4% to 1-2%. In the largest EU-4 economies – as proxied by the average of the UK, Germany, France and Italy – growth declined even more from 3% to barely 1%, whereas living standards increased by 4% in the 2000s and 8% in the 2010s. In Japan, living standards barely grew in the 2000s, but rose by 10% in the 2010s (Figure).

Figure Economic Growth and Per Capita Incomes, 2000-E2024*

EU-4: Averaged growth and per capita incomes in Germany, UK, France and Italy

Growth rate: GDP constant prices, percent change

Per capita income: GDP per capita, constant prices (PPP); 2011 international dollar

Source: IMF/WEO Database; Difference Group

Here’s the inconvenient truth: In China, the Communist Party continues to foster the expansion of middle group consumers. In contrast, US middle classes have stagnated since the 1970s, European middle classes are shrinking and their Japanese peers seek to avoid a fall into a poverty trap.

Deleveraging and structural reforms

In the Reagan era, US growth was sustained by soaring trade deficits and debt-taking. During the Trump rule, the White House has fostered growth with huge one-time tax cuts, tariff wars and drastic debt expansion. US public debt now exceeds $23 trillion (107% of the GDP). Except for Germany, the debt-to-GDP ratio is also high in the largest EU economies, such as the UK (99%), France (109%), and Italy (143%) – and far worse in Japan (264%).

These major economies in the advanced West have all benefited from ultra-low interest rates, while engaging in rounds of quantitative easing. Second, none of them are engaging in substantial structural reforms. Third, due to their unsustainable growth, maturing economies, aging populations and declining growth potential, they all are on a path to secular stagnation.

In China, the central government has used fiscal support and monetary easing to defuse the collateral damage associated with U.S. protectionism. So public debt has increased (64% of GDP). But unlike all major Western economies, China continues to deleverage. Indeed, financial deleveraging and reduced interconnectedness between banks and non-banks have contained the rise of financial risks, although vulnerabilities remain. And China is also engaging in broad structural reforms, even amid the US tariff wars. And unlike Western economies, China still has significant long-term growth potential.

Since the Chinese growth continues to shift away from investment and net exports toward consumption and innovation, the corrosive impact of protectionism will be reduced over time. In turn, rebalancing continues, as evidenced by record retail sales records during the October Golden Week, China International Import Expo (CIIE) and Alibaba’s Single’s Day.

Investors have made note. China may prove the world’s best-performing major stock market in 2019, with the benchmark CSI 300 index up by a third this year. By November, bourses in Shanghai and Shenzhen had added $1.4 trillion in market capitalization, raising the total onshore equities to $6.8 trillion this year. Meanwhile, almost half of fixed income institutional investors outside China plan to increase their exposure to China-issued debt in the coming year, according to FinanceAsia.

Three probable trade war scenarios

Despite periods of optimism, trade talk between Washington and Beijing remain inconclusive. While negotiations on the “Phase 1 trade deal” focus on agriculture, additional core disputes remain unsolved, including disagreements on intellectual property and technology, and financial market accessibility.

The US tariff wars are likely to hinge on three probable scenarios. In the Managed Trade War scenario, the two sides agree on Phase 1 deal and a realistic long-term negotiation trajectory on broader core disputes. The scenario would boost global economic prospects, by fostering investor and consumer confidence worldwide.

In the Technology War scenario, the two sides would agree on some sort of a Phase 1 deal, but not on a long-term negotiation trajectory. A brief trade truce would be only a prelude for a longer-term trade war in which the White House would evoke “national security reasons” to exploit anti-competitive instruments to undermine Chinese 5G success and Huawei’s expansion. This scenario would result in downgraded outlooks in all major economies

In the third Hybrid War scenario, a Phase 1 deal would be undermined, while long-term negotiation trajectory would not be achieved. Tariffs and protectionism would to foreign investment and the global value chains of multinational corporations. In this scenario, global consequences would prove the worst as the US would resort to economic, political, military and covert means to contain China’s economic rise and China would have to respond.

Guided by US trade policy mistakes – the worst in the postwar era- the global economy is now amid a “synchronized slowdown,” as the IMF has warned. But there is much worse ahead without the Managed Trade War scenario.

About the Author:

Dr. Dan Steinbock is an internationally recognized strategist of the multipolar world and the founder of Difference Group. He has served at India, China and America Institute (US), Shanghai Institutes for International Studies (China) and the EU Center (Singapore). For more, see https://www.differencegroup.net/   

The original commentary was released by China Daily on November 20, 2019.