The US dollar is being traded without changes against a basket of major currencies. The dollar index (#DX) closed yesterday in the red zone (-0.21%). The United States published mixed economic data. Thus, the index of economic activity in the manufacturing sector fell to 52.5 in December, while experts forecasted a value of 52.6. Markit composite PMI rose from 52.0 to 52.2 in December.
Yesterday, the British pound fell against the US dollar after the news that British Prime Minister Boris Johnson considered a new bill on the transitional period after Britain’s exit from the EU and planned a new Brexit term. Johnson’s revised bill will require Britain to take steps to exit the European Union by December 31 of next year. At the same time, the Prime Minister’s administration said that US President Donald Trump and Boris Johnson had discussed an “ambitious free trade agreement” during a telephone conversation.
The “black gold” prices are changing slightly. Currently, futures for the WTI crude oil are testing $60.10 mark per barrel.
Market Indicators
Yesterday, there was the bullish sentiment in the US stock market: #SPY (+0.69%), #DIA (+0.34%), #QQQ (+1.00%).
The 10-year US government bond yield has increased slightly. At the moment, the indicator is at the level of 1.86-1.87%.
The Economic News Feed for 17.12.2019:
– UK labor market data at 11:30 (GMT+2:00);
– Statistics on the real estate market in the US at 15:30 (GMT+2:00);
– JOLTS job openings in the US at 17:00 (GMT+2:00).
We also recommend paying attention to the speech by the Bank of England Governor Carney.
Euphoria is a type of market rally where valuations, real market expectations, and global market concerns are pushed away from view while a trader based rush to rally takes place. One of the clearest examples is the 1995 to 2000 DOT COM US stock market rally. As the Internet burst into homes and businesses across the world, the US-led the way with dozens of new Internet-based IPOs touting glorious expectations, potential earnings and more. Everyone had the idea this new medium would dramatically change the economy for the better and breakthrough traditional economic boundaries.
The rally that took place in 1995 through 2000 was incredible. The S&P 500 rallied from 463 to 1535 – +235.57%. What we find interesting is the “price wave formation” that took place within that rally. There were a number of key price rotations that took place as the market continued to rally, we’ve labeled them A, B, and C. The first rotation, A, took place in July~Dec 1997. The second, B, took place from May 1998 to November 1998. The last, C, took place between January 1999 and November 1999. Technically, these rotations are significant because they represent “true price exploration” related to price advancement. The price must always attempt to identify true support/resistance levels while trending.
When we compare the rally from 1995 to 2000 with the current rally in the US stock market, we can see a defined level of euphoric price advance after the 2016 US elections. We must also pay attention to the previous price advance from the 2009 price lows as the global markets were struggling to recover from the Credit Crisis. Our research team identified the A, B, C rotations in the current price and associated them to the similar rotations in the 1995-2000 price rally as “key components of the current rally and a potential warning sign of a pending top formation”.
Our researchers believe the QE processes of the global central banks have set up a similar type of euphoric price rally in the current global markets even though current economic metrics are warning of weakening economic activity and weakening global market output. The US Fed and global central banks seem to want to keep pumping money/credit into the global markets to keep the rally going – most likely because they are fearful of what a crash/correction may do to the future growth opportunities around the planet.
Yet, our research team focused on the C rotation in 1999 and 2019 – a full 20 years apart. What interested our research team the most was the fact that the rotation in 1999 set up a full 21 months before the November 2000 US Presidential election. The current C rotation initiated in January 2018 – a full 34 months before the November 2020 US Presidential Elections. Anyone paying any attention will recognize the 21 and 34 are both Fibonacci Numbers – relating a 1.619 ratio advancement.
Are we setting up a massive top in the US stock market based on a Fibonacci price range expansion related to the patterns we have identified in this SP500 chart? Have we advanced from the 2000 peak and 2009 bottom in some form of Fibonacci Ratio expansion that aligns with the C rotation pattern we have identified?
The rally from Bill Clinton’s second term start date to the peak in 2000 totaled 932.9 pts – +153.61%. the rally from Donald Trump’s first term start date to our projected peak level totals 997.5 pts – +44.38%. The rally in 2000 peaked at a range that is 200% larger than the ration between the two separate percentage point ranges. Is this significant to traders? Does it help to align our peak with the 1.619 Fibonacci ratio?
153.61 / 44.38 = 3.4612
3.4612 / 2 = 1.7306
Given the alignment of these values with a potential 200% range expansion theory, we need to start to look at TIME/PRICE ratios to determine if these rallies are aligned efficiently.
The rally from 1995 to the peak in 2000 consisted of 63 Months. The rally from 2009 to our projected peak consists of 131 bars. This represents a price TIME expansion of 207.9%
The rally from 1995 to the peak in 2000 consisted of a price move of +1081.2 pts (+235.57%). The rally from 2009 to our projected peak consists of a price move of 2585.6 pts (390.49%). The ratio between these two price expansions is 1.657.
The correction from the peak in 2000 to the low in 2009 consisted of 109 months. The ratio between the 63 months (1995~2000 peak) to this correction time is 1.73. The ration of the 2009~2019 rally time span is 1.20. Thus, the correction between the peak in 2000 to the bottom in 2009 expanded at a rate of 1.73x the time it took to complete the DOT COM rally from 1995 to 2000. The recovery that has taken place from the 2009 bottom to our projected top in 2019 would expand at a rate of 1.20x the correction time rate. All of these levels align with common Fibonacci numbers and ratios.
In other words, we believe the current expansion in price is nearing a completed Elliot Wave/Fibonacci ratio peak (likely wave C) that maintains proper aspect ratios related to previous major price rotations.
Our Custom Volatility Index shows extended volatility is increasing with price nearing the upper range for December 2019. Notice the increase in the range of these bars since the just before the peak in January 2018. This increased range suggests extreme price volatility has been pushing the markets for the past 24+ months. If this volatility continues into early 2020 as our projected peak sets up, we may see some very big rotation in 2020.
2000 and 2019 Price Similarities in S&P 500
This 2000 peak to 2019 peak comparison chart highlights the similarities in the C price pattern that has setup. In 1999, the C pattern set up with an initial peak, followed by minor downside rotation – just like in January 2018. The second peak was higher, followed by a much deeper downside price rotation – just like in Nov/Dec 2018. And the final rally broke upward after a Pennant/Flag formation pushing higher by +25% in 2000. The current upside breakout from the December 2018 lows suggests a 39.5% price peak – just above our predicted 32% scaled Fibonacci rally expectation.
Fibonacci Price Amplitude Top Level Is Not Much Higher
The total scope of this price move over the past 40+ years is impressive. These longer-term patterns still drive the markets to establish major peaks and valleys. Take a look at this chart and try to understand the ratios that are being presented here. 21%, 34%, 50%, 62%, 100% and any combination of these levels using 2x, 3x or any multiplier constitute a Fibonacci structure. One of the most important facets of attempting to understand the Fibonacci price theory is that the ratios must be somewhat aligned.
Pay attention to the Fibonacci Price Amplitude arcs (the circles) drawn on this chart. They represent the price range from the peak in 2000 to the low in 2009. The reason this range is important to our researchers is that it will properly measure the previous upward price rally and the current price rally in terms of price amplitude. Pay attention to how the current price rally stalled and rotated near these arcs. We believe the upper GREEN arc level will operate as major resistance for the markets – possibly setting up another “rollover” type of top similar to the one in 1999~2000.
Skilled technical traders still need to be cautious headed into 2020. The current rally, and most of 2018 and 2019, have been setting up a very serious type of pre-top setup. Any downside rotation in early 2020 may attempt to move lower in multiple waves – possibly spanning multiple years.
Currently, our research suggests a limited 2.5% upside price range before the SP500 will reach the GREEN resistance arc. The US markets may reach this level before the end of 2019 and may begin a topping pattern before you finish reading this article. Please stay informed and understand the structures, trends, and dynamics that are at play in these markets to attempt to reduce your risk. Now is the time to trim your equity/stock positions and prepare for a much bigger swing in price/volatility.
As a technical analysis and trader since 1997, I have been through a few bull/bear market cycles. I believe I have a good pulse on the market and timing key turning points for both short-term swing trading and long-term investment capital. The opportunities are massive/life-changing if handled properly.
We’ll keep you informed as this plays out with Wealth Building & Global Financial Reset Newsletter if you like what I offer, join me with the 1 or 2-year subscription to lock in the lowest rate possible and ride my coattails as I navigate these financial market and build wealth while others lose nearly everything they own during the next financial crisis. Join Now and Get a Free 1oz Silver Round or Gold Bar Shipped To You!
Regardless of why you to move things across the border, here are three methods of international shipping discussed in more detail.
In this article we’ll try to help you to understand some aspects of international shipping – how to choose the right transport company and share some tips on how to save you money.
If you want to send your shipment abroad, you have several options. Aircraft, trains, boats, and cars can be used to transport cargo between countries. However, different mailing methods are suitable for different situations.
How Do I Ship Internationally? (Methods Of Transportation)
There are many ways to deliver your goods around the world. Road or rail delivery is often the best option for delivery to neighboring countries, but what to do if you need to import or export from other locations.
Courier services
These are probably the services you’ll be best acquainted with. If you send a small quantity, you will probably use a courier service. (Personal belongings and gifts are examples of situations where a courier service may be preferable.)
Airfreight – traditional air freight is a way of quickly transporting goods around the world. By loading it on a plane and sending it to another country.
Shipping – Shipping is often the cheapest way to transport your goods globally. However, it takes a lot more time to reach its destination.
Which Method Should I Use?
Here are a few considerations:
Price
Many people are just looking for the cheapest way to send packages abroad. If you can be flexible, with regards to factors, such as delivery time, you can save much money as the cost of air freight/courier services can be 4 times higher than the cost of shipping a relatively large package of goods.
Size of goods
For all types of overseas transportation, the size largely determines the price.
Parcels, more than a specific size, will make courier services and air transportation much more expensive. Whereas, parcels of a smaller size (about 100 kg and 0.5 cubic meters) are meaningless to go through the hassle of sea transportation.
How fast you need the goods
The big difference between these international shipping services is the time of delivery. Shipping from China can take 6-7 weeks, while some courier services can around three days!
How simple you want this process to be
There are many differences in the services offered by these different methods.
Courier services are easy to use and deliver goods directly to your front door.
Sea and air freight can be more straightforward, although you need to be sure that the company that controls your shipment, knows precisly what is required to clear your shipment and deliver it quickly and efficiently.
Air Freight vs. Sea Freight vs. Courier Services
Here is a simple guide to selecting the most appropriate option for your needs:
As a general rule, anything weighing less than 100 kg (e.g., personal goods) is usually worth using a courier service. If you are importing or exporting a large number of small and expensive items, such as tablets or luxury watches, it is usually more appropriate to use air freight services.
Sea freight offers great savings, but whether sea freight is generally more advantageous for larger shipments or not is up to you and your budget. The cost of sea freight is often cheaper and remains the same for up to 25 boxes. Sea freight is generally more economical for larger volumes.
Although we have already given you a brief overview of what a courier is, let us go a little deeper.
A courier is the best way to imitate the typical experience of international delivery – the use of a courier is an international delivery service.
The courier is responsible for the door-to-door process. Much like receiving regular mail, couriers allow you to deliver your goods directly to your door.
This method is more straightforward than other international shipping methods. The courier will pick up the parcel and deliver it, as well as contact the appropriate person to pay any duties or taxes.
Pros and Cons Of Couriers
To help you decide whether an international parcel courier service is an international parcel service, we have listed the pros and cons of using it.
Pros:
Easy to use.
Very fast. Couriers are the fastest way to deliver parcels worldwide.
Once-off costs and a few unexpected fees. The problem with shipping goods by freight is that, in addition to the original cost, you can get a bill full of unforeseen expenses that may be more than the value of the cargo itself. Courier services usually do not have any hidden costs.
Cons:
Compared to freight, couriers are much more expensive. That is not a problem if you ship a box or two of small personal items. However, if you export large quantities of goods then courier it then the cheapest option for shipments up to 100 kg.
Saving money when your shipping goods are not applicable unless you buy in bulk and the service offered with freight is normally business-oriented, not customer-oriented.
Your products are loaded into the aircraft and delivered to you or your customers. Naturally, this is a much quicker process than shipping by sea, but there are much less space and weight allowances on the plane.
As a result, the cost of air transportation is calculated differently (moving a kilogram by air is much more than by sea), so often sea freight can be the cheaper option when it comes to bulky items.
How Are Air Freight Charges Calculated?
Airline rates are based on either the actual gross weight or the volume weight of the cargo, whichever is higher.
That is because some items take up more space on board than their actual weight.
Should I Use Air Or Sea Freight?
That is one of our FAQs! If you want to get a detailed answer about whether to choose sea or air transport, look at the overview below.
When choosing between air and sea transport, the following three main points should be taken into account:
Price
Size
Delivery time
Sea transportation is usually 4-6 times cheaper than air transportation. If you are interested in reducing costs, sea freight will be of interest to you.
When looking at the different expenses, for sea transportation of cargo, one cubic meter is equal to 1000 kg, whereas, on air transportation, six cubic meters is equal to 1000 kg.
If you increase the weight of your cargo during transportation by sea, the probability that the price will increase is not high. If you import heavier load by air, the difference in price between the two options will increase significantly and could be 4-6 times more.
When importing goods, time is often a factor. If you have urgent stock needs and you need the goods delivered immediately, the best option for you would be air transportation.
On the other hand, if you order the products in advance and can wait up to 6 weeks, shipping would be a better option for you.
Another consideration may be ethical reasons:
if your company is concerned about their carbon footprint, shipping is undoubtedly the way forward.
In terms of CO2 emissions, sea freight emits 15 g of CO2 per tonne of cargo per kilometer, while air freight emits 545 g per tonne of cargo per kilometer!
Sea Freight
If you can meet the minimum requirements and you are looking for cheap international shipping, sea freight is exactly what you want.
What is Sea Freight?
Sea freight is the transportation of bulk cargo by sea. Your goods are packaged on cargo ships and shipped worldwide to their destination.
You might need a freight forwarder to do this, as they take care of the safety of your goods, keep you informed of their location, liaise with your suppliers, and sort out your deliveries.
The point is that there are many steps in this process that we take care of for you.
As you can guess, circumnavigating the world is not the fastest thing – shipping is the slowest process, usually taking more than a month.
However, making significant savings on costs could be worth the wait.
How Are International Shipping Rates Calculated?
Sea freight costs are calculated according to volume or weight (whichever is higher). It is usually the volume, so most companies need to know the size of your shipment to find out the price.
The industry uses the technical term “weight or measure” – often abbreviated to “ppm.” This means that 1.0 cubic meters are equivalent to 1000 kg.
The weight is rarely so high that it affects the cost, but if your shipment was 2.0 cm3 and 2500 kg, the weight is higher than the volume. If it were 2.5 cubic meters and 2000 kg, the amount would be more significant so that the freight fees would depend on it.
Crossing the border
Importing
If you are importing goods into the country, you need to know about possible surcharges. These may include:
Taxes and duties
Handling fee (depending on the service you use)
Customs clearance
Exporting
Exporting is accompanied by some rules and regulations as well, which you will also have to follow. Many of the documents required for export are general, for example:
Export invoices containing a detailed description of your products and the correct product code.
Typical transport documents – carrier’s receipt for the cargo with the details of the transportation and routing contract
Dangerous Goods Instructions – if your products are hazardous.
Export licenses – not always necessary, but worth knowing about.
Common sense is important when planning the initial logistics of your export. Think about the travel of your product and consider all possible options. If you are using freight forwarders, only use reputable companies and always remember to take out additional insurance.
If this is your first international delivery, you will most likely not know what Freight Forwarding is.
Forwarding is the transportation of bulk cargo, so a freight forwarder (shout out to SDC International) is an agent who acts on behalf of other companies to organize the safe, efficient, and economical transporting of goods.
To sum it up
There are many options for transporting goods, and there may not be one solution for your transportation needs. Each mode of transportation has its advantages and disadvantages.
Prioritization, understanding of cargo characteristics and cost comparison are the most important when planning and selecting the optimal mode of transport that best suits your personal or business needs.
About the Author:
Dmitrii B. is the founder of GRIN tech – a full-cycle white label agency delivering design, development and marketing solutions.
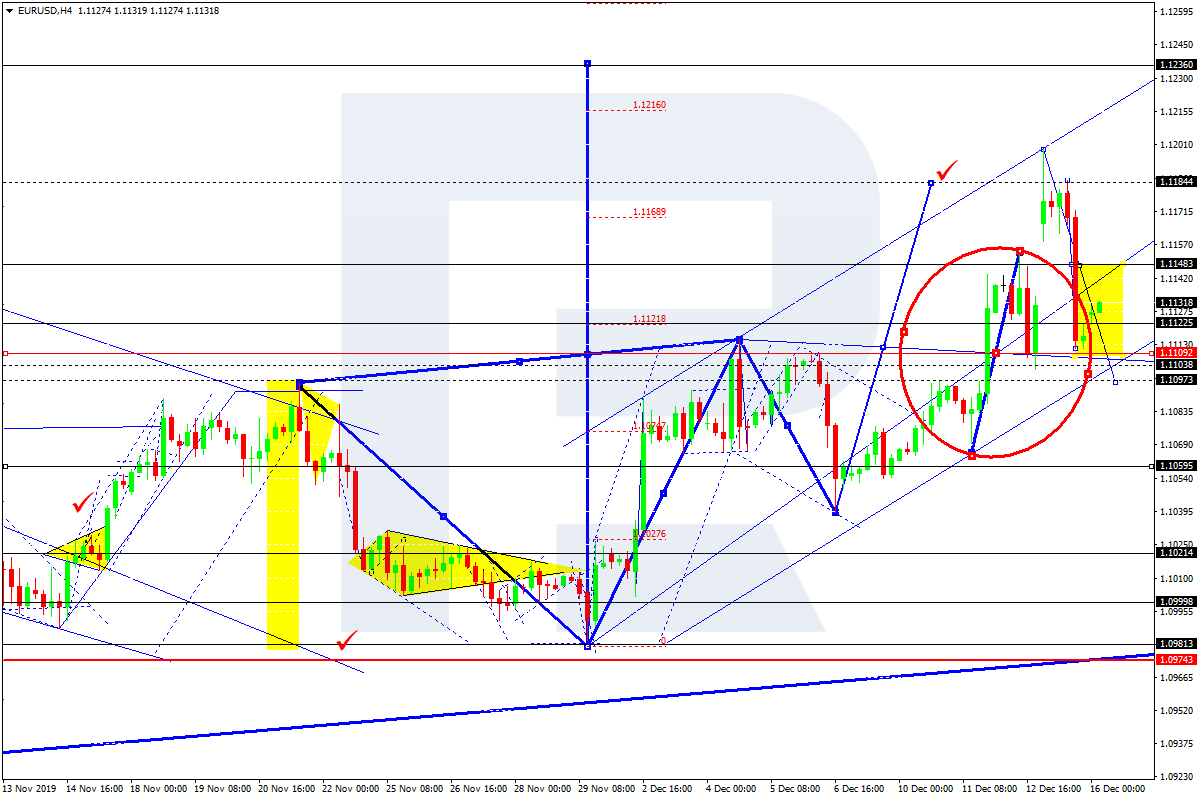
EURUSD is correcting with the target at 1.1100. Possibly, today the pair may move upwards to reach 1.1146 and then form a new descending structure towards the above-mentioned target. Later, the market may start the fifth wave to the upside to reach the key target at 1.1236.
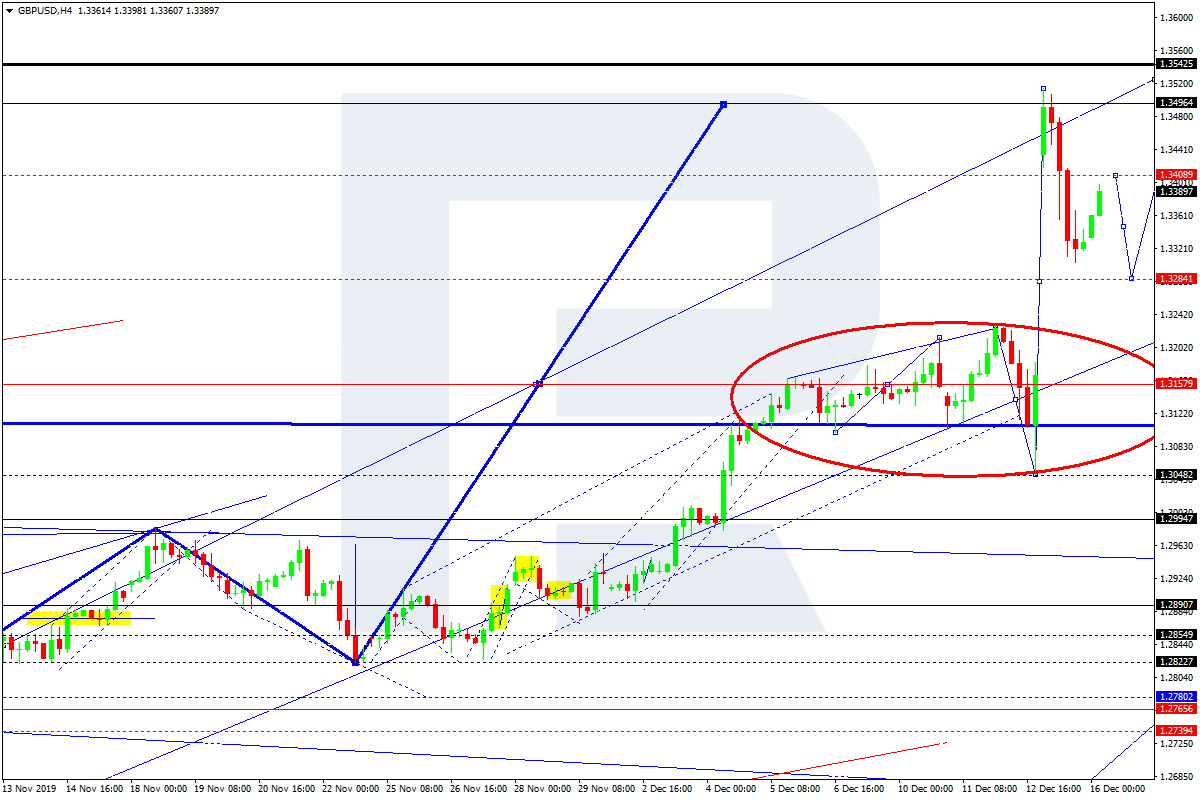
GBPUSD, “Great Britain Pound vs US Dollar”
GBPUSD is correcting with the target at 1.3288. Today, the pair may grow towards 1.3400 and then resume moving downwards to reach the above-mentioned target. After that, the instrument may form one more ascending structure towards 1.3542.
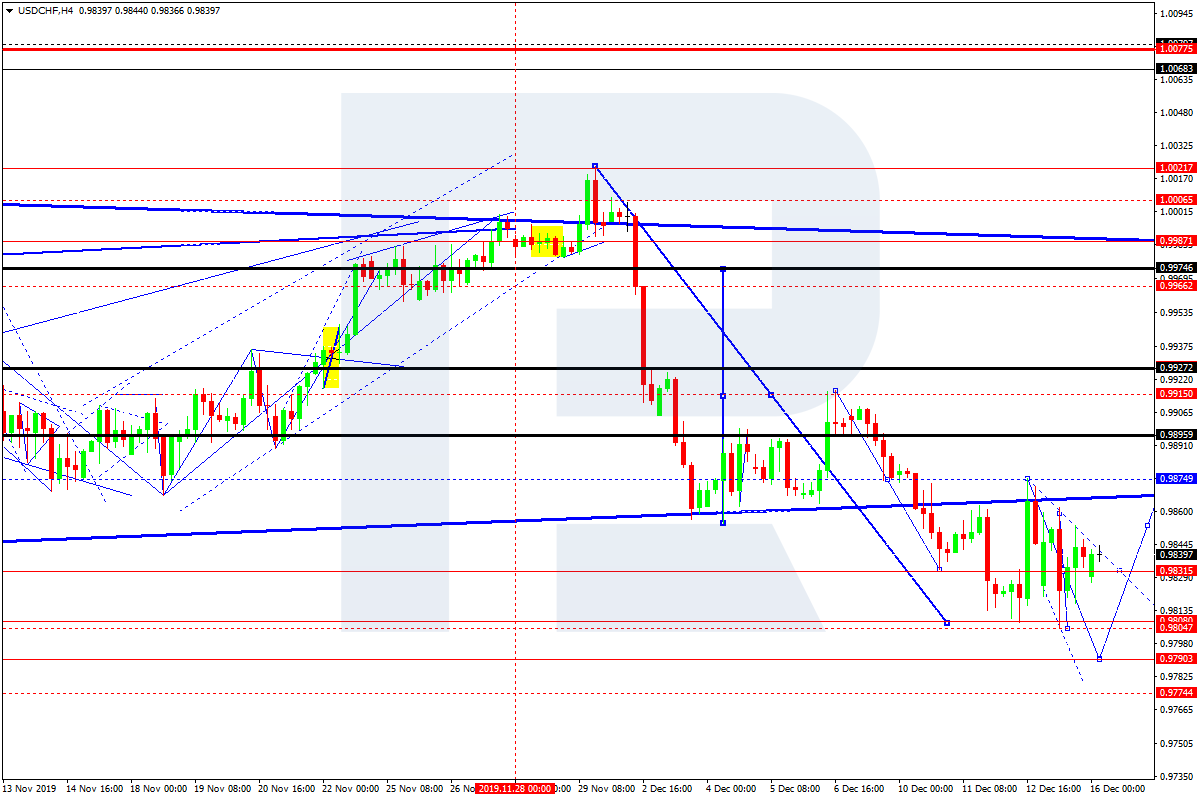
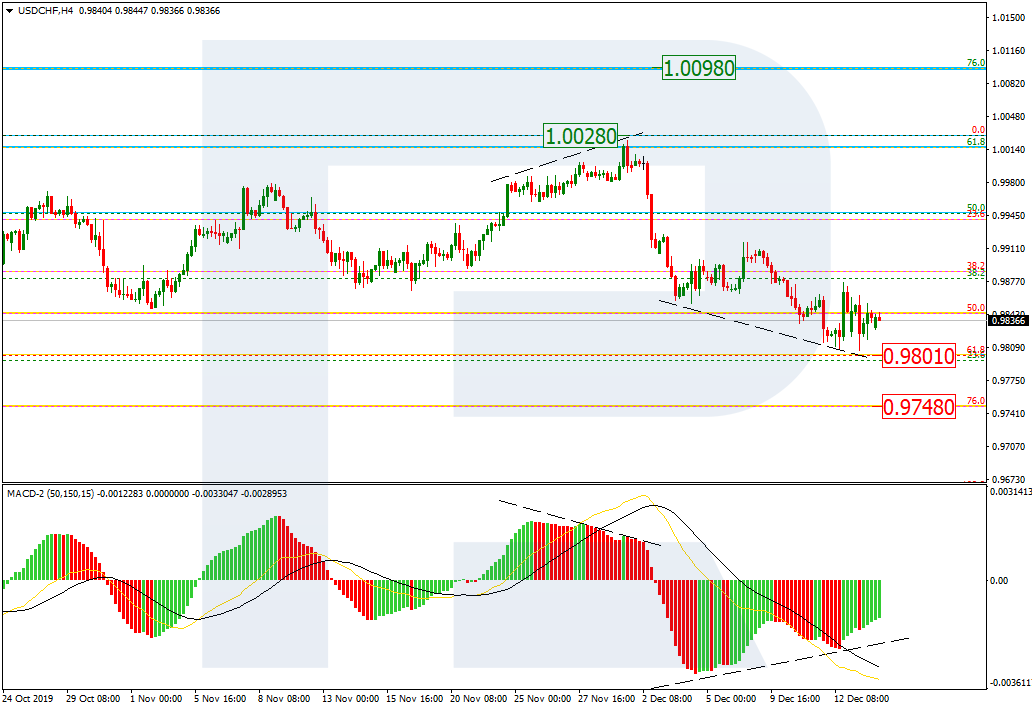
USDCHF, “US Dollar vs Swiss Franc”
USDCHF is consolidating around 0.9830. Possibly, today the pair may expand this range towards 0.9870. Later, the market may start a new decline with the target at 0.9790 and then resume trading upwards to reach 0.9915.
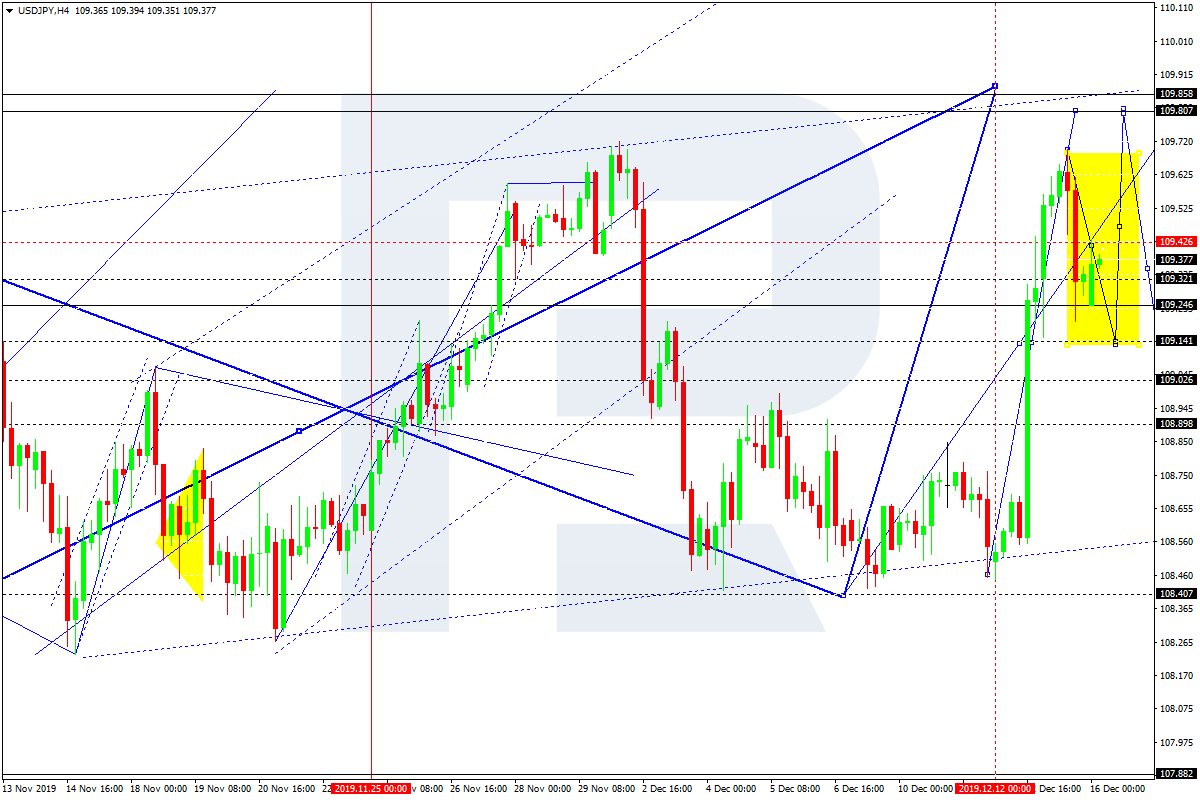
USDJPY, “US Dollar vs Japanese Yen”
USDJPY is correcting with the target at 109.14. Today, the pair may reach 109.44 and then start a new decline to reach the above-mentioned target. After that, the instrument may form one more ascending structure with the short-term target at 109.80.
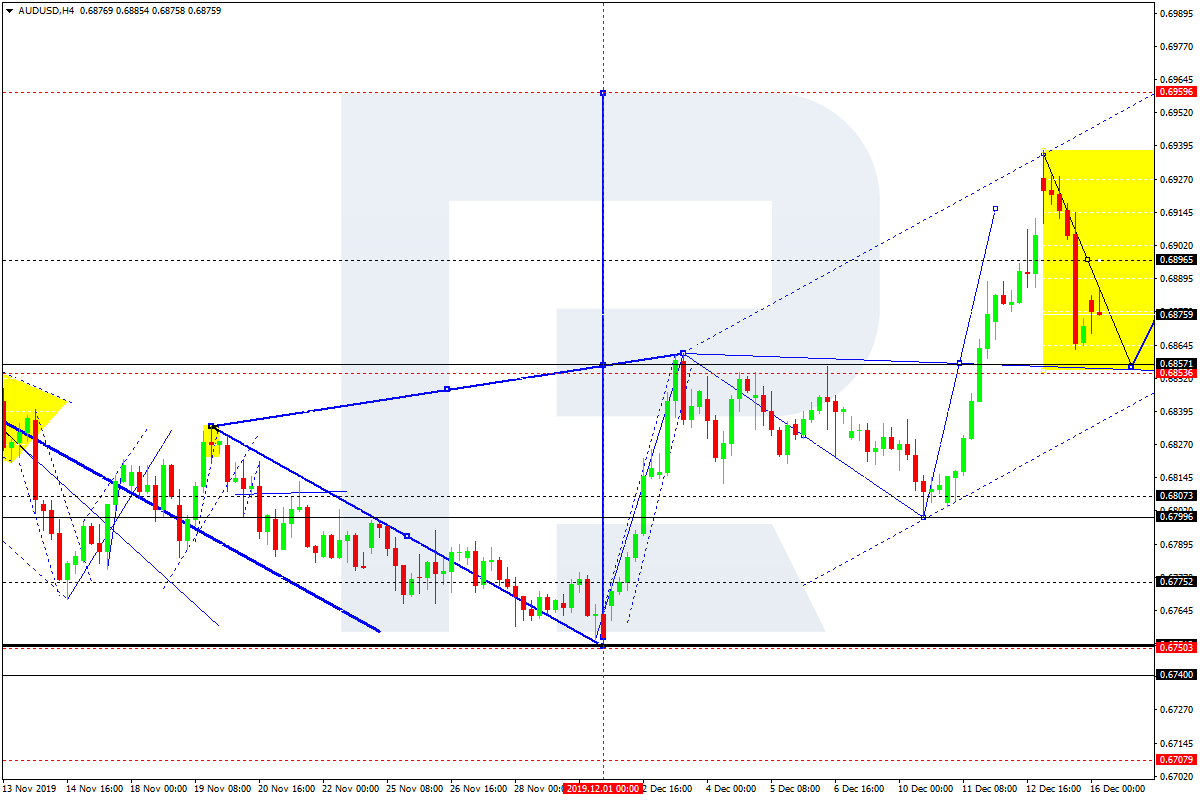
AUDUSD, “Australian Dollar vs US Dollar”
AUDUSD is correcting towards 0.6856. Later, the market may resume moving upwards with the key upside target at 0.6959.
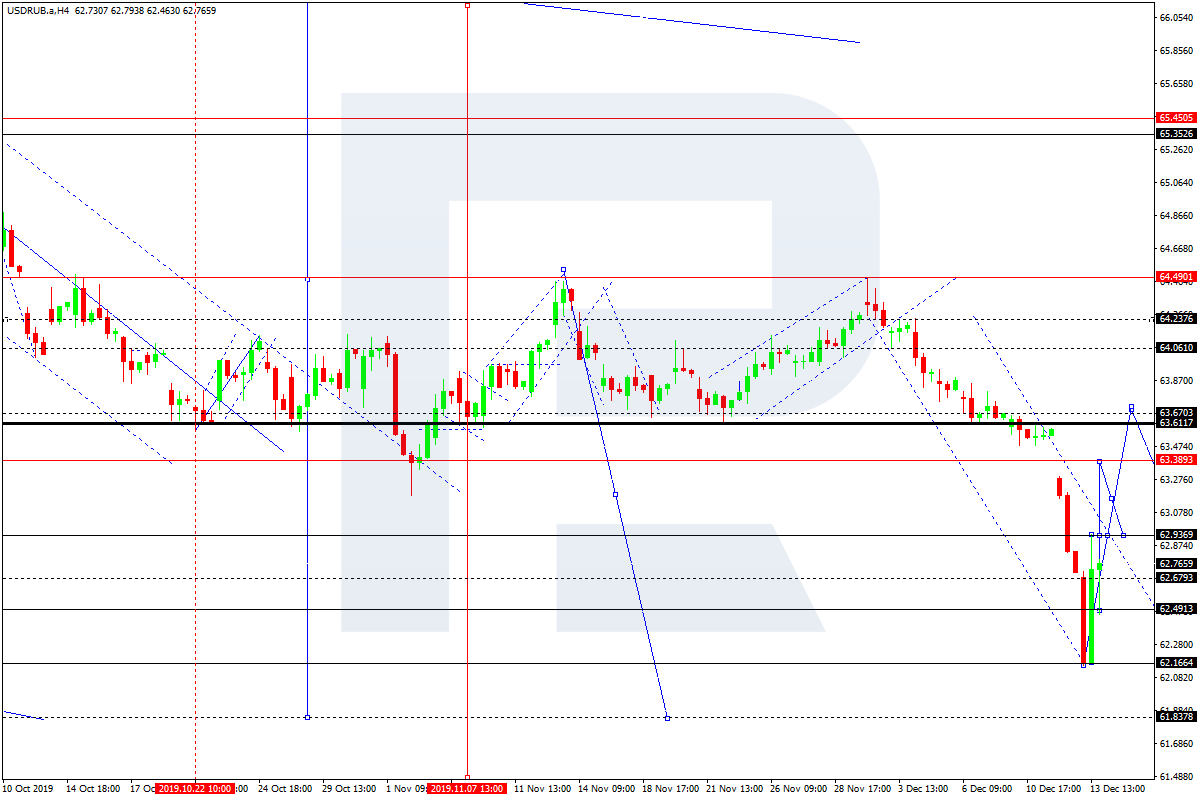
USDRUB, “US Dollar vs Russian Ruble”
USDRUB has completed the ascending impulse at 62.91 along with the correction towards 62.50, thus forming a new consolidation range. If later the price breaks this range to the upside at 62.90, the market may start a new growth with the short-term target at 63.37.
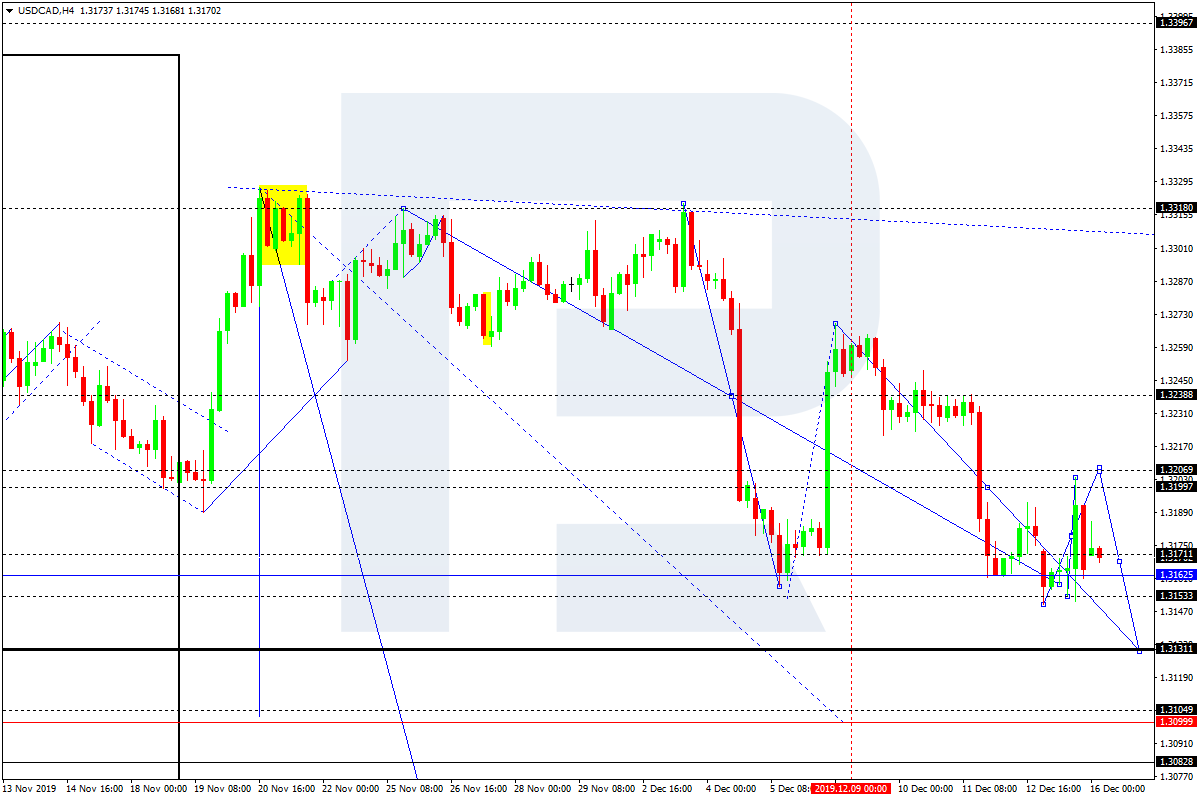
USDCAD, “US Dollar vs Canadian Dollar”
USDCAD is consolidating around 1.3177. Possibly, the pair may reach 1.3200 and then form a new descending structure towards 1.3131. Later, the market may start another correction with the target at 1.3232.
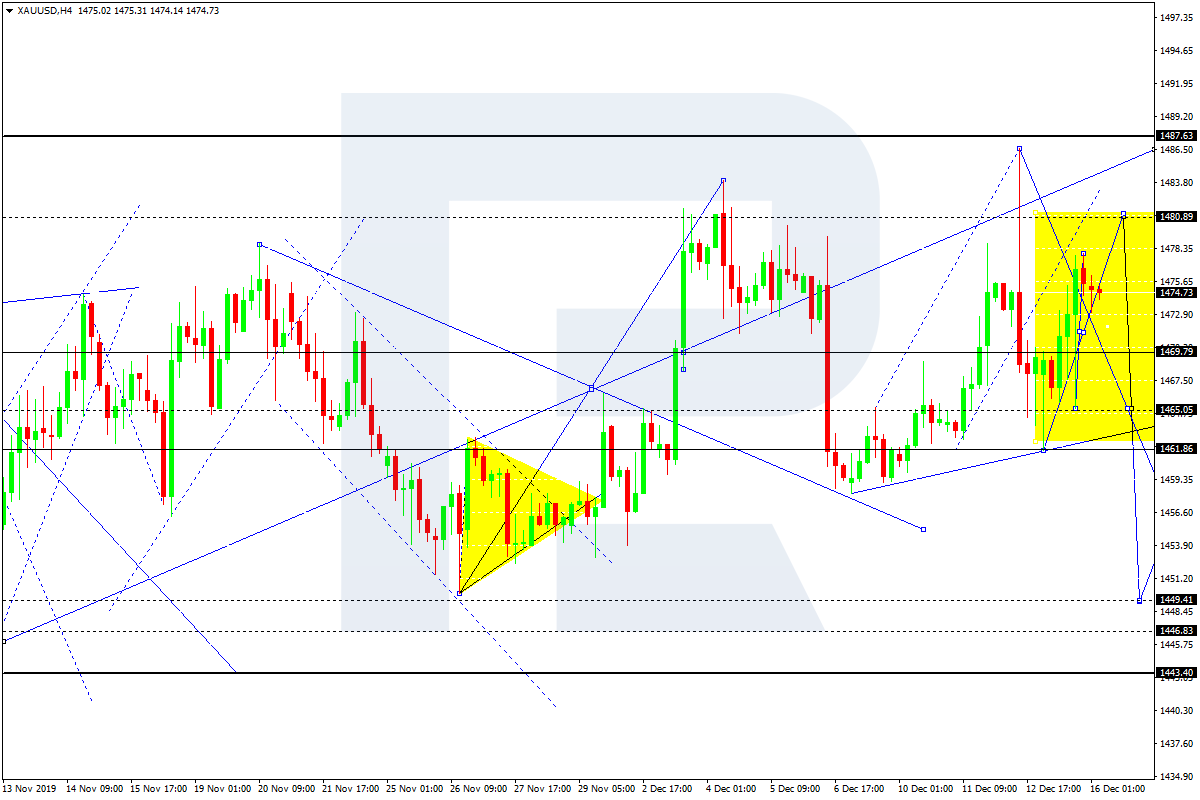
XAUUSD, “Gold vs US Dollar”
Gold is correcting towards 1480.88. After that, the instrument may form a new descending structure to break 1465.05 and then continue moving downwards with the target at 1449.40.
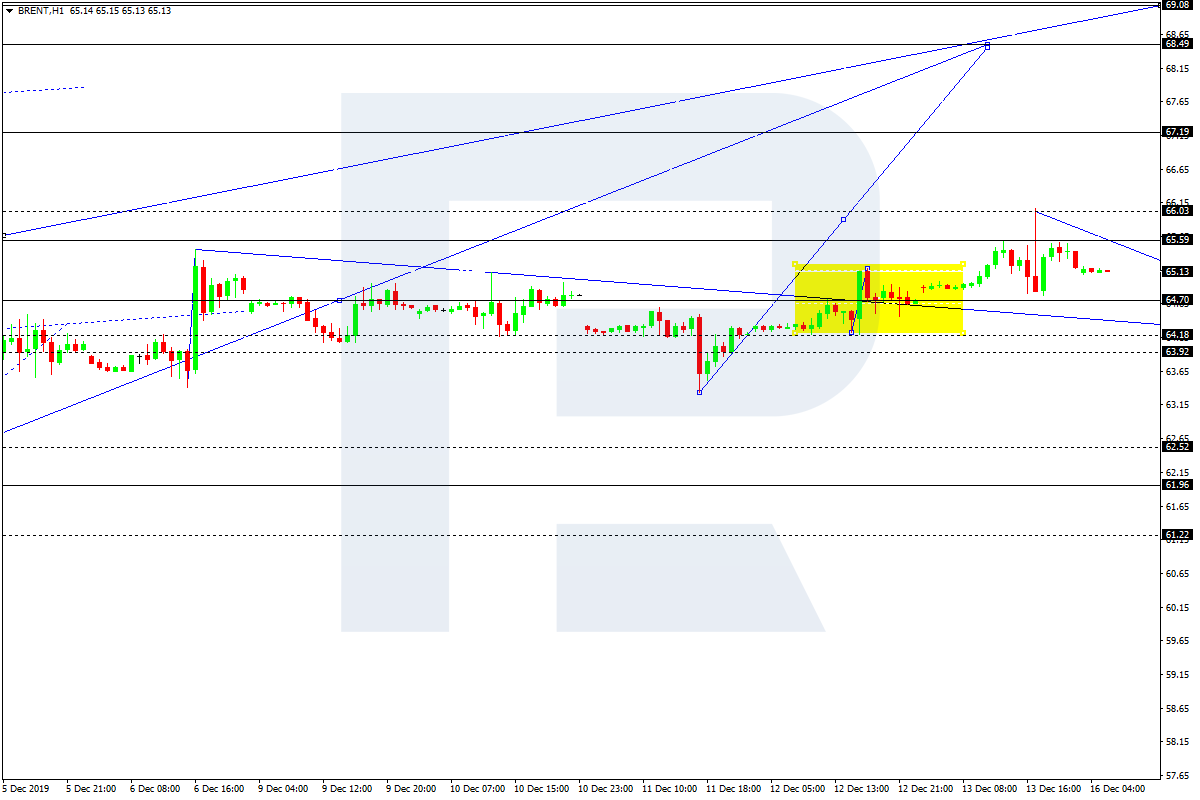
BRENT
Brent has finished the ascending impulse at 66.00; right now, it is correcting downwards to reach 64.77. After that, the market may start a new growth with the short-term target at 67.20.
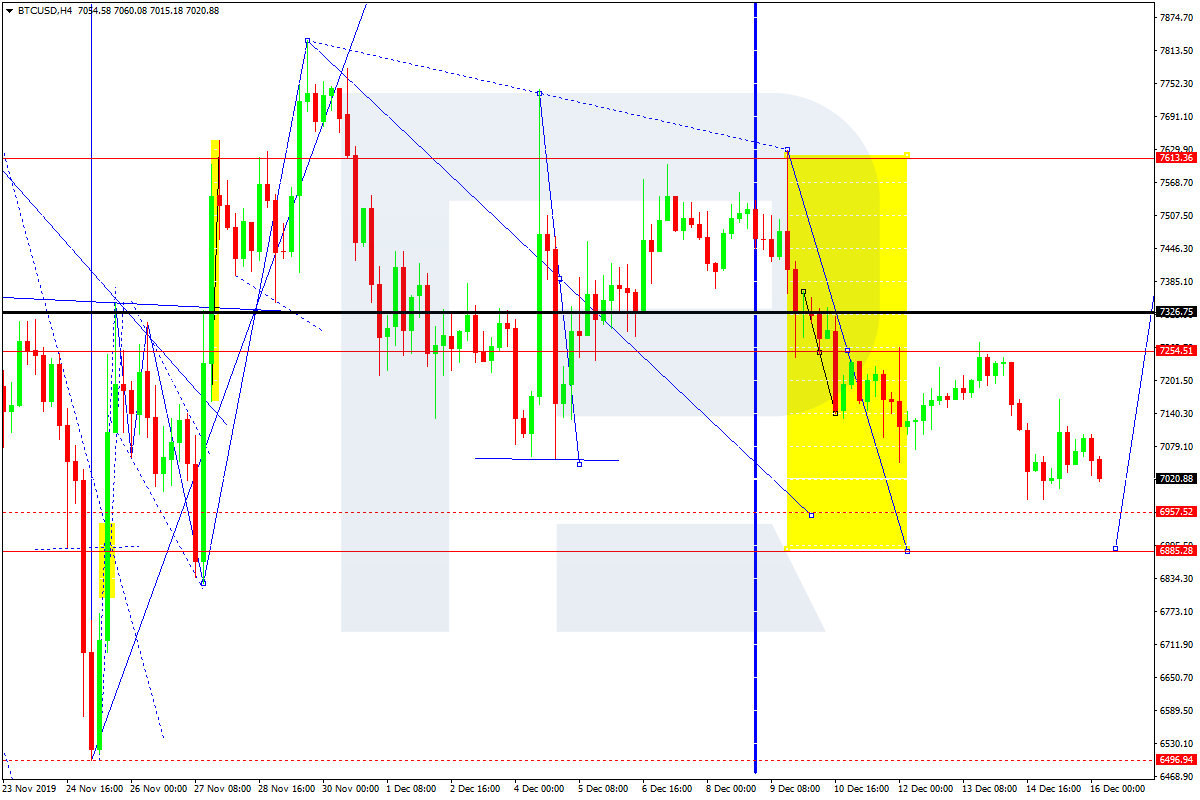
BTCUSD, “Bitcoin vs US Dollar”
BTCUSD is moving downwards with the target at 7000.00. Later, the market may form one more ascending structure to break 7600.00 and then continue trading upwards to reach 8165.00.
Attention! Forecasts presented in this section only reflect the author’s private opinion and should not be considered as guidance for trading. RoboForex LP bears no responsibility for trading results based on trading recommendations described in these analytical reviews.
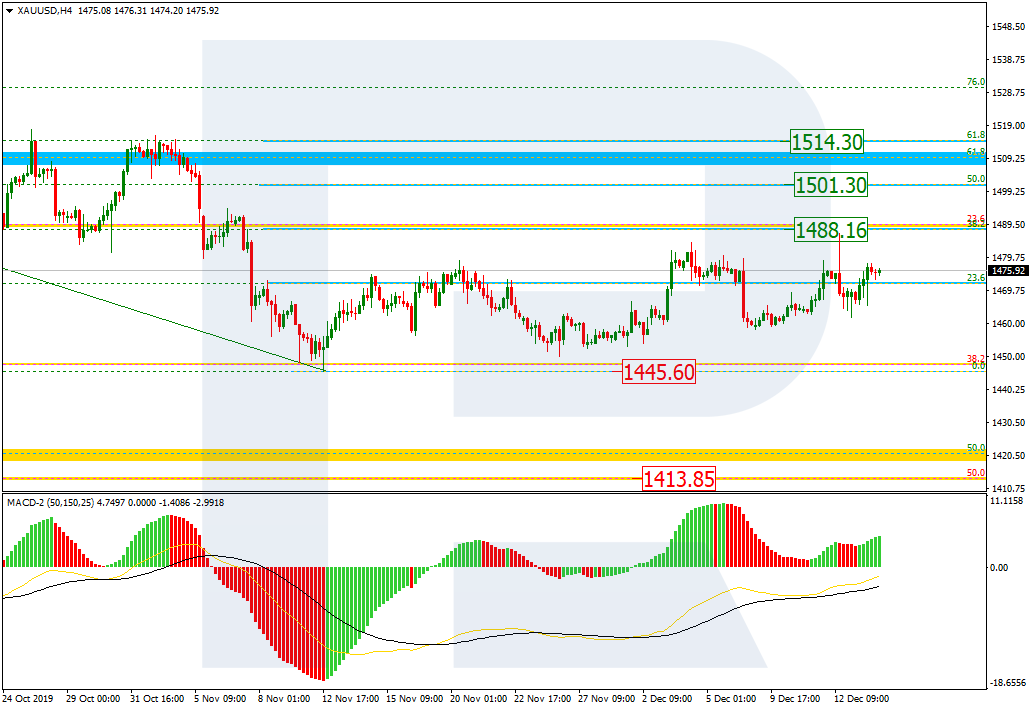
As we can see in the H4 chart, XAUUSD continues the correctional uptrend towards 38.2% fibo at 1488.16. After breaking еры level, the pair may continue growing to reach 50.0% and 61.8% fibo at 1501.30 and 1514.30 respectively. After completing the correction, the instrument may break the local low at 1445.60 and continue falling towards its mid-term target, which is 50.0% fibo at 1413.85.
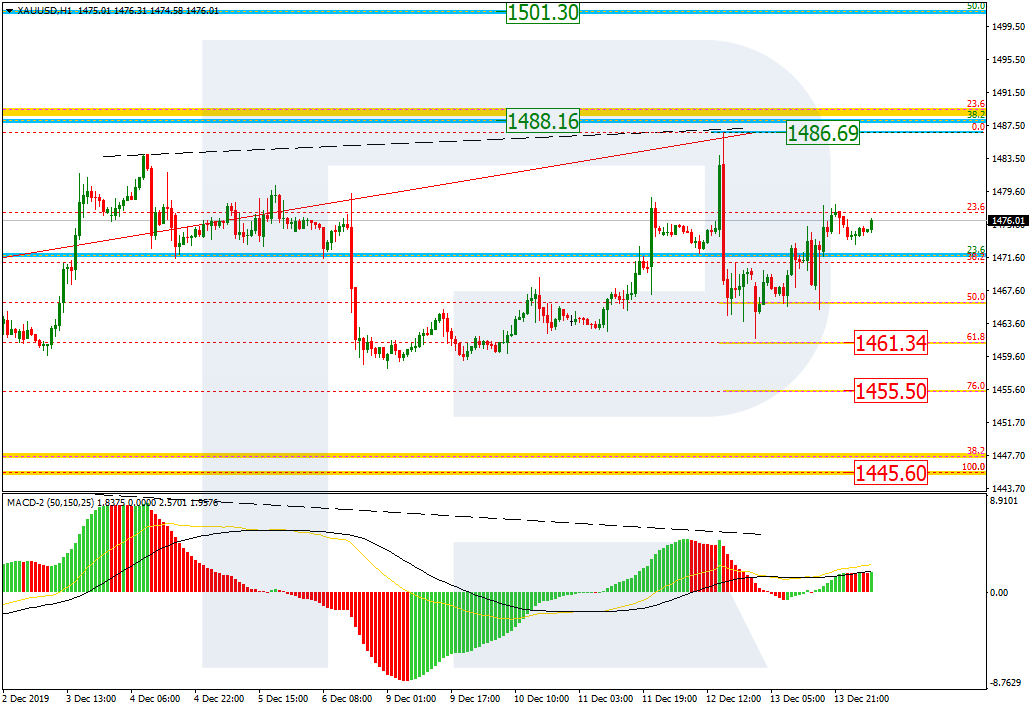
In the H1 chart, the divergence made the pair start a quick descending impulse, which has reached 61.8% fibo at 1461.34. Right now, the price is forming a pullback towards the local high at 1486.69. If the instrument fails to reach and break the high, the next descending wave will be heading towards 76.0% fibo at 1455.50 and then the low at 1445.60.
USDCHF, “US Dollar vs Swiss Franc”
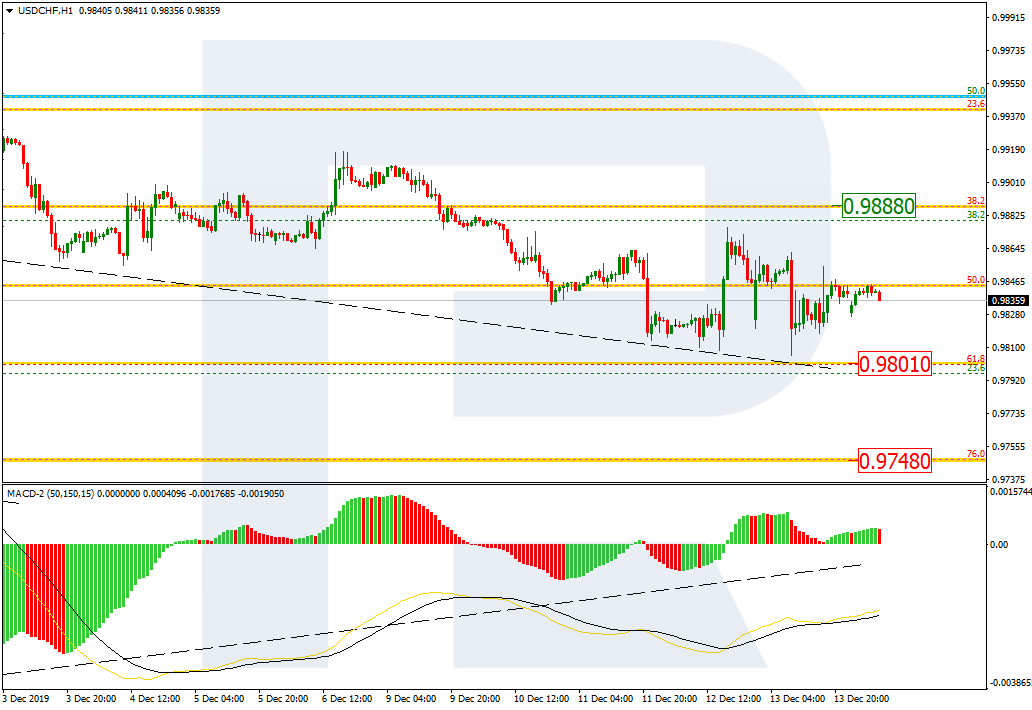
The H4 chart shows the descending correctional wave. After the price reached its mid-term high, there was a divergence on MACD, which made the pair start a quick descending wave. By now, it has almost reached 61.8% fibo at 0.9801. After breaking this level and fixing below it, USDCHF may continue falling towards 76.0% at 0.9748. At the same time, there is a convergence on MACD, which may indicate a possible reverse soon.
As we can see in the H1 chart, USDCHF is trading downwards to reach 61.8% fibo at 0.9801. At the same time, there is a convergence on MACD.
Attention! Forecasts presented in this section only reflect the author’s private opinion and should not be considered as guidance for trading. RoboForex LP bears no responsibility for trading results based on trading recommendations described in these analytical reviews.
The US dollar ended the trading week with a decline. The dollar index (#DX) closed on Friday in the red zone (-0.22%). On Sunday, US Trade Representative Robert Lighthizer announced that the phase one US-China trade deal was “totally done.” US President Donald Trump pledged to cancel a new round of tariffs, which was scheduled for December 15. In turn, Beijing promised to increase purchases of American agricultural products. Also, Donald Trump announced that the second stage of trade negotiations would begin immediately after the conclusion of the first stage. However, Beijing made clear that the transition to the next phase would depend on how the conditions of the first phase were met.
The British pound continues to strengthen after the decisive victory of the conservative party by Prime Minister Boris Johnson in the elections. This victory paved the way for Britain to exit the EU. The Brexit process may already begin after the official opening of parliament and the Queen’s speech on Thursday. Investors also expect the Bank of England interest rate decision and its statements on monetary policy issues.
Today, during the Asian trading session, optimistic economic data have been published in China. Thus, China’s industrial production grew by 6.2% in November, while experts expected 5.0%.
The “black gold” prices continue to show positive dynamics. At the moment, futures for the WTI crude oil are testing the $60.00 mark per barrel.
Market Indicators
On Friday, there was the bullish sentiment in the US stock market: #SPY (+0.06%), #DIA (+0.06%), #QQQ (+0.33%).
The 10-year US government bonds yield has declined. At the moment, the indicator is at the level of 1.84-1.85%.
The Economic News Feed for 16.12.2019:
– Statistics on economic activity in Germany and the Eurozone at 10:30 (GMT+2:00) and 11:00 (GMT+2:00), respectively;
– Composite PMI in the UK at 11:30 (GMT+2:00);
– Services PMI in the UK at 11:30 (GMT+2:00);
– Markit composite PMI in the US at 16:45 (GMT+2:00).
A resounding triumph of the Tory and its leader Boris Johnson at early parliamentary elections in the United Kingdom helped the Pound to skyrocket last week. On Monday, December 16th, 2019, GBPUSD is back to growth after a slight technical correction. Right now, it is trading at 1.3385.
So, it is reported that the Tory secured 364 out of seats 650 seats in the House of Commons, thus giving Boris Johnson an excellent chance for successful ratification of the actual Brexit agreement in the parliament. The Tory hasn’t seen such strong results for a very long time, since 1987, while for its opponent, the British Labor Party that now holds 203 seats in the renewed Parliament, they are the worst over 40 years.
At this point, the British Parliament and Johnson are facing a very complicated and hard work to ratify all necessary documents for the Brexit. In case everything goes the way as it should, the United Kingdom may officially start exiting the alliance within the specified time, before the end of January 2020. De facto, the United Kingdom may have exited the European Union only at the end of 2020 – the year will be a transition period for both parties.
The Pound is very energetic right now because investors finally saw what they had been longing for. In this light, no external news is able to kill this positive mood.
As we can see in the H4 chart, GBP/USD has reached the short-term upside target at 1.3496; right now, it is correcting towards 1.3288. After completing the correction, the pair may start the fifth ascending wave to reach 1.3533. Later, the market may a deeper correction with the target at 1.3155. From the technical point of view, this scenario is confirmed by MACD Oscillator: its signal line is moving near the highs. The indicator is expected to leave the histogram area and fall towards 0. After that, one may expect another growth towards the highs.
In the H1 chart, GBP/USD has returned to 1.3408. Today, the pair may continue the correction towards 1.3288. After that, the instrument may break the correctional channel and start another rising wave with the first target at 1.3410. From the technical point of view, this scenario is confirmed by Stochastic Oscillator: its signal line is moving inside the “overbought area” and may start falling to break 80. Later the indicator may continue moving downwards to reach 50.
Disclaimer
Any predictions contained herein are based on the authors’ particular opinion. This analysis shall not be treated as trading advice. RoboForex shall not be held liable for the results of the trades arising from relying upon trading recommendations and reviews contained herein.
The last trading session on the EUR/USD currency pair is very active. At the same time, a unidirectional trend is not observed. At the moment, the following local support and resistance levels can be distinguished: 1.11100 and 1.11450, respectively. Monitor trade negotiations between Washington and Beijing. U.S. sales representative Robert Lighthizer provides the opportunity to sign the first phase of the agreement in early January 2020. Today in Germany and the eurozone. Open positions from key levels.
The Economic News Feed for 16.12.2019:
– Business Activity Report (GER/EU) – 10:30/11:00 (GMT+2:00);
Indicators do not provide accurate signals: the price crossed 50 MA and 100 MA.
The MACD histogram is in the negative zone but above the signal line, which gives a weak signal to sell EUR/USD.
The Stochastic Oscillator is in the overbought zone, the %K line has crossed the %D line. There are currently no signals.
Trading recommendations
Support levels: 1.11100, 1.10900, 1.10700
Resistance levels: 1.11450, 1.11850, 1.12000
If the price consolidates above 1.11450, expect further growth toward 1.11800-1.12000.
Alternatively, the quotes could drop toward 1.10800-1.10600.
The GBP/USD currency pair
Technical indicators of the currency pair:
Prev Open: 1.33362
Open: 1.33390
% chg. over the last day: +1.23
Day’s range: 1.33370 – 1.34222
52 wk range: 1.1959 – 1.3516
Last week, sterling strengthened significantly against the US dollar. Demand for the pound rose after the victory of the ruling conservative party in the election. At the moment, GBP/USD quotes have stabilized. Market participants expect up-to-date information on Brexit. Today, investors will evaluate important economic releases from the UK. In the near future, technical correction of the trading instrument is not ruled out. Open positions from main levels.
At 11:30 (GMT+2:00) a number business activity indicators in the UK will be published.
Indicators signal the power of buyers: the price has fixed above 50 MA and 100 MA.
The MACD histogram is in the positive zone and continues to rise, which gives a strong signal to buy GBP/USD.
The Stochastic Oscillator is in the overbought zone, the %K line has crossed the %D line. There are currently no signals.
Trading recommendations
Support levels: 1.33100, 1.32250, 1.31650
Resistance levels: 1.34200, 1.35000
If the price consolidates above 1.34200, expect the quotes to grow toward 1.35000-1.35400.
Alternatively, the quotes could descend toward 1.32600-1.32300.
The USD/CAD currency pair
Technical indicators of the currency pair:
Prev Open: 1.31830
Open: 1.31719
% chg. over the last day: -0.12
Day’s range: 1.31423 – 1.31862
52 wk range: 1.3014 – 1.3664
The USD/CAD currency pair continues to be traded in a flat. There is no defined trend. At the moment, quotes are testing the support level of 1.31450. 1.31750 is the nearest resistance. Looney is supported by bullish sentiment in the oil market. The trading instrument has the potential to further decline. Open positions from key levels.
The Economic News Feed for 16.12.2019 is calm.
Indicators signal the power of sellers: the price has fixed below 50 MA and 100 MA.
The MACD histogram has moved into the negative zone, which also indicates a bearish sentiment.
The Stochastic Oscillator is in the oversold zone, the %K line is below the %D line, which gives a weak signal to sell USD/CAD.
Trading recommendations
Support levels: 1.31450, 1.31000
Resistance levels: 1.31750, 1.32000, 1.32250
If the price consolidates below 1.31450, expect the quotes to drop toward 1.31000.
Alternatively, the quotes could grow toward 1.31900-1.32100.
The USD/JPY currency pair
Technical indicators of the currency pair:
Prev Open: 109.197
Open: 109.292
% chg. over the last day: +0.06
Day’s range: 109.277 – 109.444
52 wk range: 104.45 – 113.53
USD/JPY stabilized after a significant increase last week. Demand for the “safe haven” currencies weakened amid the prospects for a settlement of the trade conflict between Washington and Beijing. The trading instrument is currently consolidating. The local support and resistance levels are 109.250 and 109.450, respectively. In the near future, a technical correction of the USD/JPY currency pair is possible. We recommend that you pay attention to the dynamics of yield on US government bonds. Open positions from key levels.
The Economic News Feed for 16.12.2019 is calm.
The price has fixed above 50 MA and 100 MA, which signals the power of buyers.
The MACD histogram is close to 0. There are no signals at the moment.
The Stochastic Oscillator is in the neutral zone, the %K line crossed the %D line. There are no accurate signals.
Trading recommendations
Support levels: 109.250, 109.050, 108.900
Resistance levels: 109.450, 109.700
If the price consolidates above 109.450, expect the quotes to grow toward 109.700-110.000.
Alternatively, the quotes could descend toward 109.100-108.900.
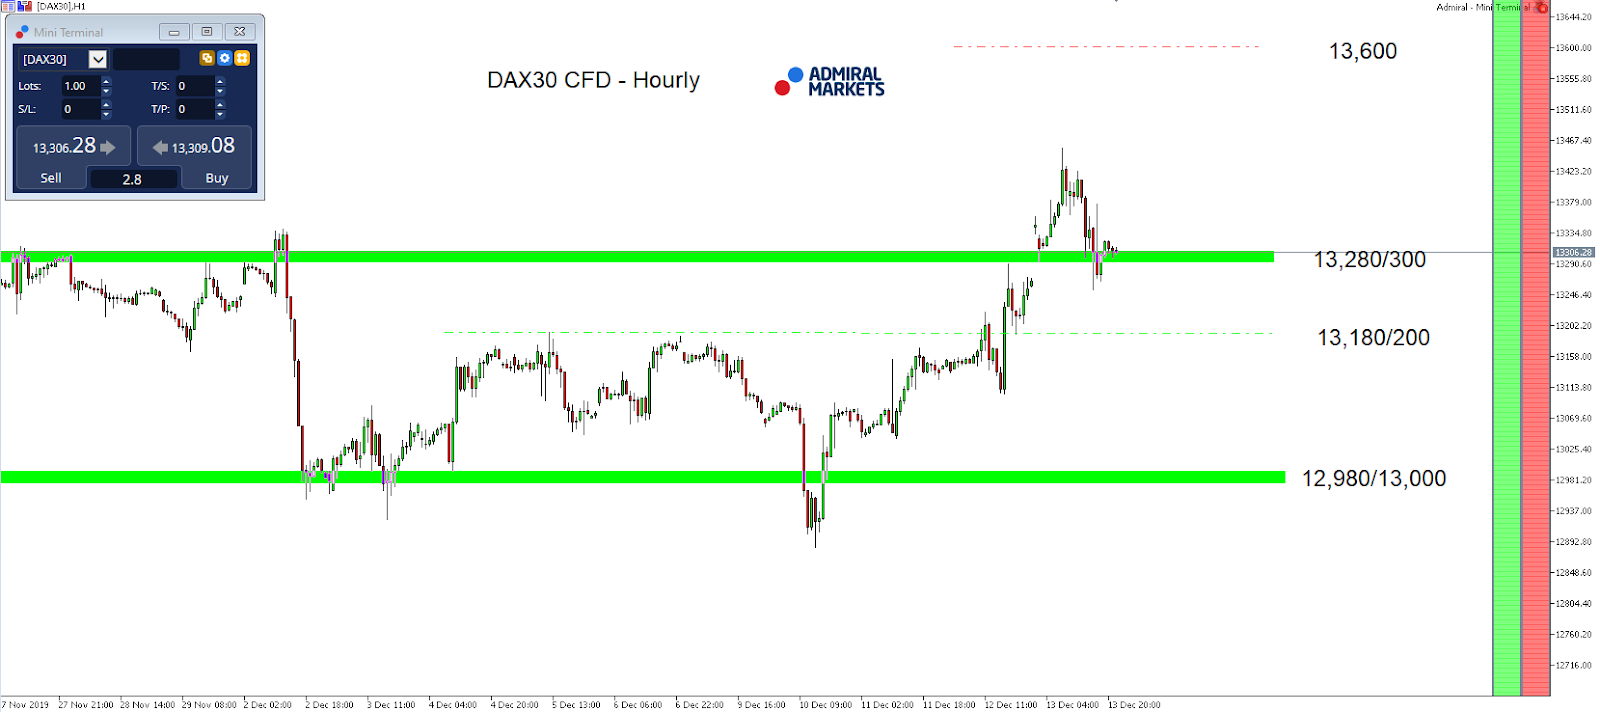
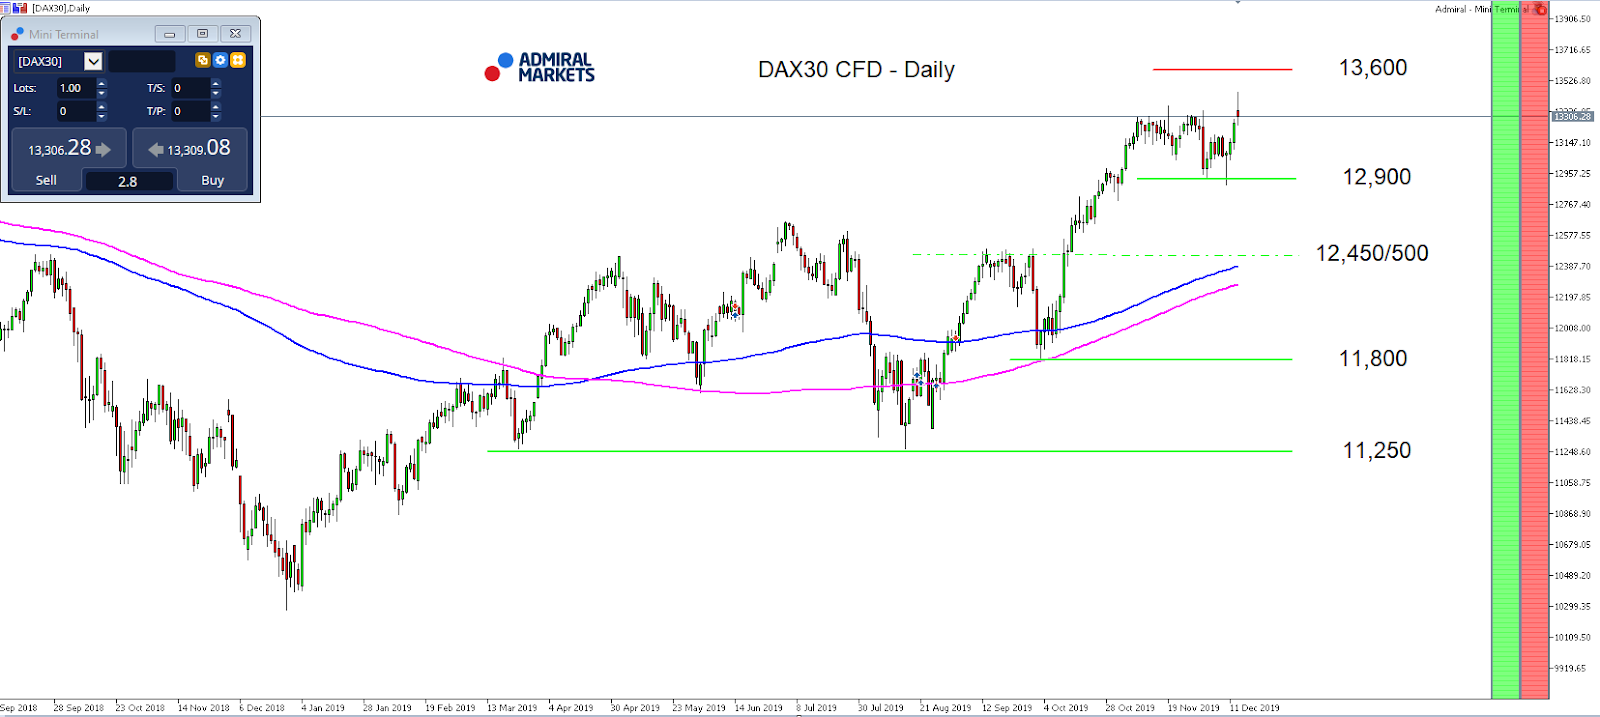
After last Thursday’s developments in the US-Chinese trade deal, the UK’s general election, and the Fed’s liquidity announcement, the outlook for the DAX30 CFD is very bright as we start the trading week.
The main driver for the bullish action, and the ensuing break above 13,180/200 points resulting in new yearly highs, was certainly the “deal” between the US and China where both sides are said to have agreed on a reduction on existing tariffs, and a delay in those planned to go into effect on December 15.
In addition to this, there was the landslide victory of UK prime minister Johnson’s Tories in the General election which made a near-term Brexit deal likely and diminished uncertainties among market participants, as well as the Fed’s announcement that it will flood markets with $500 Billion in liquidity to avoid a year-end repo crisis (and will thus extend the Fed balance sheet to new record highs by mid-January).
That said, we project a bullish DAX30 CFD for the yearly close, with a high likelihood of new all-time highs and thus a push to and above 13,600 points in the coming days.
A short-term correction finds a potential Long trigger in the region around 13,280/300 points and a littler deeper around 13,180/200 points, with the mode staying bullish on an Hourly time-frame above 13,080/100 points:
Source: Admiral Markets MT5 with MT5-SE Add-on DAX30 CFD Hourly chart (between November 27, 2018, to December 13, 2019). Accessed: December 13, 2019, at 10:00pm GMT
Source: Admiral Markets MT5 with MT5-SE Add-on DAX30 CFD Daily chart (between September 5, 2018, to December 13, 2019). Accessed: December 13, 2019, at 10:00pm GMT – Please note: Past performance is not a reliable indicator of future results, or future performance.
In 2014, the value of the DAX30 CFD increased by 2.65%, in 2015, it increased by 9.56%, in 2016 it increased by 6.87%, in 2017 it increased by 12.51%, in 2018 it fell by 18.26%, meaning that after five years, it was up by 10.5%.
Discover the world’s #1 multi-asset platform
Admiral Markets offers professional traders the ability to trade with a custom, upgraded version of MetaTrader 5, allowing you to experience trading at a significantly higher, more rewarding level. Experience benefits such as the addition of the Market Heat Map, so you can compare various currency pairs to see which ones might be lucrative investments, access real-time trading data, and so much more. Click the banner below to start your FREE download of MT5 Supreme Edition!
Disclaimer: The given data provides additional information regarding all analysis, estimates, prognosis, forecasts or other similar assessments or information (hereinafter “Analysis”) published on the website of Admiral Markets. Before making any investment decisions please pay close attention to the following:
This is a marketing communication. The analysis is published for informative purposes only and are in no way to be construed as investment advice or recommendation. It has not been prepared in accordance with legal requirements designed to promote the independence of investment research, and that it is not subject to any prohibition on dealing ahead of the dissemination of investment research.
Any investment decision is made by each client alone whereas Admiral Markets shall not be responsible for any loss or damage arising from any such decision, whether or not based on the Analysis.
Each of the Analysis is prepared by an independent analyst (Jens Klatt, Professional Trader and Analyst, hereinafter “Author”) based on the Author’s personal estimations.
To ensure that the interests of the clients would be protected and objectivity of the Analysis would not be damaged Admiral Markets has established relevant internal procedures for prevention and management of conflicts of interest.
Whilst every reasonable effort is taken to ensure that all sources of the Analysis are reliable and that all information is presented, as much as possible, in an understandable, timely, precise and complete manner, Admiral Markets does not guarantee the accuracy or completeness of any information contained within the Analysis. The presented figures refer that refer to any past performance is not a reliable indicator of future results.
The contents of the Analysis should not be construed as an express or implied promise, guarantee or implication by Admiral Markets that the client shall profit from the strategies therein or that losses in connection therewith may or shall be limited.
Any kind of previous or modeled performance of financial instruments indicated within the Publication should not be construed as an express or implied promise, guarantee or implication by Admiral Markets for any future performance. The value of the financial instrument may both increase and decrease and the preservation of the asset value is not guaranteed.
The projections included in the Analysis may be subject to additional fees, taxes or other charges, depending on the subject of the Publication. The price list applicable to the services provided by Admiral Markets is publicly available from the website of Admiral Markets.
Leveraged products (including contracts for difference) are speculative in nature and may result in losses or profit. Before you start trading, you should make sure that you understand all the risks.
December, 16th – Limassol, Cyprus – RoboMarkets, a European company and a prominent provider of investment services on global financial markets, is pleased to announce the reception of the Best Trading Execution award at the prestigious Professional Trader Awards 2019. Winners in different nominations were decided by the poll conducted among professional traders. The award ceremony took place on December 19th, 2019 in the Four Seasons hotel in London.
Professional Trader Awards is presented to the brokers that have exclusive offers for maintaining professional trading accounts. Awards in each of 14 nominations were given out to the companies that achieved outstanding results in the fields of technologies and innovations, trading conditions and order execution quality, development of loyalty programs and customer support services.
The open voting started on November 1st, 2019, right after the award nominees were announced. For three weeks, the organizing committee of the event had been closely working with a professional trading community via media partners and third-party trade representatives, and involving in voting individual traders who operate on professional accounts. All of them were offered to express their opinions and vote for the companies that demonstrated the best results in each of the categories. Thereby, the professional trading community selected all winners of “Professional Trader Awards 2019”.
“Since the moment RoboMarkets was established in 2012, the Company’s activities have been focused on providing its clients with services of the highest quality. It is safe to say that RoboMarkets still gives the highest priority to this principle, which appears relevant up to the present days. We’re very pleased that experts in the industry expressed such high opinions about our efforts in this direction. It means that products and technological solutions offered by RoboMarkets meet all existing standards and allow clients to pursue their investment goals with with the best trading execution.” – says Anton Ivanov, RoboMarkets marketing officer.
About RoboMarkets
RoboMarkets is an investment company with the CySEC license No. 191/13. RoboMarkets offers investment services in many European countries by providing traders, who work on financial market, with access to its proprietary trading platforms. More detailed information about the Company’s products and activities can be found on the official website at www.robomarkets.com.