Author Archive for InvestMacro – Page 120

Markets Cheer As Trade Deal Is Near

By Orbex

Equity markets regained the bullish momentum as news came in that the United States and China were going to sign the phase one deal. Both parties were positive on the developments. Although the deal is still the first step, investors believe that this will open the way for further talks. Markets have been jittery since the start of the year with both parties flip-flopping on trade talks.

Euro Slips as US Data Marginally Better

The euro currency posted losses on Friday. The declines came on the back of USD strength. Economic data on the day saw US personal income rising 0.5% on the month. This beat estimates of a 0.3% rise and up from a revised 0.1% previously. Data from the Eurozone was sparse with only the consumer confidence data which did not impact the flow much.

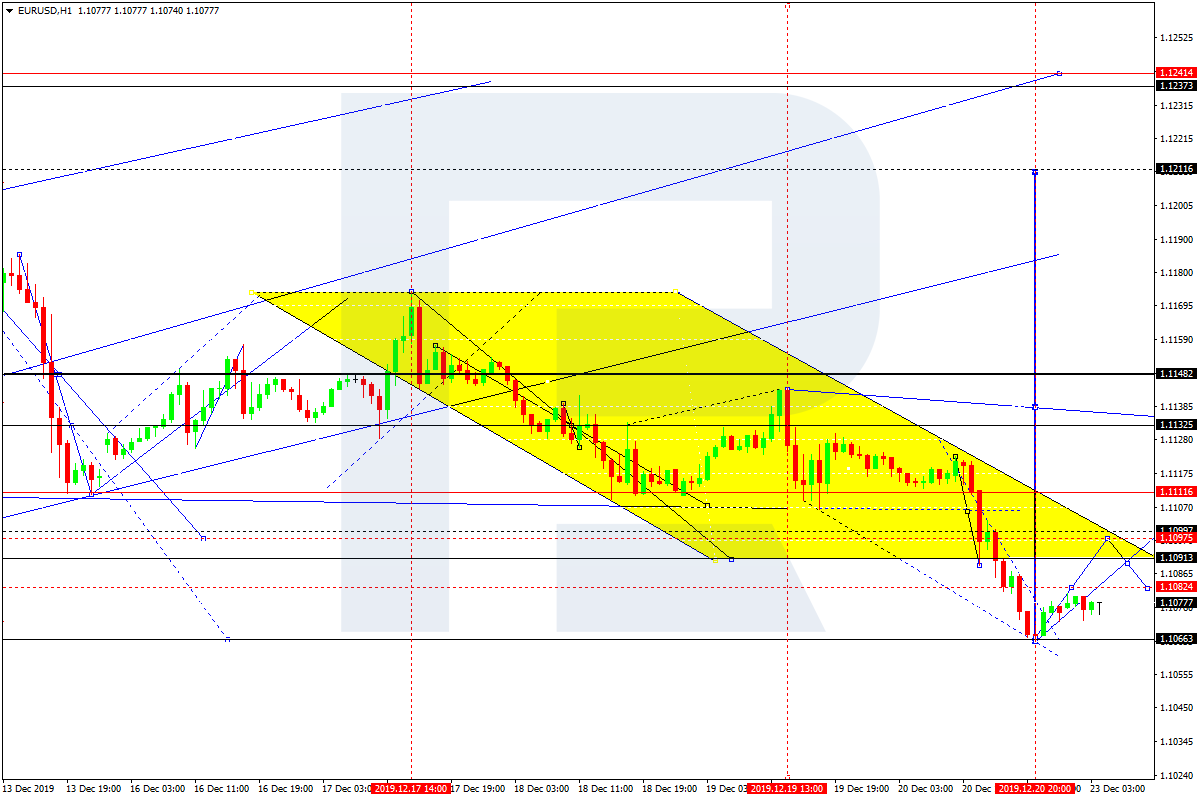
Will EURUSD Rebound from Support?

The common currency’s declines have pushed the euro down to 1.1072 level of support. From here on, we expect to see a rebound. This also coincides with the Stochastics oscillator settling near the oversold level. Therefore, there is a chance of a move to the upside. But the resistance levels at 1.1100 and 1.1131 will likely cap the gains.

Sterling Cautious as UK MP’s Pass 2nd Brexit Reading

The pound sterling was trading cautiously on Friday. UK MPs passed the second hearing of PM Johnson’s Brexit bill. The bill outlines no possibility for an extension. This means that the UK will leave the EU by the end of 2020, irrespective of a deal. Further in the UK, Andrew Bailey was formally selected as the next Governor of the Bank of England.

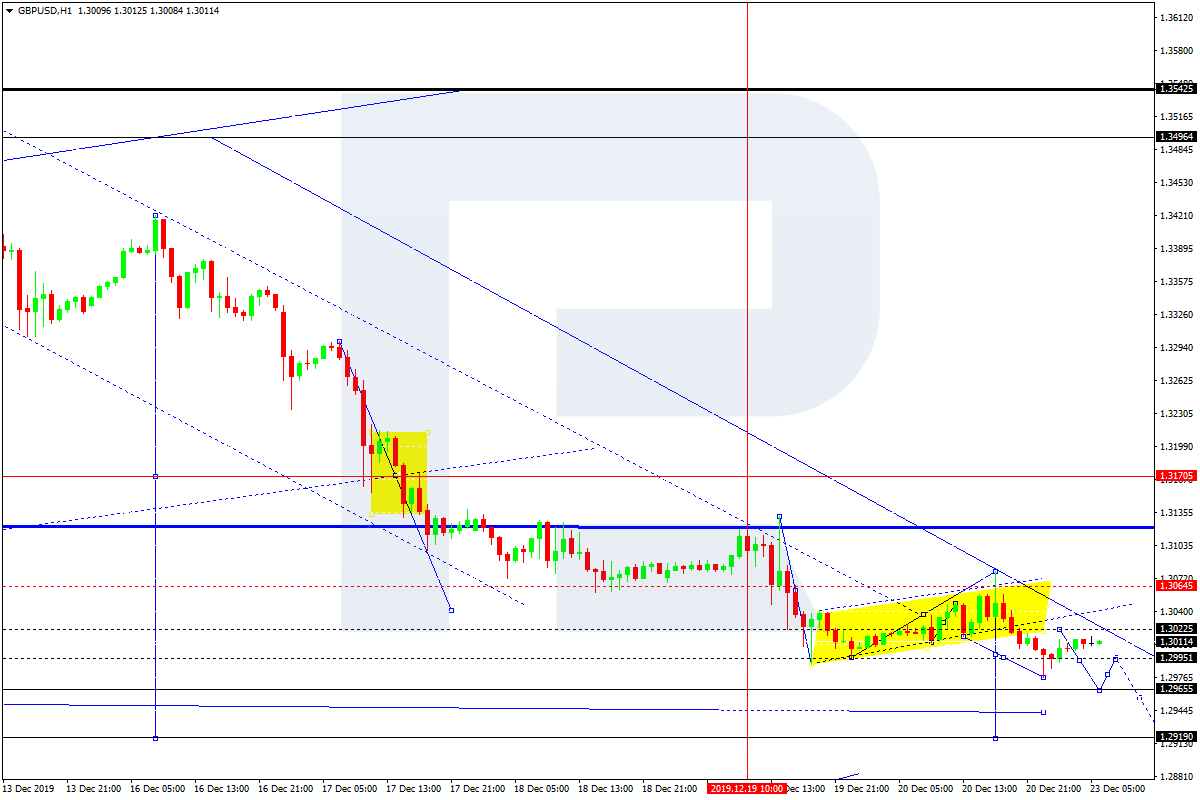
GBPUSD Could Drop to Lower Support

The cable is likely to extend declines down to the lower support level at 1.2960. If this support holds, then the currency pair might remain range-bound. A break below 1.2960 will, however, extend the declines further down. But we expect to see price action trading flat in the coming sessions.

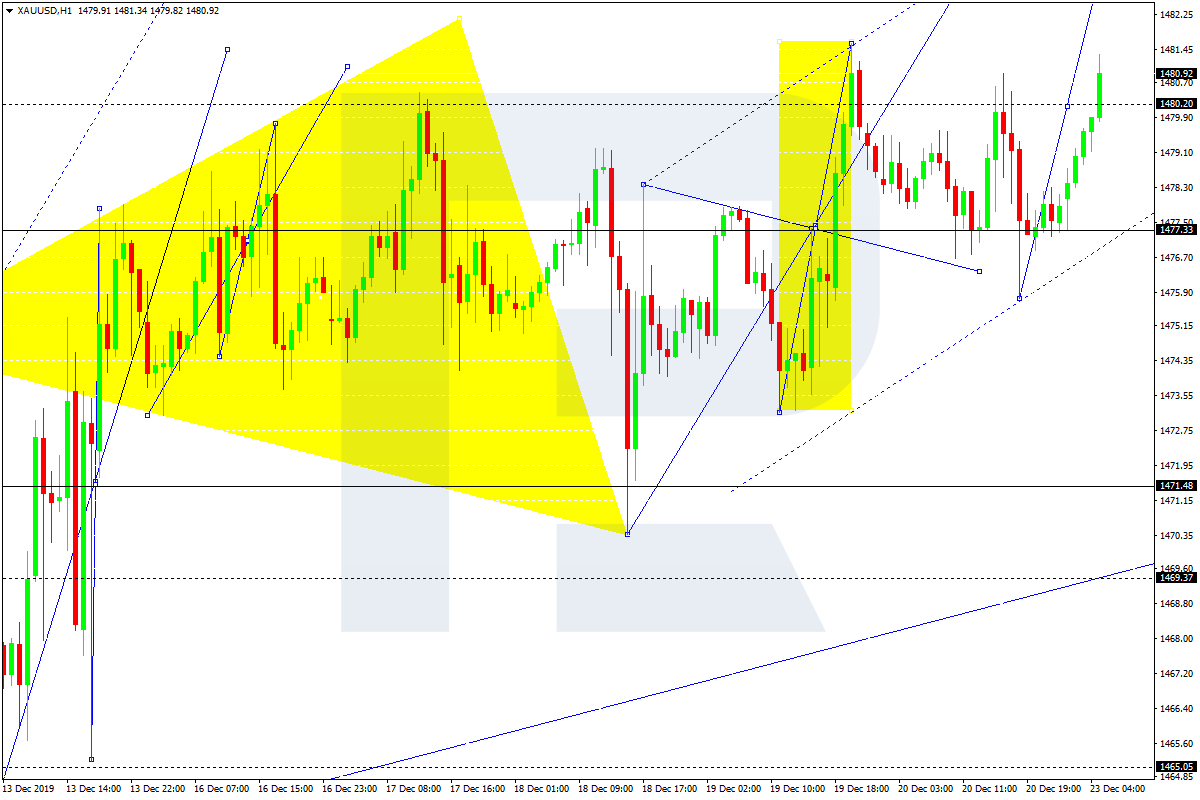
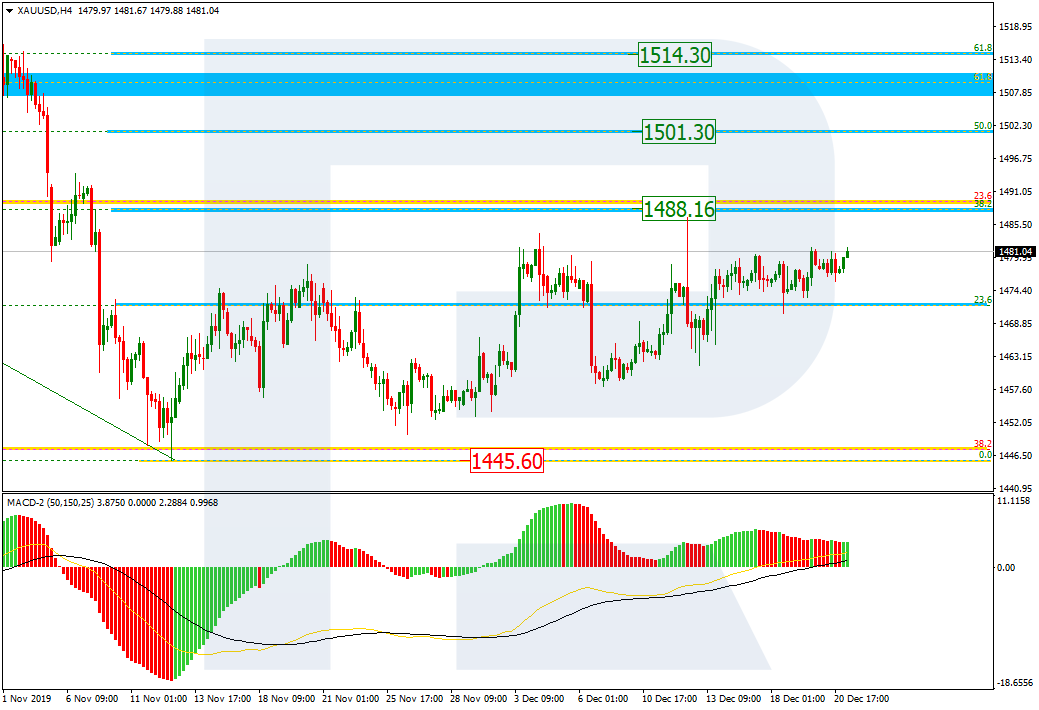
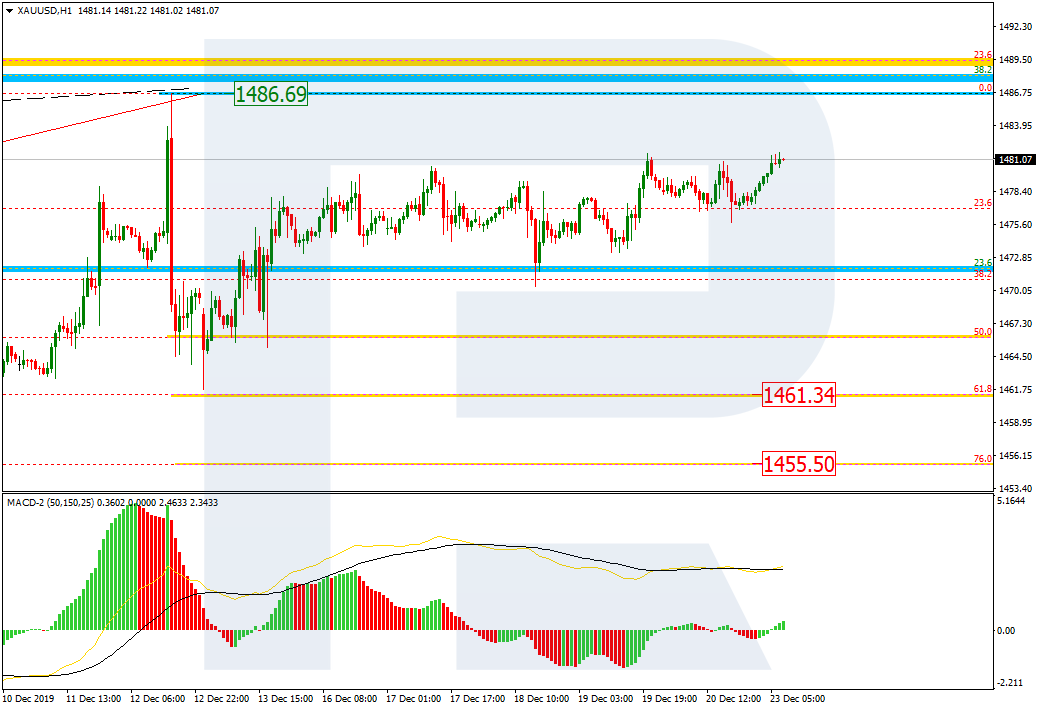
Gold Prices Trade Mixed into the Year-End

The precious metal continues its flat price action into the year-end. The positive news on the trade deal has dampened demand for the precious metal. However, we could expect to see some erratic moves in the coming sessions. Most of the markets are closed for the good part next week.

XAUUSD Could Breakout to the Upside

The bias remains to the upside for the moment with the price level of 1480 turning out to be critical. If there is a breakout above this resistance level, then we anticipate further gains. This will put the upside bias towards the 1500 level where price action could be tested. Alternately, XAUUSD will remain range-bound within the current levels.

By Orbex


Forex Technical Analysis & Forecast 23.12.2019 (EURUSD, GBPUSD, USDCHF, USDJPY, AUDUSD, USDRUB, USDCAD, GOLD, BRENT, BTCUSD)

Article By RoboForex.com

EURUSD, “Euro vs US Dollar”

After reaching the key correctional target at 1.1066, EURUSD is forming a new ascending wave towards 1.1099. After that, the instrument may resume falling to reach 1.1083 and then start another growth with the target at 1.1132.

EURUSD
Risk Warning: the result of previous trading operations do not guarantee the same results in the future

GBPUSD, “Great Britain Pound vs US Dollar”

GBPUSD has reached another downside target at 1.2980; right now, it is moving upwards to reach 1.3028. Later, the market may form a new descending structure with the target at 1.2920.

GBPUSD
Risk Warning: the result of previous trading operations do not guarantee the same results in the future

USDCHF, “US Dollar vs Swiss Franc”

After completing the ascending impulse at 0.9832, USDCHF is correcting towards 0.9802. After that, the instrument may start a new growth with the target at 0.9836.

USDCHF
Risk Warning: the result of previous trading operations do not guarantee the same results in the future

USDJPY, “US Dollar vs Japanese Yen”

USDJPY is consolidating around 109.42; right now, it is forming Triangle pattern with the target at 109.14. Later, the market may form one more ascending structure towards 109.84.

USDJPY
Risk Warning: the result of previous trading operations do not guarantee the same results in the future

AUDUSD, “Australian Dollar vs US Dollar”

AUDUSD is growing towards 0.6945. After that, the market may start a new correction to reach 0.6899 and then resume moving upwards with the target at 0.6959.

AUDUSD
Risk Warning: the result of previous trading operations do not guarantee the same results in the future

USDRUB, “US Dollar vs Russian Ruble”

After reaching 62.02, USDRUB is growing to reach 62.42. Possibly, the pair may test this from below and rebound from it. Later, the market may resume trading inside the downtrend with the target at 61.88.

USDRUB
Risk Warning: the result of previous trading operations do not guarantee the same results in the future

USDCAD, “US Dollar vs Canadian Dollar”

USDCAD has finished the ascending impulse towards 1.3171; right now, it is correcting to reach 1.3134. Possibly, the pair may reach this level and then form one more ascending structure towards 1.3157, thus forming a new consolidation range. If later, the price breaks this range to the upside, the market may start another growth with the target at 1.3200; if to the downside – resume falling to reach 1.3111.

USDCAD
Risk Warning: the result of previous trading operations do not guarantee the same results in the future

XAUUSD, “Gold vs US Dollar”

Gold is moving upwards. Possibly, the pair may expand the range up to 1484.33 and then form a new descending structure with the target at 1477.33.

GOLD
Risk Warning: the result of previous trading operations do not guarantee the same results in the future

BRENT

Brent is correcting towards 65.44. Today, the pair may reach it and then form one more ascending structure to break 66.60. After that, the instrument may continue the uptrend with the target at 67.75.

BRENT
Risk Warning: the result of previous trading operations do not guarantee the same results in the future

BTCUSD, “Bitcoin vs US Dollar”

BTCUSD is moving upwards; it has formed an upside continuation pattern at 7355.00. Possibly, today the pair may test this level from above and then resume growing with the short-term target at 7688.00. Later, the market may start a new correction to return to 7355.00 and then resume the uptrend with the key target is at 8280.00.

BITCOIN

Article By RoboForex.com

Attention!
Forecasts presented in this section only reflect the author’s private opinion and should not be considered as guidance for trading. RoboForex LP bears no responsibility for trading results based on trading recommendations described in these analytical reviews.

Fibonacci Retracements Analysis 23.12.2019 (GOLD, USDCHF)

Article By RoboForex.com

XAUUSD, “Gold vs US Dollar”

As we can see in the H4 chart, XAUUSD continues the correctional uptrend towards 38.2% fibo at 1488.16. After breaking this level, the pair may continue growing to reach 50.0% and 61.8% fibo at 1501.30 and 1514.30 respectively. After completing the correction, the instrument may break the local low at 1445.60 and continue falling towards its mid-term target, which is 50.0% fibo at 1413.85.

GOLD_H4
Risk Warning: the result of previous trading operations do not guarantee the same results in the future

In the H1 chart, after falling towards 61.8% fibo at 1461.34, the pair is forming a pullback towards the local high at 1486.69. If the instrument fails to break the high, the next descending wave will be heading towards 76.0% fibo at 1455.50.

GOLD_H1
Risk Warning: the result of previous trading operations do not guarantee the same results in the future

USDCHF, “US Dollar vs Swiss Franc”

In the H4 chart, the convergence made the pair complete the descending correctional wave at 61.8% fibo. To confirm a new rising impulse, USDCHF must break the resistance at 50.0% fibo (0.9844). After breaking this level and fixing above it, the price may grow towards the high at 1.0028. However, if the pair choose to continue falling towards 76.0% at 0.9748, it may reach the low at 0.9660 very quickly.

USDCHF_H4
Risk Warning: the result of previous trading operations do not guarantee the same results in the future

As we can see in the H1 chart, the convergence made USDCHF start a new growth, which has already reached 23.6% fibo. The next upside targets are 38.2 and 50.0% % fibo at 0.9867 and 0.9897 respectively. The support is the low at 0.9770.

USDCHF_H1

Article By RoboForex.com

Attention!
Forecasts presented in this section only reflect the author’s private opinion and should not be considered as guidance for trading. RoboForex LP bears no responsibility for trading results based on trading recommendations described in these analytical reviews.

The US Dollar Is in the Positive Zone

by JustForex

Last week, the greenback strengthened against a basket of major currencies. The dollar index (#DX) closed on Friday in the green zone (+0.33%). The United States published rather optimistic statistics and pointed to the steady growth of the country’s economy. Thus, in the third quarter, the GDP indicator (q/q) grew by 2.1%, which met experts’ expectations. On Saturday, US President D. Trump said that Washington and Beijing would soon sign the phase one trade agreement.

The Australian and New Zealand dollars rose after it became known that China would cut import duties on goods from January 1, 2020. The plan, approved by the Chinese government, provides for a reduction in duties of more than 800 types of goods imported by China from various countries. The plan also provides for an additional reduction from the beginning of next year of import duties on more than 8,000 goods from 23 countries that have a free trade agreement with China, including Australia, South Korea, Iceland, New Zealand and Pakistan.

The “black gold” prices are declining after a continuous rally. At the moment, futures for the WTI crude oil are testing the $60.35 mark per barrel.

Market Indicators

On Friday, there was a variety of trends in the US stock market: #SPY (-0.05%), #DIA (+0.00%), #QQQ (+0.40%).

The 10-year US government bonds yield has been declining. At the moment, the indicator is at the level of 1.90-1.91%.

The Economic News Feed for 23.12.2019:
  • – Durable goods orders at 15:30 (GMT+2:00);
  • – Statistics on GDP in Canada at 15:30 (GMT+2:00);
  • – New home sales in the US at 17:00 (GMT+2:00).

by JustForex

USD Significantly Strengthened

By Dmitriy Gurkovskiy, Chief Analyst at RoboForex

The major currency pair weakened pretty much at the end of last week. Early in the last full trading week of the year, EURUSD is trading at 1.1084.

Several reports published by the USA last Friday provided great support to the American currency. First of all, it’s the final GDP reading in the third quarter of 2019, which showed the same 2.1% q/q as expected without any surprise. Secondly, numbers on the Personal Income and Spending in November were quite impressive.

The Personal Income showed +0.5% m/m after adding 0.1% m/m in the previous month and against the expected reading of +0.3% m/m. Meanwhile, the Personal Spending was +0.4% m/m, the same as expected, after being +0.3% m/m the month before.

The Revised University of Michigan Consumer Sentiment increased up to 99.3 points in December against the expected reading was 99.2 points. The actual number is much higher than the November one.

Stay tuned to the RoboForex Blog for exclusive financial forecasts, professional expert analysis, how-to articles and more.

As we can see in the H4 chart, EUR/USD has reached its downside target at 1.1066. After breaking the previous descending wave’s channel, the pair may start a new rising impulse with the first target at 1.1133. Later, the market may start another correction towards 1.1099. From the technical point of view, this scenario is confirmed by MACD Oscillator: its signal line is moving above 0. The indicator is expected to leave the histogram area and grow to break 0. After that, the instrument may boost its growth on the price chart.

In the H1 chart, EUR/USD is growing with the first target at 1.1097. Later, the market may start another start a new correction towards 1.1080 and then form one more ascending structure with the short-term target at 1.1111. in fact, the price is expected to form a five-wave ascending structure. From the technical point of view, this scenario is confirmed by Stochastic Oscillator: its signal line is moving directly upwards above 50 to reach 80.

Disclaimer

Any predictions contained herein are based on the authors’ particular opinion. This analysis shall not be treated as trading advice. RoboForex shall not be held liable for the results of the trades arising from relying upon trading recommendations and reviews contained herein.


The Analytical Overview of the Main Currency Pairs on 2019.12.23

by JustForex

The EUR/USD currency pair

Technical indicators of the currency pair:
  • Prev Open: 1.11215
  • Open: 1.10785
  • % chg. over the last day: -0.39
  • Day’s range: 1.10730 – 1.10864
  • 52 wk range: 1.0879 – 1.1572

The EUR/USD currency pair went down. The trading tool has updated local lows. The demand for USD rose after optimistic US GDP data came out. Currently, EUR/USD quotes are consolidating in the range of 1.10650-1.10900. The American currency has the potential for further growth. This week, trading activity and volatility may be reduced due to the Christmas holidays. Investors expect up-to-date information regarding trade negotiations between Washington and Beijing. We recommend opening positions from key levels.

The Economic News Feed for 23.12.2019:

  • – Data on orders for durable goods (US) – 15:30 (GMT+2:00);
  • – New Real Estate Sales (US) – 17:00 (GMT+2:00);
EUR/USD

Indicators signal the power of sellers: the price has fixed below 50 MA and 100 MA.

The MACD histogram is in the negative zone but above the signal line, which gives a weak signal to sell EUR/USD.

The Stochastic Oscillator is in the neutral zone, the %K line is above the %D line, which indicates bullish sentiment.

Trading recommendations
  • Support levels: 1.10650, 1.10300
  • Resistance levels: 1.10900, 1.11100, 1.11300

If the price consolidates below 1.10650, expect the quotes to fall further toward 1.10400-1.10200.

Alternatively, the quotes could grow toward 1.11200-1.11400.

The GBP/USD currency pair

Technical indicators of the currency pair:
  • Prev Open: 1.30083
  • Open: 1.30007
  • % chg. over the last day: -0.01
  • Day’s range: 1.29865 – 1.30245
  • 52 wk range: 1.1959 – 1.3516

The GBP / USD currency pair stabilized after a significant drop last week. The pound lost in price against the US dollar more than 340 points. Currently, GBP / USD quotes are consolidating. The local support and resistance levels are: 1.29900 and 1.30650, respectively. In the near future, technical correction is not ruled out. We recommend keeping track of current information on the Brexit issue. Open positions from key levels.

The Economic News Feed for 23.12.2019 is calm.

GBP/USD

Indicators do not give accurate signals: the price is testing 50 MA.

The MACD histogram is close to the 0.

The Stochastic Oscillator is in the neutral zone, the %K line is below the %D line, which indicates a bearish sentiment.

The Stochastic Oscillator is in the neutral zone, the %K line is below the %D line, which indicates a bearish sentiment.
  • Support levels: 1.29900, 1.29500
  • Resistance levels: 1.30650, 1.31350, 1.32100

If the price consolidates below 1.29900, expect the quotes to drop toward 1.29500-1.29300.

Alternatively, the quotes could grow toward 1.31200-1.31400.

The USD/CAD currency pair

Technical indicators of the currency pair:
  • Prev Open: 1.31210
  • Open: 1.31463
  • % chg. over the last day: +0.16
  • Day’s range: 1.31400 – 1.31604
  • 52 wk range: 1.3014 – 1.3664

On Friday, December 20, the USD / CAD currency pair retreated from local lows. Looney is currently consolidating. The technical picture is ambiguous. The key range is 1.31450-1.31750. Participants in financial markets expect the release of important statistical data from the United States and Canada. We also recommend that you pay attention to the dynamics of prices of black gold. Open positions from key levels.

At 15:30 (GMT+2:00) a report on Canada will publish a GDP report.

USD/CAD

The price has fixed above 100 MA, which signals the power of buyers.

The MACD histogram is in the positive zone but below the signal line, which gives a weak signal to buy USD/CAD.

The Stochastic Oscillator is near the overbought zone, the %K line crossed the %D line. There are no signals at the moment.

Trading recommendations
  • Support levels: 1.31450, 1.31250, 1.31050
  • Resistance levels: 1.31750, 1.32000

If the price consolidates below 1.31450, USD/CAD is expected to fall toward 1.31000.

Alternatively the quotes could grow toward 1.32000-1.32200.

The USD/JPY currency pair

Technical indicators of the currency pair:
  • Prev Open: 109.364
  • Open: 109.402
  • % chg. over the last day: +0.05
  • Day’s range: 109.366 – 109.539
  • 52 wk range: 104.45 – 113.53

The USD/JPY currency pair continues to trade in a long flat. There is no defined trend. At the moment, the following local support and resistance levels can be distinguished: 109.300 and 109.500. Participants in financial markets expect additional drivers. A trading instrument has a downside potential. We recommend you to pay attention to the dynamics of the yield of US government securities. Open positions from key levels.

The Economic News Feed for 23.12.2019 is calm.

USD/JPY

Indicators do not give accurate signals: the price crossed 50 MA and 100 MA.

The MACD histogram is close to the 0 mark. There are no signals at the moment.

The Stochastic Oscillator is in the neutral zone, the %K line crossed the %D line. There are no exact signals.

Trading recommendations
  • Support levels: 109.300, 109.200, 109.000.
  • Resistance levels: 109.500, 109.700, 110.000

If the price consolidates below 109.300, expect the quotes to fall toward 109.000-108.800.

Alternatively, the quotes could grow toward 109.700-110.000.

by JustForex

EURUSD: new low needed to facilitate correction

By Alpari.com

On Friday, the EURUSD pair fell 45 points (0.4%), to 1.1075, amid a general strengthening of the US dollar and decline in the EURGBP pair. Friday’s data showed that the US economy has accelerated in the third quarter, and there are signs that the economy will maintain growth in the fourth quarter. GDP increased by 2.1% (year-on-year).

The Ministry of Commerce submitted a report concerning income and expenditure. In November, personal income rose by 0.5% after rising by a revised 0.1% in October (a 0.3% increase was forecast). Personal expenses grew by 0.4% after increasing by 0.3% in October (this indicator justified the forecast).

Today’s news (GMT+3):

  • 16:30 Canada: Gross Domestic Product (MoM) (Oct).
  • 16:30 USA: Durable Goods Orders (Nov).
  • 18:00 USA: New Home Sales (MoM) (Nov).

Рис. 1Current situation:

Expectations surrounding the weakening euro were fully justified. The price slumped to the 90th degree – 1.1069. After a long consolidation, bears were able to bring the price down. The slide accelerated once the support at 1.1110 was breached, and came to a stop on the bottom line of the downwards channel. The Gann reversal level is at 112th degree – 1.1043. In theory, today we should consider movement to counter that seen on Friday, but the cycles indicate the formation of a spike. For today’s forecast, we’ll go out on a limb to predict a fall to 1.1043, followed by a rebound up to 1.1090. For now, the value is consolidating, and we are missing the required down-wave necessary to see an upwards correction.

We also want to remind you that on Tuesday, exchanges are working on a shorter schedule. Their work will resume on Thursday. Now, before Christmas, the market has low liquidity, so unpredictable fluctuations in any direction are possible without the need for any fundamental and/or technical reasons.

By Alpari.com

Who Said Traders and Investor are Emotional Right Now?

By TheTechnicalTraders.com

Nearing the end of 2019, our research team continues to attempt to dissect the market rally in an effort to present credible research and timely insights to skilled technical traders.  We recently authored a research article discussing the potential that the US Stock market is less than 2.5% away from a major resistance level that could prompt a massive market top.  You can read our research related to these Fibonacci Price Amplitude Arcs here.

This recent research leads us to revisit the recent blow-off rotation in recent markets.  The typical market cycle moves from through these cycles Stealth Phase, the Awareness Phase, the Mania Phase and finally to the Blow-Off Phase.  The Stealth Phase is where the smart money pours into the market taking advantage of undervalued assets/equities.  The Awareness phase is where more traditional and retail investors pile into assets that have formed traditional bottom formation and started to rally.  The Mania Phase is when enthusiasm and greed take over and when the market moves higher in a parabolic price mode – ultimately reaching a massive top.  Then, we start the Blow-Off Phase which usually starts with a deep “R” type price rotation – followed by extended selling.

Before you continue, take a couple of seconds and join our free trend signals email list here.


Source: Dr. Jean-Paul Rodrigue Dept. of Global Studies & Geography Hofstra University

We’ve seen these types of market phases play out over the past 20+ years multiple times.  The DOTCOM market breakdown, the 2009 Credit Market Crisis, and the 2017 BITCOIN breakdown.  One of the clearest examples in history was the 1929 Stock Market Crash.

The effort of our research team is to highlight the recent rally mode in the US stock market after the 2018 US Stock Market rotation (January 2018 and August 2018).  If you pay very close attention to the details of these actual price rotations in the examples below, you’ll notice that every ultimate peak happened after a period of moderately deep price rotation and an extended upside price rally (an exhaustion rally).  In every example, this rotation setup the exhaustion rally which ultimately set up the massive price peak/top.

Source: Dr. Jean-Paul Rodrigue Dept. of Global Studies & Geography Hofstra University
Cole Garner: https://medium.com/hackernoon/marketcycle-4e5407d0c68

We believe the rotation in the US stock market in 2018 exhibited the exact same price setup and the current upside price rally is the exhaustion rally that will ultimately set up a massive price peak/top.  We’ve highlighted our research team’s expectations in the S&P500 chart below.

The fact that this potential price peak aligns with our GREEN Fibonacci price amplitude arc presents another clear example that massive resistance exists near 3200 in the S&P.  The phases of the extended market rally, lasting just over 10 years now, align nearly perfectly with the previous examples of major market tops and a Blow-Off Phase.

Our research team believes the resistance level near 3200 on the S&P will likely result in a downside price rotation setting up an “R” type price move.  Once this completes, a Blow-Off phase could begin rather quickly.  We believe the expansion of the markets has reached a point well past a euphoric phase and the rotation in 2018 setup the perfect exhaustion rally phase.  We believe it is just a matter of time at this point before the Blow-Off phase begins.

We would be surprised if the S&P rallied far beyond the 3200 price level before setting up the “R” price rotation.  We believe the first 3 to 5 months of 2020 will create the “R” price setup before broader market concerns take hold – potentially bursting investor enthusiasm.

All this could be the start of the next real estate crash we explain here.

Don’t miss these next moves in the markets.  Our research goes beyond traditional types of analysis and our research team is dedicated to helping you protect your assets and wealth.

In short, rotations in ETFs, such as this potential move in WOOD, will continue to set up and rotate throughout the 2020 election event and beyond we’ll keep you informed as this plays out with Wealth Building & Global Financial Reset Newsletter. Join us with the 1 or 2-year subscription to lock in the lowest rate possible and ride my coattails as I navigate these financial markets and build wealth while others lose nearly everything they own during the next financial crisis. Get a Free 1oz Silver Round or Gold Bar Shipped To You as a Bonus!

As a technical analysis and trader since 1997, I have been through a few bull/bear market cycles. I believe I have a good pulse on the market and timing key turning points for both short-term swing trading and long-term investment capital. The opportunities are massive/life-changing if handled properly.

Chris Vermeulen
Founder of Technical Traders Ltd.

TheTechnicalTraders.com

Forex Technical Analysis & Forecast 20.12.2019 (EURUSD, GBPUSD, USDCHF, USDJPY, AUDUSD, USDRUB, USDCAD, GOLD, BRENT, BTCUSD)

Article By RoboForex.com

EURUSD, “Euro vs US Dollar”

After completing another descending structure towards 1.1106 and returning to 1.1126, EURUSD is forming a new descending wave to reach 1.1104. After that, the instrument may resume growing towards 1.1116 and then start another decline with the target at 1.1098.

EURUSD
Risk Warning: the result of previous trading operations do not guarantee the same results in the future

GBPUSD, “Great Britain Pound vs US Dollar”

GBPUSD has finished another descending structure towards 1.3000; right now, it is consolidating below 1.3030. The main scenario implies that that the pair may fall towards 1.2920 and then form one more ascending structure with the target at 1.3155.

GBPUSD
Risk Warning: the result of previous trading operations do not guarantee the same results in the future

USDCHF, “US Dollar vs Swiss Franc”

After breaking 0.9797 downwards, USDCHF has reached 0.9770; right now, it is correcting to return to 0.9797. After that, the instrument may start a new decline with the target at 0.9765.

USDCHF
Risk Warning: the result of previous trading operations do not guarantee the same results in the future

USDJPY, “US Dollar vs Japanese Yen”

After breaking 109.39 and reaching the short-term target at 109.18, USDJPY has tested 109.39 from below. Possibly, the pair may form a new descending structure towards 109.14 and then start another growth with the target at 109.50.

USDJPY
Risk Warning: the result of previous trading operations do not guarantee the same results in the future

AUDUSD, “Australian Dollar vs US Dollar”

AUDUSD has reached the upside target at 0.6898. Possibly, today the pair may fall towards 0.6868 and then resume moving upwards with the short-term target at 0.6929.

AUDUSD
Risk Warning: the result of previous trading operations do not guarantee the same results in the future

USDRUB, “US Dollar vs Russian Ruble”

USDRUB moving downwards to reach 62.25. Later, the market may form one more ascending structure towards 62.60 and then resume trading inside the downtrend with the target at 62.02.

USDRUB
Risk Warning: the result of previous trading operations do not guarantee the same results in the future

USDCAD, “US Dollar vs Canadian Dollar”

USDCAD is correcting towards 1.3144. Possibly, the pair may reach this level and then form a new descending structure with the target at 1.3123. After that, the instrument may consolidate around 1.3123 and then resume falling to reach 1.3088.

USDCAD
Risk Warning: the result of previous trading operations do not guarantee the same results in the future

XAUUSD, “Gold vs US Dollar”

Gold is still consolidating around 1476.16; it has expanded the range towards 1481.25. Today, the pair may form a new descending structure towards 1477.04 and then resume trading upwards to reach 1484.33. Later, the market may start another decline with the target at 1471.48.

GOLD
Risk Warning: the result of previous trading operations do not guarantee the same results in the future

BRENT

Brent is consolidating around 66.66. Possibly, today the pair may form a new ascending wave towards 67.07. After that, the instrument may start another decline to return to 66.12 and then continue the uptrend with the target at 68.50.

BRENT
Risk Warning: the result of previous trading operations do not guarantee the same results in the future

BTCUSD, “Bitcoin vs US Dollar”

BTCUSD is correcting with the target at 7220.00. Later, the market may resume the downtrend with the short-term target is at 6900.00.

BITCOIN

Article By RoboForex.com

Attention!
Forecasts presented in this section only reflect the author’s private opinion and should not be considered as guidance for trading. RoboForex LP bears no responsibility for trading results based on trading recommendations described in these analytical reviews.

Fibonacci Retracements Analysis 20.12.2019 (BITCOIN, ETHEREUM)

Article By RoboForex.com

BTCUSD, “Bitcoin vs US Dollar”

As we can see in the daily chart, the descending tendency continues. After updating the local low, BTCUSD has returned to 61.8% fibo. Considering the convergence on MACD, this movement may be described as a short-term correction. The resistance is 50.0% fibo at 8490.00. After completing the correction, the pair may resume falling towards the target at 76.0% (5700.00). The key mid-term downside target is the low at 3121.90.

BTCUSD
Risk Warning: the result of previous trading operations do not guarantee the same results in the future

The H4 chart shows more detailed structure of the current local correction. By now, the pair has managed to reach 23.6% fibo; at the moment, the price is trading close to this level. The next rising impulse may later continue towards 38.2% and 50.0% fibo at 7995.00 and 8480.00 respectively. If the price breaks the local support at 6430.30, the correction will be over.

BITCOIN
Risk Warning: the result of previous trading operations do not guarantee the same results in the future

ETHUSD, “Ethereum vs. US Dollar”

As we can see in the daily chart, the downtrend has broken 76.0% fibo; right now, ETHUSD is heading towards this year’s low at 80.86 and must break a psychologically-crucial of 100.00 on its way. The resistance is 61.8% fibo at 189.00.

ETHUSD_D1
Risk Warning: the result of previous trading operations do not guarantee the same results in the future

The H4 chart shows more detailed structure of the current correction, which is getting close to 100.00. At the same time, there is a convergence on MACD, which may indicate a new pullback soon.

ETHEREUM_H4

Article By RoboForex.com

Attention!
Forecasts presented in this section only reflect the author’s private opinion and should not be considered as guidance for trading. RoboForex LP bears no responsibility for trading results based on trading recommendations described in these analytical reviews.