By IFCMarkets
Sideways trading
Today we would like to focus your attention to Personal Composite Instrument (PCI) &BRENT_RUB, i.e. Brent crude oil to Russian ruble on the H4 chart. They are highly interconnected because Russia is the third largest oil producer after Saudi Arabia and the United States. The share of hydrocarbons in the country’s exports is 73%. When Brent crude oil price (denominated in USD) advances, as a rule, Russian ruble is sagging on the USD/RUB chart. This means that it is strengthening against the US dollar. You can implement the &BRENT_RUB PCI downloaded from our website in NetTradeX.
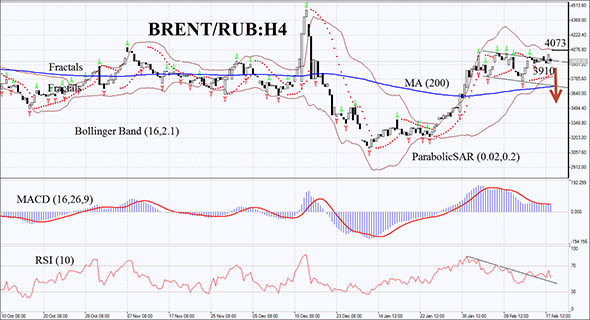
BRENT/RUB has formed the graphic pattern called “flag” on the H4 chart, and the price is currently located next to its upper boundary. Since the two assets of this PCI are highly correlated, they are mainly traded sideways. Therefore, we don’t expect a strong bullish momentum. BRENT/RUB will most likely return to its long-term moving average (200). There is a decline in volatility on the MACD chart. The histogram is below the signal line, which can be considered a bearish signal. There is a timid bearish divergence on the RSI chart. Bollinger Bands indicator shows narrowing. Further development of the bearish momentum is not ruled out after the fractal resistance breakout at 3910. This mark can be used for placing a pending sell order. Stop loss may be placed at the top line of Bollinger Bands indicator, which can currently act as a resistance line – 4073. After pending order placing, Stop loss is to be moved every four hours near the next fractal high, following Parabolic and Bollinger signals. Thus, we are changing the probable profit/loss ratio to the breakeven point. If the price meets Stop loss level without reaching the order, we recommend canceling the position: market sustains internal changes that were not considered.
| Position | Sell |
| Sell stop | below 3910 |
| Stop loss | above 4073 |
Dear traders. For the detailed report of the strategy based on analytical issues of technical analysis click here.
Market Analysis provided by IFCMarkets
Free Reports:
 Get Our Free Metatrader 4 Indicators - Put Our Free MetaTrader 4 Custom Indicators on your charts when you join our Weekly Newsletter
 Get our Weekly Commitment of Traders Reports - See where the biggest traders (Hedge Funds and Commercial Hedgers) are positioned in the futures markets on a weekly basis.