Article By RoboForex.com
Analysis for October 6th, 2014
EUR USD, “Euro vs US Dollar”
The H4 chart of EUR USD shows a sideways correction within the downtrend. Three Line Break chart indicates the downtrend; Heiken Ashi candlesticks confirm an ascending movement.

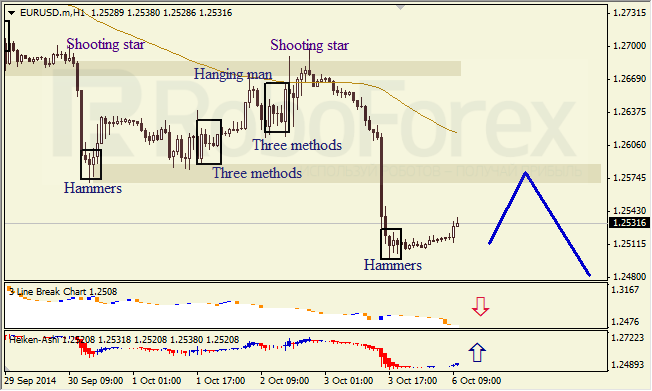
The H1 chart of EUR USD shows a correction, which is indicated by Hammers pattern. Three Line Break chart indicates the downtrend; Heiken Ashi candlesticks confirm an ascending correction.
USD JPY, “US Dollar vs Japanese Yen”
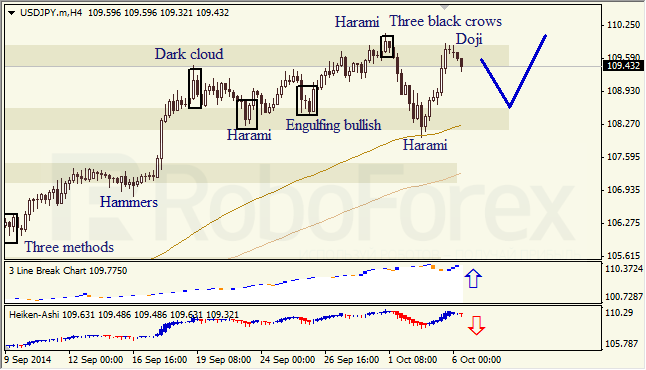
The H4 chart of USD JPY shows a sideways correction. Doji pattern indicates a descending movement. Three Line Break chart shows the uptrend; Heiken Ashi candlesticks confirm an ascending movement.
RoboForex Analytical Department
Free Reports:
 Get Our Free Metatrader 4 Indicators - Put Our Free MetaTrader 4 Custom Indicators on your charts when you join our Weekly Newsletter
 Get our Weekly Commitment of Traders Reports - See where the biggest traders (Hedge Funds and Commercial Hedgers) are positioned in the futures markets on a weekly basis.
Article By RoboForex.com
Attention!
Forecasts presented in this section only reflect the author’s private opinion and should not be considered as guidance for trading. RoboForex LP bears no responsibility for trading results based on trading recommendations described in these analytical reviews.
