By IFCMarkets
Good afternoon, dear traders. Today at 14:30 CET we expect the release of the key long-term US economic indicator, Core retail sales. The index is published monthly by the US Department of Commerce and indicates the relative volume change in retail sales of all commodities, except for cars, which make up 20% of the trading volume. Core retail sales is a monthly measurement of all the goods sold by retailers, based on sampling of retail stores of different types in the United States. Thus, this indicator defines consumer confidence and represents a significant interest for investors. We also recommend to pay attention to the new EU sanctions imposed against the Russian banking, oil and defense sectors. It should be noted that this increases the probability of a disproportionate response on the part of Russia regarding the EU. This is why the long-term outlook for euro remains in question, and risks should be monitored very carefully. However, today we expect the released Core retail sales would bring the main volatility momentum and can have a significant impact on the price of the instrument EUR/USD.
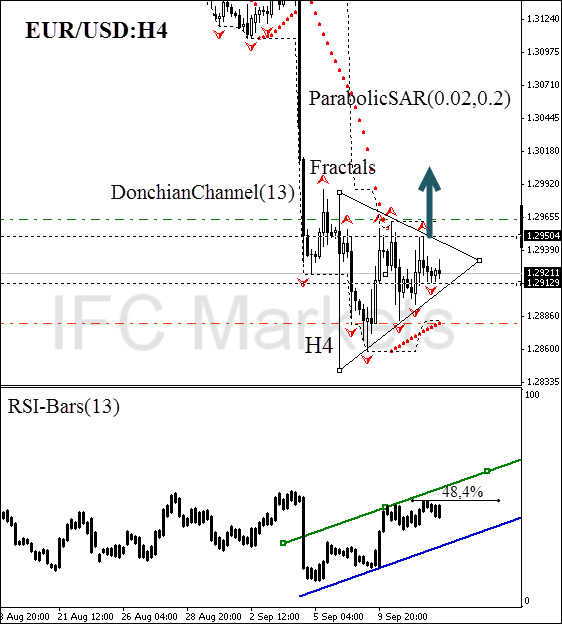
Here we consider the H4 price chart of the given currency pair. After an abrupt falloff, due to the ECB rate reduction, we can see the price consolidation within the H4 triangle. The graphic model is shifted towards the green area, which suggests a more probable movement direction. ParabolicSAR and RSI-Bars oscillator confirm the direction. Let us remind you that in terms of the sideways trend, the oscillator provides the most correct signals. To be absolutely sure in the movement direction, it is recommended to wait for the upward breach of the RSI-Bars level at 48.4%. In our opinion, it will happen at the same time with the fractal resistance intersection at 1.29504. This mark can be used for placing a pending buy order. Risks can be limited by the fractal support at 1.29129. However, more conservative traders can expand their understanding of the potential volatility. A more secure position corresponds to the mark at 1.28860. It is confirmed by Parabolic historical values and the bottom of the DonchianChannel.
After position opening, Trailing Stop is to be moved after the ParabolicSAR values, near the next fractal trough. Updating is enough to be done every day after the formation of 5 new H4 candlesticks, needed for the Bill Williams fractal formation. Thus, we are changing the probable profit/loss ratio to the breakeven point.
| Position | Buy |
| Buy stop | above 1.29504 |
| Stop loss | below 1.29129 |
Dear traders. You can see the detailed report of the author’s account by clicking here.
Market Analysis provided by IFCMarkets
Free Reports:
 Get Our Free Metatrader 4 Indicators - Put Our Free MetaTrader 4 Custom Indicators on your charts when you join our Weekly Newsletter
 Get our Weekly Commitment of Traders Reports - See where the biggest traders (Hedge Funds and Commercial Hedgers) are positioned in the futures markets on a weekly basis.