Article By RoboForex.com
Analysis for July 1st, 2014
DJIA Index
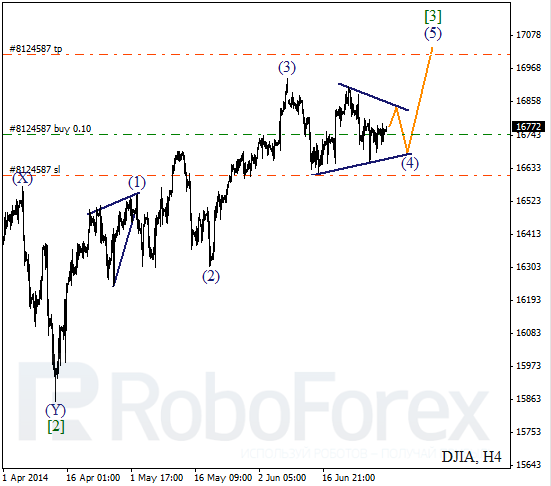
Index is still consolidating and forming horizontal triangle pattern inside the fourth wave. In the future, price is expected to rebound from the pattern’s lower border and start new ascending movement inside wave (5) of [3].
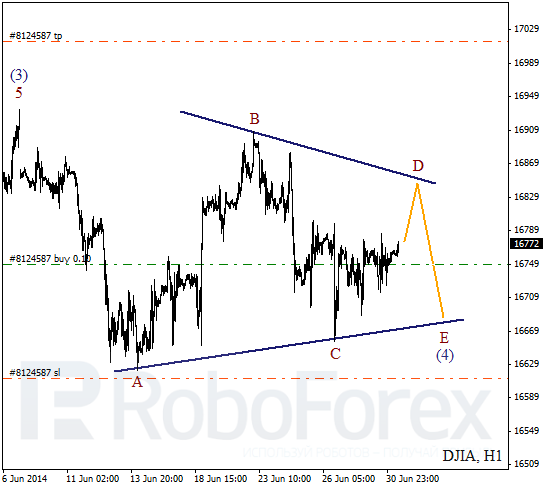
As we can see at the H1 chart, price is forming wave C inside triangle pattern. During Tuesday, price may show local growth, but later it is expected to start falling down inside wave E of (4).
Crude Oil
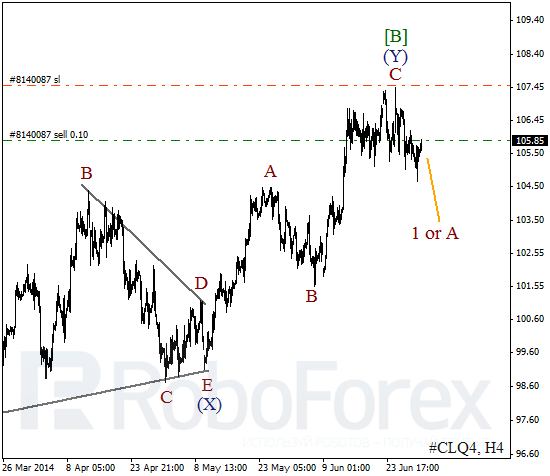
It looks like Oil is reversing downwards. After finishing wave C of (Y), price started forming initial bearish impulse inside wave 1 or A. I’ve opened another sell order with stop loss placed at latest high.
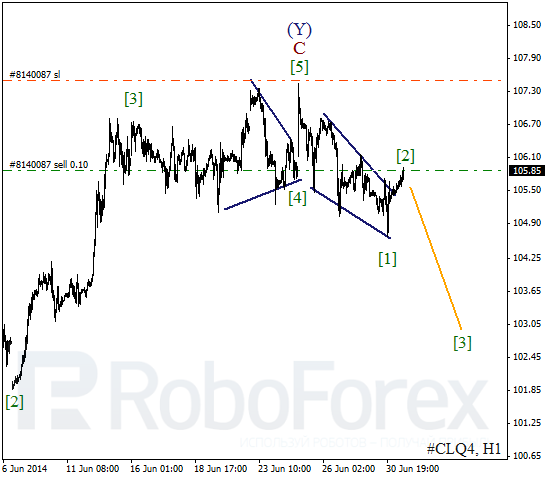
More detailed wave structure is shown on H1 chart. Probably, yesterday price formed wedge pattern inside wave [1]. After completing local correction inside wave [2], instrument is expected to start moving downwards inside the third wave.
Free Reports:
 Get Our Free Metatrader 4 Indicators - Put Our Free MetaTrader 4 Custom Indicators on your charts when you join our Weekly Newsletter
 Get our Weekly Commitment of Traders Reports - See where the biggest traders (Hedge Funds and Commercial Hedgers) are positioned in the futures markets on a weekly basis.
RoboForex Analytical Department
Article By RoboForex.com
Attention!
Forecasts presented in this section only reflect the author’s private opinion and should not be considered as guidance for trading. RoboForex LP bears no responsibility for trading results based on trading recommendations described in these analytical reviews.