Article By RoboForex.com
BTCUSD, “Bitcoin vs US Dollar”
In the H4 chart, after reaching the long-term retracement of 38.2% at 8520.00, BTCUSD started a new pullback to the downside, which has already reached the retracement of 23.6%. The next downside targets may be the retracements of 38.2% and 50.0% at 6445.00 and 5849.00 respectively. After finishing this pullback, the price may resume trading upwards. If the instrument breaks the high at 8365.70, the pair may continue growing to reach the retracements of 38.2% and 50.0% at 8520.00 and 10170.00 respectively.


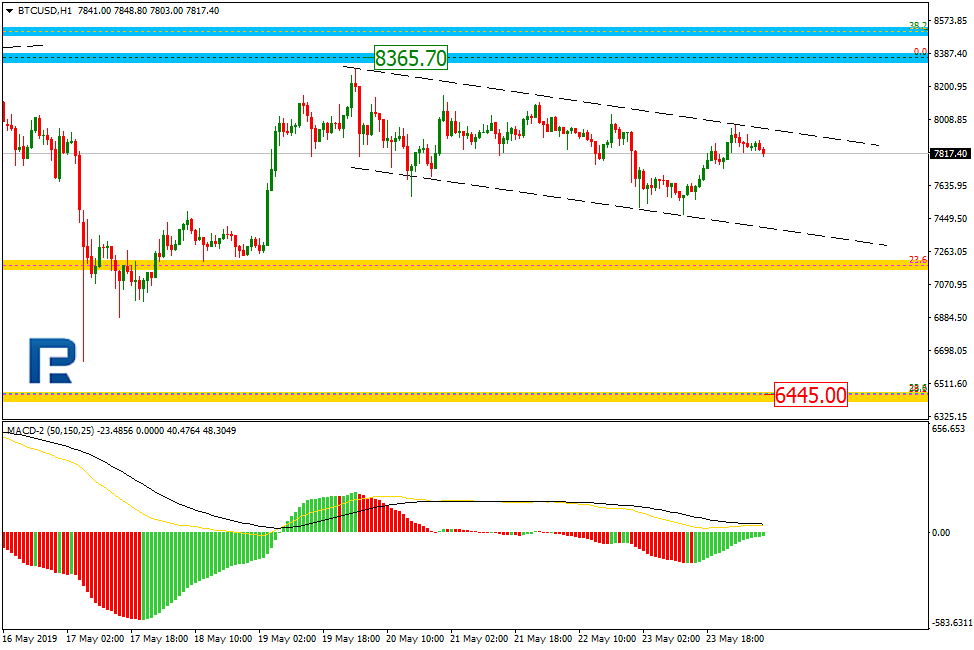
In the H1 chart. BTCUSD is trading downwards to re-test the retracement of 23.6%. if the price breaks it, the instrument may continue falling towards the retracement of 38.2%.
ETHUSD, “Ethereum vs. US Dollar”
As we can see in the H4 chart, ETHUSD is forming another correction to the downside, which has already reached the retracement of 38.2%. The next targets may be the retracements of 50.0% and 61.8% at 213.13 and 197.52 respectively. After finishing the correction, the instrument may start a new rising wave to break the high at 279.90.
Free Reports:
 Get Our Free Metatrader 4 Indicators - Put Our Free MetaTrader 4 Custom Indicators on your charts when you join our Weekly Newsletter
 Get our Weekly Commitment of Traders Reports - See where the biggest traders (Hedge Funds and Commercial Hedgers) are positioned in the futures markets on a weekly basis.

The H1 chart shows more detailed structure of the correction.

Article By RoboForex.com
Attention!
Forecasts presented in this section only reflect the author’s private opinion and should not be considered as guidance for trading. RoboForex LP bears no responsibility for trading results based on trading recommendations described in these analytical reviews.