Article By RoboForex.com
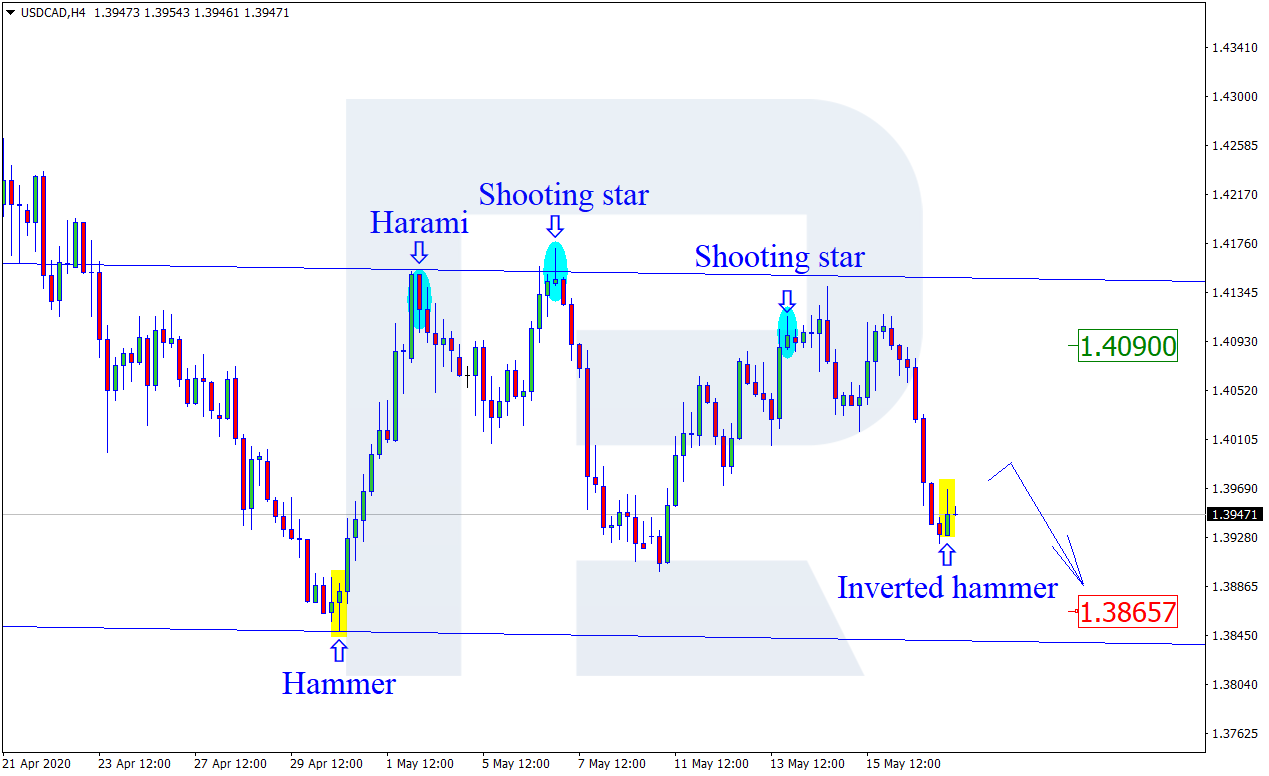
USDCAD, “US Dollar vs Canadian Dollar”
As we can see in the H4 chart, the descending tendency continues. By now, USDCAD has formed an Inverted Hammer pattern not far from the support level. However, the pair is not expected to reverse. Probably, the price may correct for a while and then resume falling towards 1.3865. Later, after testing it, the market may form a reversal pattern and rebound from the above-mentioned level.

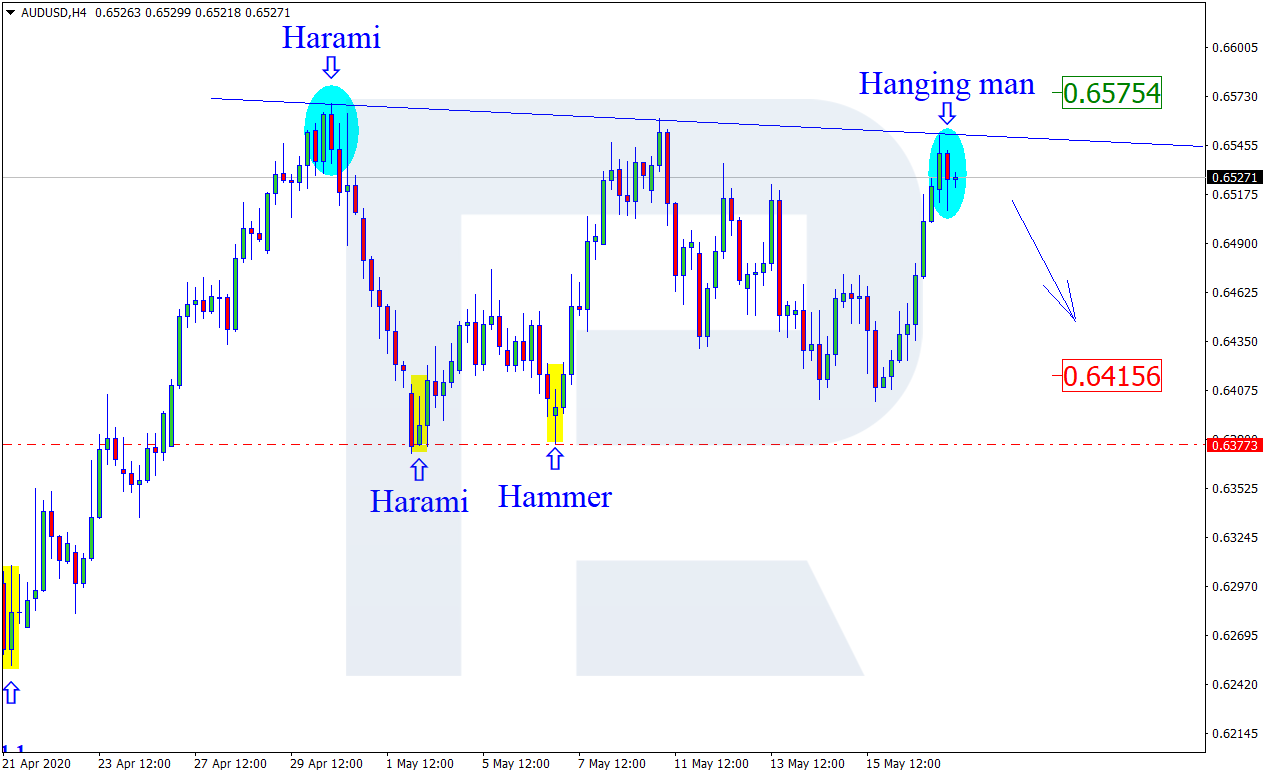
AUDUSD, “Australian Dollar vs US Dollar”
As we can see in the H4 chart, after returning to the resistance level, AUDUSD has formed a Hanging Man pattern. Later, the pair may reverse and rebound from this level. In this case, the downside target may be the support level at 0.6415. In case of further growth, the upside target may be at 0.6575.
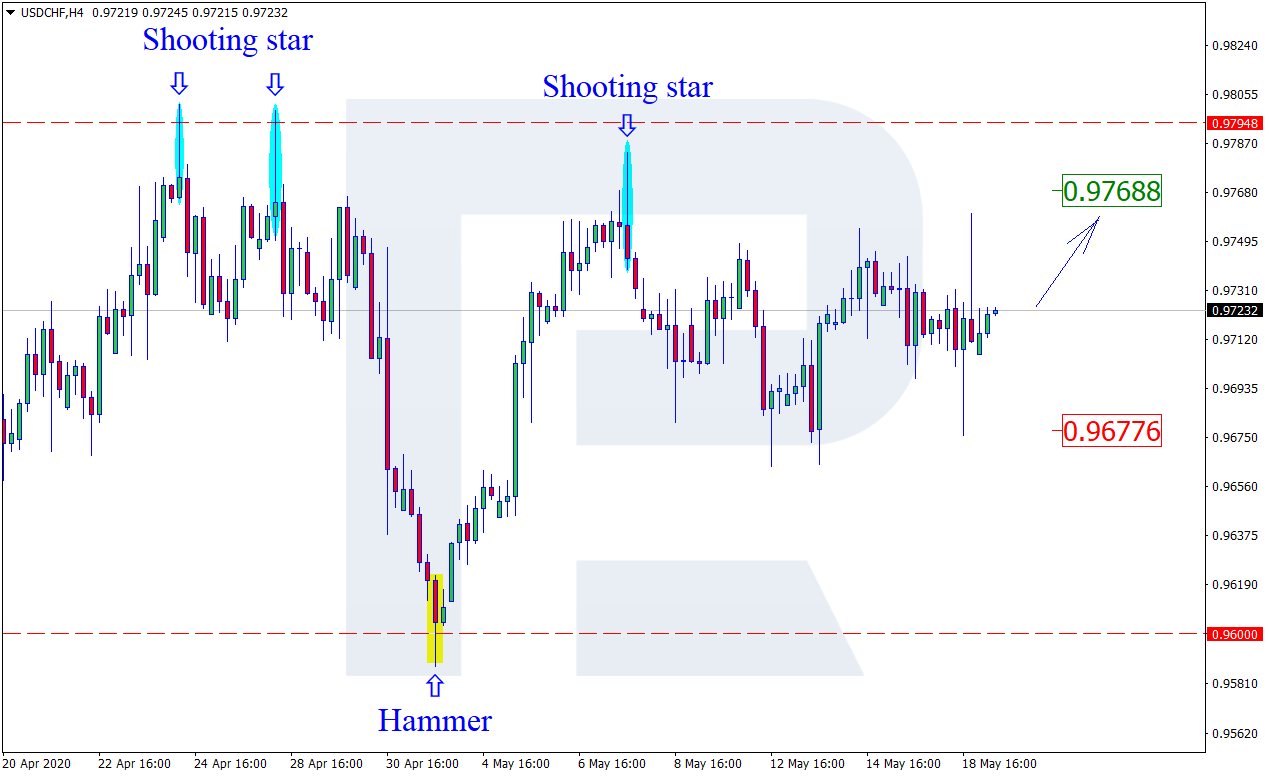
USDCHF, “US Dollar vs Swiss Franc”
Free Reports:
 Get Our Free Metatrader 4 Indicators - Put Our Free MetaTrader 4 Custom Indicators on your charts when you join our Weekly Newsletter
 Get our Weekly Commitment of Traders Reports - See where the biggest traders (Hedge Funds and Commercial Hedgers) are positioned in the futures markets on a weekly basis.
As we can see in the H4 chart, USDCHF continues trading sideways inside a horizontal channel. So far, there are no reversal patterns. The upside target remains at the resistance level at 0.9768. The downside may be the support level at 0.9677.
Article By RoboForex.com
Attention!
Forecasts presented in this section only reflect the author’s private opinion and should not be considered as guidance for trading. RoboForex LP bears no responsibility for trading results based on trading recommendations described in these analytical reviews.