By IFCMarkets – Rising Brazil output bearish for coffee price
Coffee production in Brazil is forecast to rise this year. Will the coffee prices continue falling?
Brazilian farmers are expected to produce a record coffee crop in 2020. Brazil, world’s largest producer of coffee, produced a record 62.6 million bags in 2018, followed by 57.6 million bags in 2019. Analysts forecast increasing Brazil production for 2020. Thus, the Dutch bank Rabobank forecast a 2020 output at 66.7 million 60-kg bags a month ago, and the research arm of the University of São Paulo – Cepea, forecast “slightly” more than 60 mln bags a few days ago. Expectations of higher output by world’s top coffee producer is bearish for coffee. However International Coffee Organization forecast last month that world coffee production in 2019-20 marketing year will decline, resulting in a shortage of around 502,000 bags of coffee. Yesterday the ICO report stated global coffee output is estimated at 168.71 million bags in 2019/20, 0.9% lower than last year. A 4.1% decline in arabica production was stated as the main reason. Expectations of lower global production are an upward risk for coffee price.
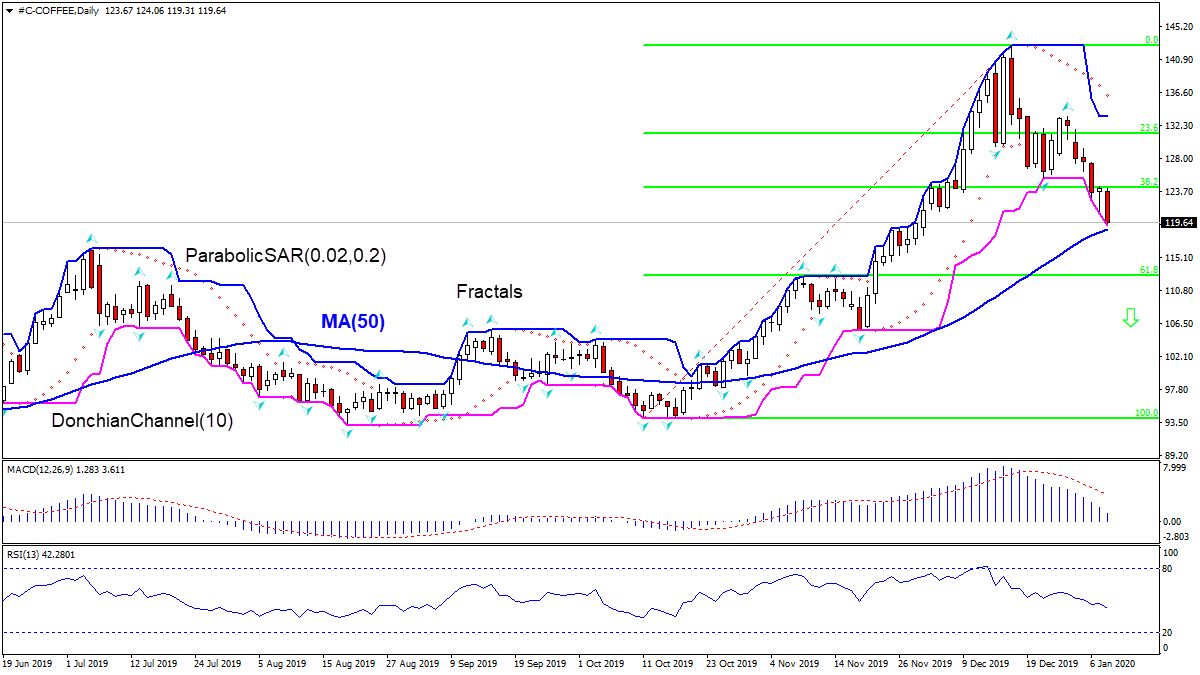
On the daily timeframe the COFFEE: D1 is about to test the 50-day moving average MA(50) which is rising. Price has breached below Fibonacci 38.2 support level.
- The Parabolic indicator gives a sell signal.
- The Donchian channel indicates downtrend: it is widening down.
- The MACD indicator gives a bearish signal: it is above the signal line and the gap is narrowing.
- The RSI oscillator is falling but has not reached the oversold zone.
We believe the bearish momentum will continue as the price breaches below the lower Donchian boundary at 119.31. A pending order to sell can be placed below that level. The stop loss can be placed above the upper Donchian boundary at 133.50. After placing the order, the stop loss is to be moved every day to the next fractal high, following Parabolic signals. Thus, we are changing the expected profit/loss ratio to the breakeven point. If the price meets the stop loss level (133.50) without reaching the order (119.31), we recommend cancelling the order: the market has undergone internal changes which were not taken into account.
Technical Analysis Summary
| Order | Sell |
| Sell stop | Below 119.31 |
| Stop loss | Above 133.50 |
Market Analysis provided by IFCMarkets
Free Reports:
 Get Our Free Metatrader 4 Indicators - Put Our Free MetaTrader 4 Custom Indicators on your charts when you join our Weekly Newsletter
 Get our Weekly Commitment of Traders Reports - See where the biggest traders (Hedge Funds and Commercial Hedgers) are positioned in the futures markets on a weekly basis.