December 16, 2019
By IFCMarkets
Slowing UK private sector activity bearish for GBPUSD
UK composite PMI decline accelerated in December. Will the GBPUSD decline?
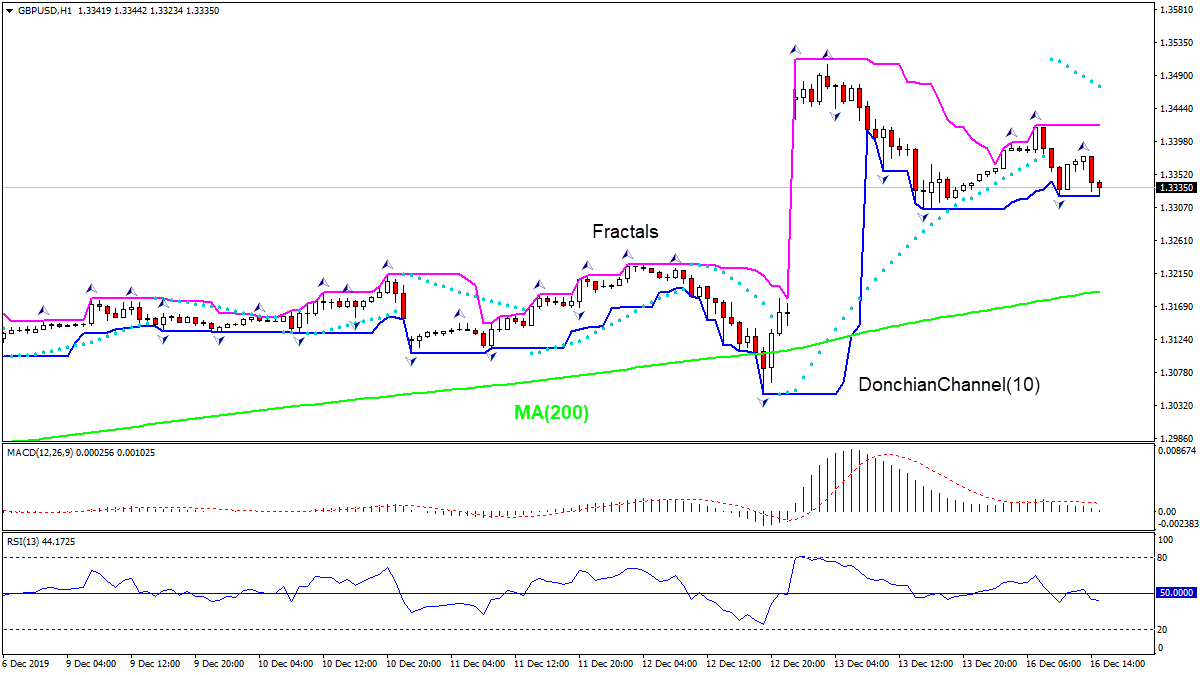
The price chart on 1-hour timeframe shows GBPUSD: H1 is trading sideways. The price is falling toward the 200-period moving average MA(200) which is rising. And the RSI oscillator is below 50 level but has not reached the oversold zone. There is no trend yet formed, traders have to decide when it would be a best time to enter the market.
Market Analysis provided by IFCMarkets