Each technical trader applies different trading methods. But still, thousands of strategies can be divided into several main categories. Some traders who trade under Price action, there are those who trade with indicators, and there are traders who use Price Action and indicators at the same time.
Price action is one of the easiest to learn and one of the most effective ways of price direction predicting. If you are just starting to trade, then Price action trading can be an excellent starting point.
What is Price Action
Price Action is a trading system, following which all trading decisions are made by analyzing the net price chart. It means the complete absence of any lagging indicators, except for moving averages that help to identify the trend and dynamic support/resistance levels.
The Price Action trader believes that the only correct source of information is the price itself. If an asset goes up, such a trader sees that other market participants buy it. After that, he, depending on the aggressiveness of these purchases, tries to understand whether the movement will continue.
Free Reports:
Price Action pros and cons
Since decisions while trading are made by analyzing the Forex price chart, the system gives you the freedom to choose. That is, you do not depend on any external factors, such as indicators, news, or anything else. After you have studied some Price Action strategy, further analysis will not take much time. You find an asset with certain pricing conditions that you need or you are waiting for these conditions to form.
Another advantage is that such a trader can get more favourable entry and exit points compared to strategies based on indicators. The fact is that the indicators are calculated on the basis of price, but have a delay in relation to it. By focusing simply on price, you get information in real time and do not wait until it is provided by an indicator that is late.
The disadvantage is that Price Action strategies are usually difficult to automate. It means that you have to sit and wait for the formation of graphical models, and then trade them manually. For most people, this is not a problem.
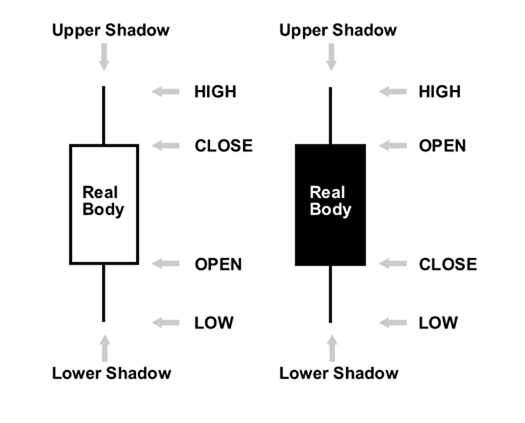
How to read candlesticks
Candlesticks are a type of price chart, along with Lines and Bars. Reading the candlestick chart is a necessary skill for every trader because this is the most popular analysis method.
Candlesticks mean the following: each candle is essentially a distance that the price has covered over a certain period of time, which is called a timeframe. So, on an hour timeframe, each candle will display the distance that the price has gone for 1 hour, on the minute one – per minute and so on.
How to read candles:
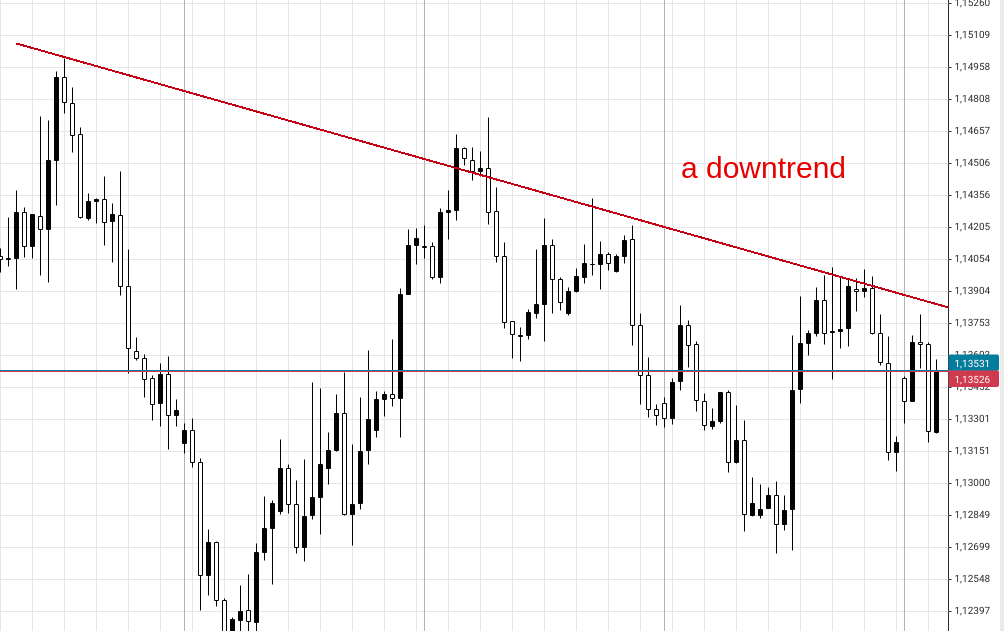
When the market moves in one direction from left to right on the chart up or down, this is a market trend. And what is the trend in general? It is a market consensus, the sentiment of market participants. There are three types of trends.
Trend lines are lines drawn at an angle above or below the price. They serve to designate the trend that is currently developing, as well as to determine the moment of its reversal. Besides, they can be used as support and resistance levels, thereby determining the points of opening and closing positions.
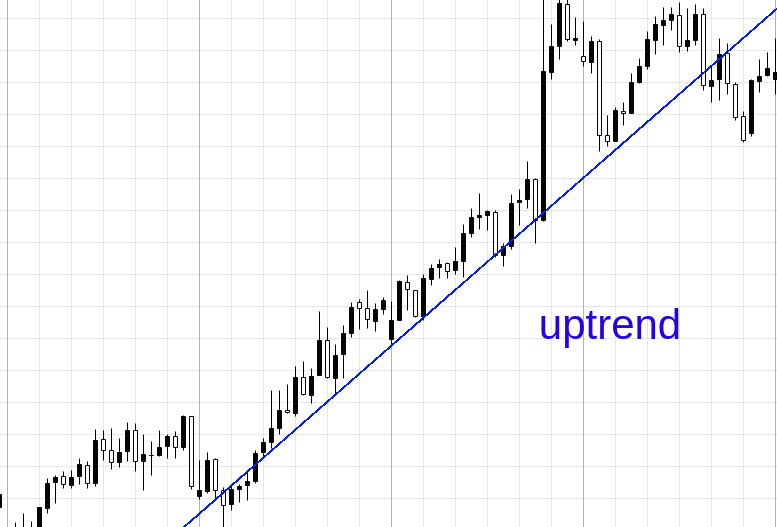
On a downtrend, trend lines are drawn above the price. On an uptrend, trend lines are drawn below the price. On the downtrend, they are held on the highs, and on the uptrend – on the lows.
To draw a trend line, there should be at least two highs at different levels or two different lows on the chart. However, the trend line will be reliable if there are at least three highs or lows on the chart.
Moving averages is a trend indicator that helps to find a trend, its beginning and end. It works perfectly when there is a certain trend in the market and not so much when the market is in a flat or has no unidirectional movement.
Due to the fact that it makes a calculation based on past data, points for entry and exit usually arise with a delay, but you can choose the optimal settings and minimize the number of false signals and solve the problem of delay.
To change the reaction rate of a moving average to the price change, a smoothed period is used. It takes into account the number of bars for which the average value is calculated.
For example, on the H1 timeframe each bar corresponds to one hour, therefore, MA with a period of 24 will display the average equalized value of prices per 24 hours, that is, per day. For the trading week period will be 120 (24×5).On higher timeframes, as a rule, false signals occur less frequently. They will be delayed, but more reliable.
Zigzag movements of quotes periodically rest against certain highs and lows, from which the curve of the chart turns back and begins to move in the opposite direction. The price at some points seems to resist further growth or receives support during a fall. From here is the name.
These levels are considered to be the most important elements of technical analysis in Forex. Here three main axioms are clearly visible:
To determine the levels of support and resistance, you should find the points at which the price movement constantly stops. It is at these points that either buyers or sellers enter the market.
When the price first breaks through the resistance level but then rolls back, this situation is called a false breakout.
If you want to enter the market with a long position, when the price breaks through the resistance level, then in order to avoid a false breakout, it is recommended to wait until the resistance level becomes the support level. Similarly, if you want to enter the market with a short position when the price breaks through the support level, then to avoid a false breakout, it is recommended to wait until the support level becomes the resistance level.
Note! Support and resistance are subjective. Every trader sees support and resistance levels in his own way. It is easy to identify a lot of support and resistance levels at which price reversals can occur. However, the choice of the most optimal level comes with practice.
In trading, the term “Fibonacci” means a tool that measures the price movement and on the basis of this exposes horizontal support and resistance levels on the price chart. Fibonacci levels are used to determine price pullbacks. That is if we see a price impulse, but do not want to join it right now, but we want to do it “at a good price”, that is, to start moving during a price pullback.
The basic idea of trading with Fibonacci levels is to open a long position at pullback from the Fibonacci support line, and a short position should be opened at downward pullback from the Fibonacci resistance level when the market falls.
If you want to apply Fibonacci levels on the chart, then click in the terminal on the “Draw Fibonacci retracement” button in the upper left corner. To determine the levels of the Fibonacci system, you need to find the recent significant highs and lows of the last price oscillation. Then, for a downtrend, click on the high and drag the Fibonacci lines to the low. For the uptrend, you need to do the opposite. Click on the minimum price fluctuation and drag the cursor to the maximum.
Speaking of Price Action, it is impossible not to mention the patterns of this technique. Let’s look at just a few of the most popular patterns that will allow you to get a general idea of the Price Action methods.
Pin bar is a reversal setup used in the Price Action trading system without indicators. That is, the occurrence of pin bars most often means that the trend will turn back soon. At the same time, it does not matter whether this trend will be bullish or bearish.
Pin bar is one single bar or candle, signalling a change in the current trend. Here are the necessary conditions for the appearance of the pin bar figure:
It should be noted that the color of the candle or bar does not matter. It can be either a bullish bar or a bearish bar.
Inside Bar is formed on the chart of two or more candles (bars), the first of which is decisive (or formative), and the others are directly internal. At the same time, internal candles should be located completely within the framework of the forming candle, without going beyond it.
The appearance on the chart of such a candlestick pattern is a signal of price uncertainty, after which both a continuation of the current trend and its change can follow. However, it is possible and necessary to trade with such a figure, but the entry into the transaction is carried out after confirming of the price movement in a certain direction.
Unlike the Inside Bar that signals uncertainty, the Outside Bar is a reversal pattern. It consists of two bars, which are located on the extremes of the chart.
A pattern can be identified when the color of the first bar corresponds to the direction of the previous price movement (if the price rises, it will be bullish, if it falls, it will be bearish).
The second bar corresponds to the opposite trend (if there was growth before the pattern formation, then the second bar will be bearish if the fall – bullish) and is larger than the previous one.
It is important that the bearish bar is formed at the top of the upward movement, and the bullish – at the downward one. However, it should be noted that in case of a sideways trend, the appearance of a similar model is not a trading signal and it shouldn’t be considered.
Price Action is considered to be one of the most popular trading systems on Forex. Price Action trading is usually carried out on a daily timeframe, that almost eliminates the occurrence of false signals, and also reduces the time for technical analysis. This strategy is based on the behaviour of prices and does not require the use of additional indicators. Finally, Price Action is a really working trading system with which you can start making good money.
Of course, in this article, we have touched upon not all the issues that could be told about the Price Action methodology. It is worth exploring this technique more deeply for success in the Forex market.
This article was brought to you by JustForex. Our traders enjoy spreads from 0 pips, exclusive daily analytics, and relevant strategy guides. If you like what you read and would like to start trading with a reliable broker and get 100% bonus — check out JustForex.com.