By IFCMarkets
The British economy showed an increase
Good macroeconomic data were published in the UK. Is there a possibility for the pound to rise?
The growth of British GDP in the 3rd quarter of 2018 was 0.6% (quarter over quarter) and was the maximum since the 4th quarter of 2016. In annual terms, it increased by 1.5%. Retail sales in November of the current year were better than expected. The Bank of England kept the rate at the level of 0.75% and noted that it expects a further decrease in inflation due to falling oil prices and the cost of fuel. Now inflation in the UK is at a 20-month low and is 2.3%. By the end of this year, no significant macroeconomic statistics is expected to be published. On January 7, 2019, the UK and the European Union can begin a new round of negotiations on Brexit.
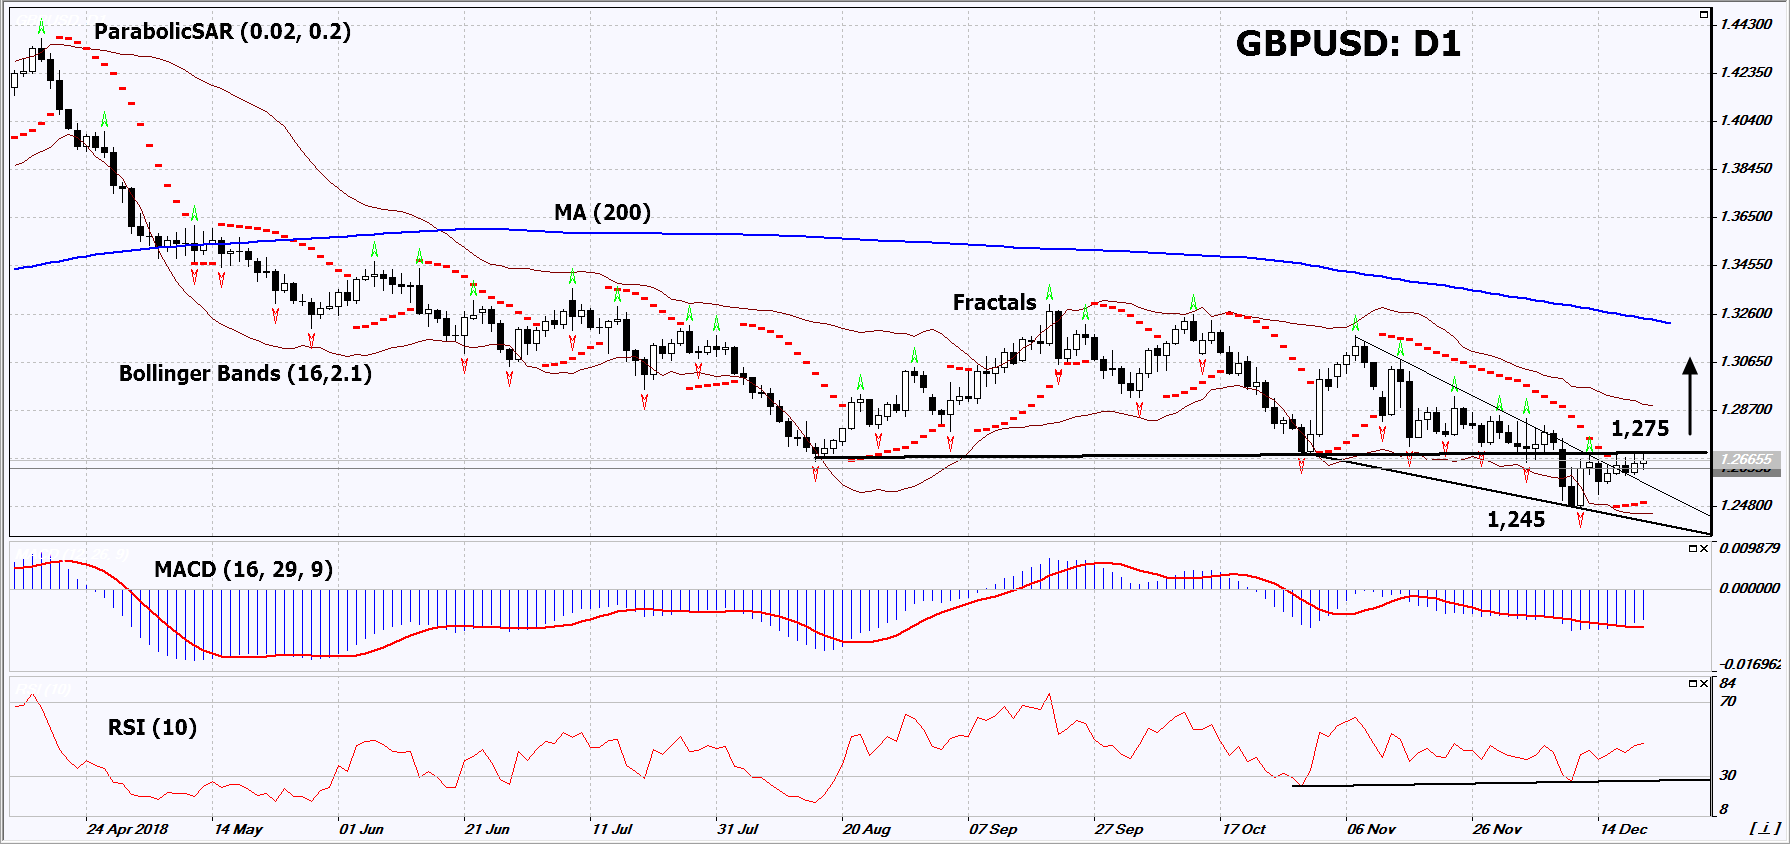
On the daily timeframe, GBPUSD: D1 has left the downtrend. It has approached the support line of the previous neutral range, which is now the resistance line. The further price increase is possible in case of the publication of positive macroeconomic data and progress in Brexit talks.
- The Parabolic indicator gives a bullish signal.
- The Bollinger bands have narrowed, which indicates low volatility. Both bands are titled upward.
- The RSI indicator is below 50. It has formed a positive divergence.
- The MACD indicator gives a bullish signal.
The bullish momentum may develop in case GBPUSD exceeds its last fractal high and the resistance line at 1.275. This level may serve as an entry point. The initial stop loss may be placed below the last fractal low, the Parabolic signal and the lower Bollinger band at 1.245. After opening the pending order, we shall move the stop to the next fractal low following the Bollinger and Parabolic signals. Thus, we are changing the potential profit/loss to the breakeven point. More risk-averse traders may switch to the 4-hour chart after the trade and place there a stop loss moving it in the direction of the trade. If the price meets the stop level (1.245) without reaching the order (1.275), we recommend to close the position: the market sustains internal changes that were not taken into account.
Summary of technical analysis
| Position | Buy |
| Buy stop | Above 1.275 |
| Stop loss | Below 1.245 |
Market Analysis provided by IFCMarkets
Free Reports:
 Get Our Free Metatrader 4 Indicators - Put Our Free MetaTrader 4 Custom Indicators on your charts when you join our Weekly Newsletter
 Get our Weekly Commitment of Traders Reports - See where the biggest traders (Hedge Funds and Commercial Hedgers) are positioned in the futures markets on a weekly basis.