By IFCMarkets
Japan: signs of recession
Let us consider the USD/JPY currency pair on the daily chart. Today there was released the Japanese GDP in the third quarter. Adjusted for inflation it made -0.4%. The statistics confirm the general trend of economic slowdown in the country, which was though supported by cheap energy products. We would like to remind that GDP increased 1% the last quarter. Taking into consideration the strengthening dollar, driven by the devaluating yuan, the USD/JPY currency pair will probably grow in the long term. Never-ceasing technological disasters in the Tianjin port produce additional support to the dollar. At the moment the price approached the support line at 125.876. We expect the position to open as soon as the price crosses this mark. However, conservative traders are recommended to pay attention to some other indicators.
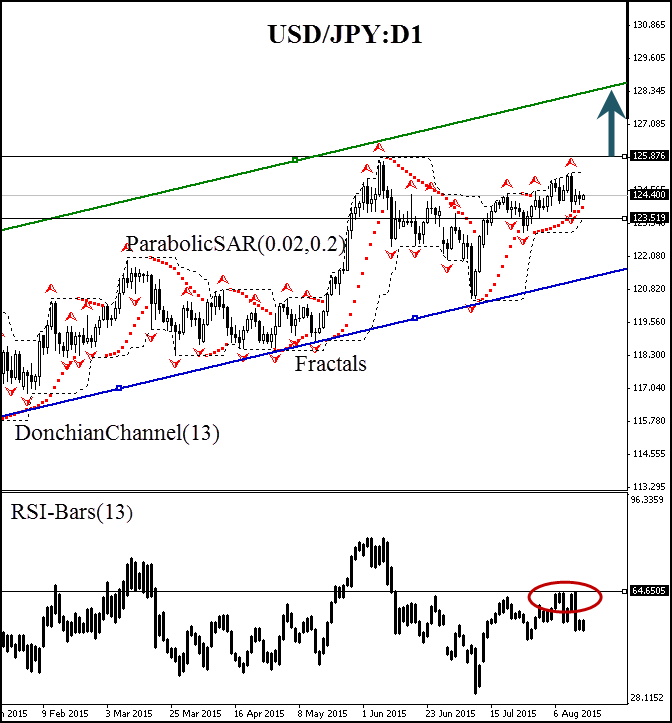
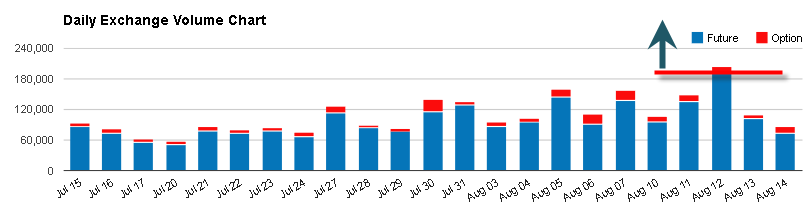
The RSI-Bars oscillator formed a double-top pattern (marked with an oval). A momentum will appear if the price crosses the 125.876 mark. We should also take into account the USD/JPY futures trading volume at Chicago Mercantile Exchange (see the figure below). High volatility may be considered important if the local maximum of 180 000 requests is breached. A stop loss may be placed above 125.876. If this mark is crossed the price will probably breach the RSI support line at 125.876. The stop loss is supposed to be moved every day below the latest minimum, thus, we are changing the probable profit/loss ratio to the breakeven point.
| Direction | buy |
| Buy stop | above 125.876 |
| Stop loss | below 123.519 |
Market Analysis provided by IFCMarkets