Article By RoboForex.com
Analysis for October 2nd, 2014
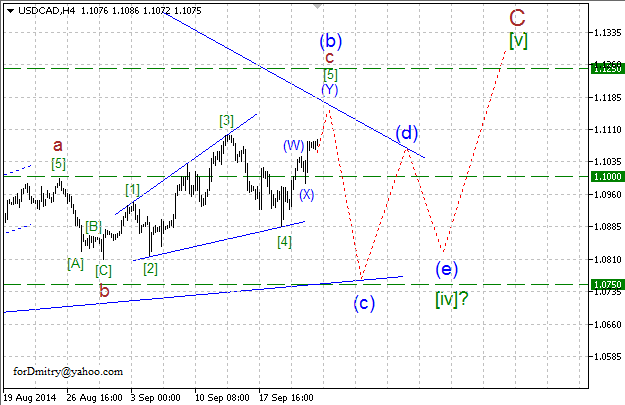
In our previous review, “Expecting a descending zigzag. Wave analysis of USD/CAD for 24.09.2014”, we discussed one of the possible scenarios how the price may complete an ascending zigzag (b) of [iv] and start a descending zigzag (c) of [iv].
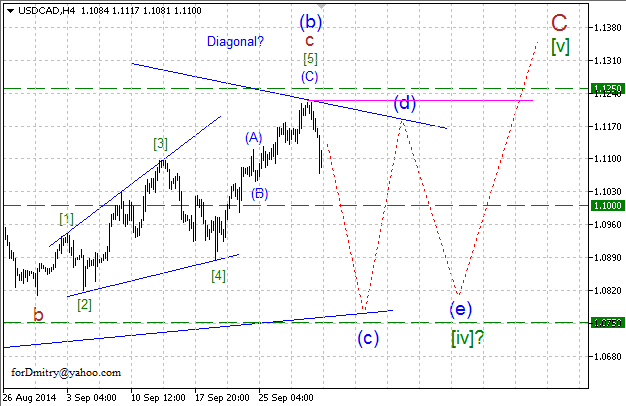
The wave structure on the H4 chart implies that the pair has completed diagonal triangle c of (b) and the whole ascending zigzag (b) of [iv] and started forming a descending zigzag (c) of [iv].
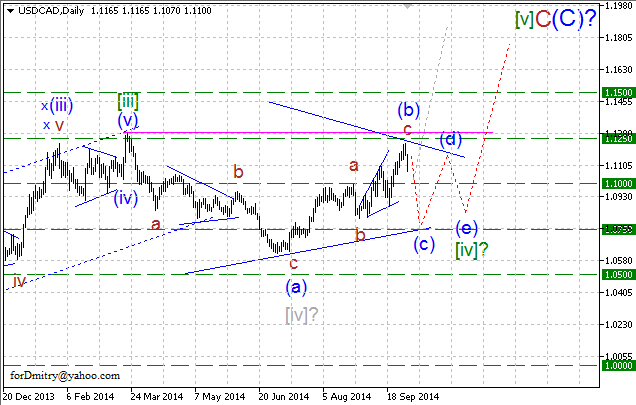
Our mid-term expectations haven’t changed so far. The market continues forming a descending correction [iv] of C, which may take the form of a long horizontal pattern. Right now, the pair is expected to continue forming a descending zigzag (c) of [iv].
However, at the same time one should remember that any possible scenario is subjective and the market may move in a completely different direction.
RoboForex Analytical Department
Free Reports:
 Get Our Free Metatrader 4 Indicators - Put Our Free MetaTrader 4 Custom Indicators on your charts when you join our Weekly Newsletter
 Get our Weekly Commitment of Traders Reports - See where the biggest traders (Hedge Funds and Commercial Hedgers) are positioned in the futures markets on a weekly basis.
Article By RoboForex.com
Attention!
Forecasts presented in this section only reflect the author’s private opinion and should not be considered as guidance for trading. RoboForex LP bears no responsibility for trading results based on trading recommendations described in these analytical reviews.
