Article By RoboForex.com
Analysis for September 29th, 2014
DJIA Index
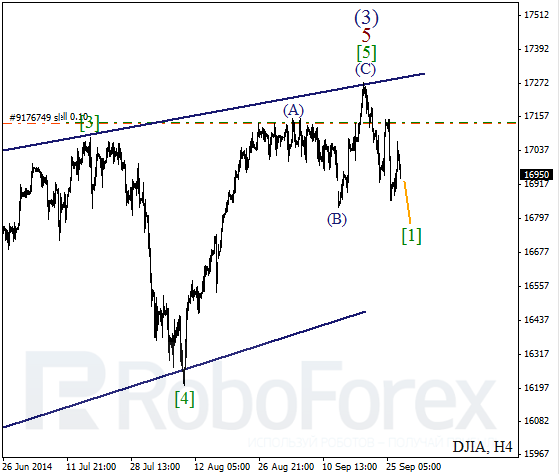
The scenario, which implies that the DJIA Index has already completed diagonal triangle inside wave 5, is still in effect. Probably, the price may have finished zigzag pattern inside [5] and right now is falling inside the first bearish wave. Possibly, the market may reach a new low during Monday.
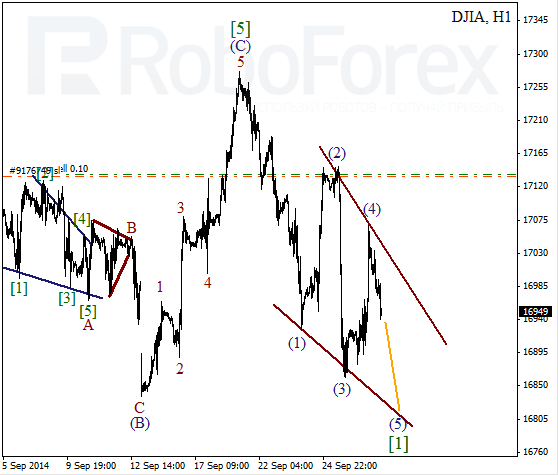
More detailed wave structure is shown on H1 chart. Probably, wave [1] is taking the form of wedge pattern, inside which the market formed the fourth wave last week. I’ve got only one sell order so far with the stop loss in breakeven, which I’m planning to close when the market rebounds from the pattern’s lower border.
Crude Oil
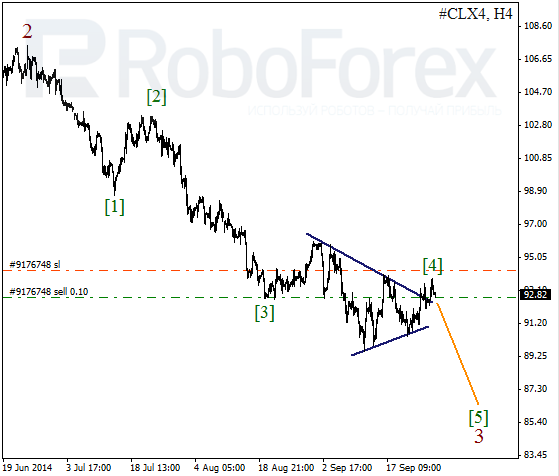
Most likely, Oil has finished horizontal triangle pattern inside wave [4]. Probably, right now the price is starting falling inside wave [5] of 3. I’ve got only one sell order so far, but later I’m planning to increase my position during local corrections.
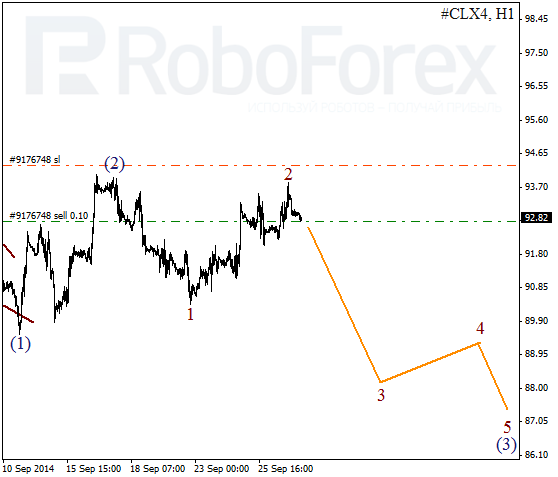
It looks like Oil has formed several first waves at the H1 chart. Most likely, the market is starting moving downwards inside the third wave. I’ll move the stop loss on my order in breakeven as soon as the price breaks the previous low.
Free Reports:
 Get Our Free Metatrader 4 Indicators - Put Our Free MetaTrader 4 Custom Indicators on your charts when you join our Weekly Newsletter
 Get our Weekly Commitment of Traders Reports - See where the biggest traders (Hedge Funds and Commercial Hedgers) are positioned in the futures markets on a weekly basis.
RoboForex Analytical Department
Article By RoboForex.com
Attention!
Forecasts presented in this section only reflect the author’s private opinion and should not be considered as guidance for trading. RoboForex LP bears no responsibility for trading results based on trading recommendations described in these analytical reviews.