Article By RoboForex.com
Analysis for September 8th, 2014
DJIA Index
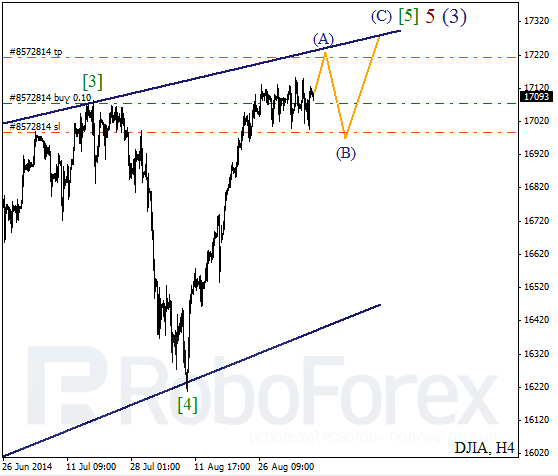
It looks like the DJIA Index continues forming diagonal triangle inside wave 5. On lower levels, the price is forming zigzag pattern in wave [5] with a bullish impulse (A) inside it. Consequently, after reaching a new historic maximum, the price may start a new correction.
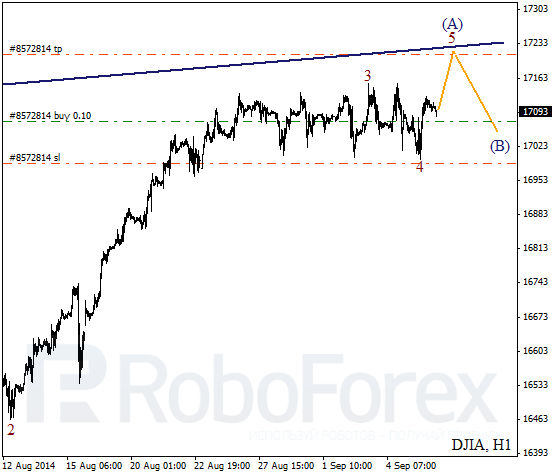
As we can see at the H1 chart, last Friday the DJIA Index finished the fourth wave inside wave (A). Considering that the price has already formed an ascending impulse inside wave 5, later the Index is expected to continue moving upwards. I’ve got one buy order with the stop loss placed below the latest minimums.
Crude Oil
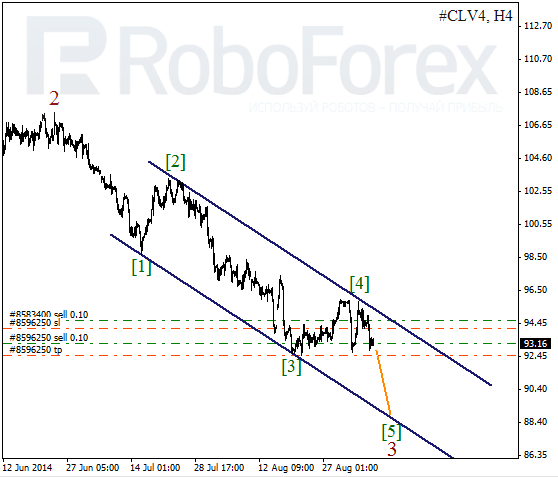
Probably, Oil continues forming a descending impulse inside wave 3. Last week the price rebounded from the upper border of its descending channel and, thus, indicated the start of a new descending movement inside wave [5] of 3. In the near term, the market may break the minimum of wave [3].
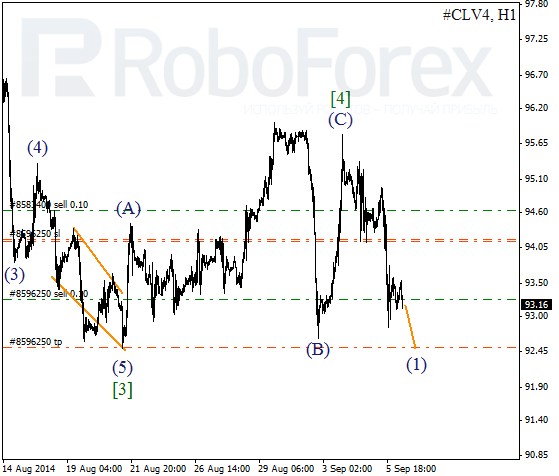
More detailed wave structure is shown on H1 chart. Probably, wave [4] is taking the form of zigzag with quite a long wave (B). On lower levels, the pair is finishing a bearish impulse inside wave (1). During a correction, I opened an additional sell order, which I’m planning to close at the end of the first wave.
Free Reports:
 Get Our Free Metatrader 4 Indicators - Put Our Free MetaTrader 4 Custom Indicators on your charts when you join our Weekly Newsletter
 Get our Weekly Commitment of Traders Reports - See where the biggest traders (Hedge Funds and Commercial Hedgers) are positioned in the futures markets on a weekly basis.
RoboForex Analytical Department
Article By RoboForex.com
Attention!
Forecasts presented in this section only reflect the author’s private opinion and should not be considered as guidance for trading. RoboForex LP bears no responsibility for trading results based on trading recommendations described in these analytical reviews.