By IFCMarkets
Hello, dear traders. Today we are going to analyze the Euro against the US dollar forex pair. As we can see at the price chart the currency pair is in a down trend as indicated by the falling trend line. Moreover, the SMAs are above the prices adding to the negative pressure. However, the currency pair stopped at the long term support level at 1.3336 which is the lowest since November 2013. Currently prices are extending into a range zone between 1.3432/1.3336. Based on the price formation the chances favor falling path to continue.
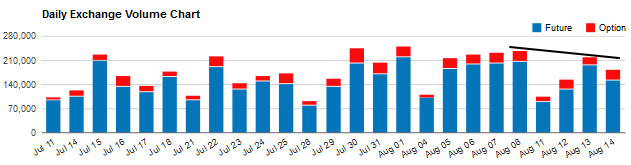
Furthermore, at the below chart we can see the daily volumes of futures and options traded on the Chicago Mercantile Exchange. We can see that on the last trading sessions the volume of trading eased and that is mainly due to range trading. Any break of the upper level at 1.3432 or lower level at 1.3336 should be coupled by increased volume so to be considered as a valid escape from the range.
Looking at the oscillators, Stochastic is in neutral territory and falling and that slightly favors the downside. The OsMA is also gradually advancing and the RSI (14) made a higher high suggesting that we may experience a positive retracement in the following trading sessions. In our opinion, at the time being the bears and the bulls have equal power and for that reason we are at an indecision period. The strong support at 1.3336 induced prices in sideways trading and we would expect some retracement up to cap at 1.3507 before the downside revives. However, should the prices breach support at 1.3336 that would suggest the currency pair would continue its bearish development without a corrective move, towards next support at 1.3191.
Market Analysis provided by IFCMarkets