By IFCMarkets
Hello, dear traders. Today we are going to analyze the Aussie against the US dollar chart. The currency pair likely created a reversal pattern from 9-month peak at 0.9502 to recent support at 0.9240 or it could just be in a wide range between top at 0.9502 and bottom at 0.9207. If we just see the shorter term formation, falling trend lines suggest the bearish sentiment prevails. Moreover, Simple Moving Averages formed a triple “death” cross adding to the negative bias expectation. However, the support at 0.9240 it is the 161.8% extension of the up move from 0.9329 to 0.9471, previous low has been observed around 0.9240 and 0.9207 which suggests that these support levels might be hard to overpass.
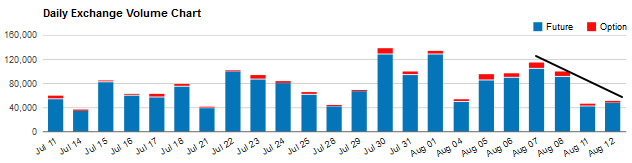
Furthermore, at the below chart we can see the daily volumes of futures and options traded on the Chicago Mercantile Exchange. We can see that during the recent trading sessions with the currency pair being in range the volume of trading has declined. At the 7th of August when a big bearish candle was formed volume was high indicating that bears were strong validating falling bias.
Looking at the oscillators, MACD is gradually declining and has room for lower levels suggesting that downside could continue. The Stochastic is negative and slightly above its oversold zone, given the down trend in the short term, the oscillator can go deeper. The OsMA suggests a retracement could continue. In our opinion, the down trend exists while the volume confirms the bearish candlesticks, the current bounce up is due to support at 0.9241 and the even stronger support at 0.9207 where buy orders are placed. We would believe that bears are accumulating power at the moment and prices would revisit downside hurdle at 0.9241 and most likely to test the lower support as well, at 0.9207.
Market Analysis provided by IFCMarkets