By IFCMarkets
Good afternoon, dear traders. Today in the evening (14:30, CET) we expect the publication of the Unemployment Claims over the past week. These data are collected by the Ministry of Labor, and published in the weekly report. The indicator allows us to estimate the domestic demand dynamics, as well as the potential consumer lending to stimulate the U.S. economy. If the actual value falls below the forecast of 314 thousand applications, the strengthening of investors’ confidence should be expected and, as a consequence, the U.S. currency.
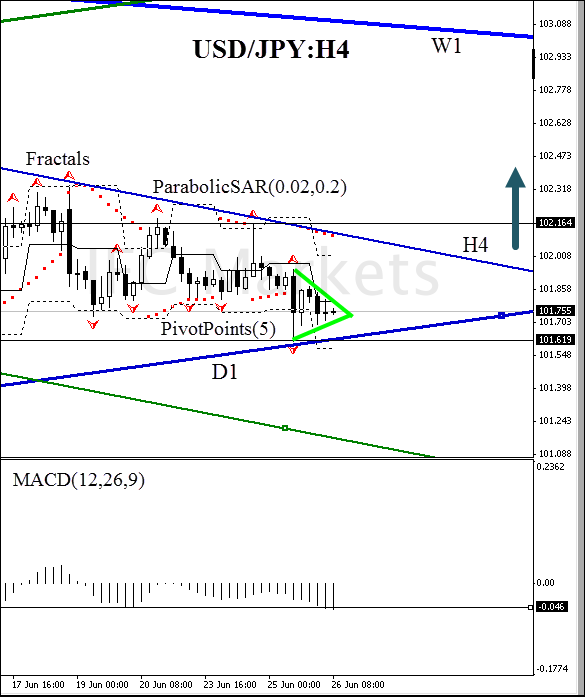
Let us consider the USD/JPY frequently traded currency pair on the H4 chart. The price approached the support line of the daily rising channel. According to the tenets of the Dow theory, the daily scale defines the relative scale of the four-hour, so we expect the H4 resistance line breach. At the moment there is a consolidation within the triangle that indicates the formation of large-scale momentum. In the given situation, the graphical analysis has a higher priority, as it permits us to track the market movements at all scales, unlike indicators, which are limited by the internal parameters. So today we are looking for position bidding at the trend reversal in relation to the daily support line. At the level breach of 102.164 (resistance coincides with the Bill Williams fractal maximum), the reversal of the ParabolicSAR trend indicator takes place and the simultaneous breach of the PivotPoints first channel resistance. Thus, we get the confirmation on the part of both indicators. The problem is only the oscillator MACD behavior that should be closely monitored. It is recommended to fix its value return above -0.046. This will presumably happen when the price crosses the first maximum.
Pending buy order is to be preliminary placed above the key fractal peak at 102.164. This level is confirmed by the PivotPoints historical support. Stop Loss can be chosen at the last fractal trough at 101.619, which coincides with the historical value of the ParabolicSAR indicator and the first PivotPoints support. Opening a position, it is recommended to move the Stop loss after the parabolic values every 4 hours after the order execution. Thus, we can optimize the return/risk ratio in our favor in the process of changing market conditions.
| Direction | up |
| Position opening | above 102.164 |
| Stop loss | below 101.619 |
Market Analysis provided by IFCMarkets