By www.CentralBankNews.info Angola’s central bank held its policy rate steady at 9.75 percent, citing a lower inflation rate, an upward trend in credit to the economy and a slight appreciation of the kwanza in the last month.
The National Bank of Angola (BNA) has cut its rate by 50 basis points this year, most recently by 25 points in August in sync with falling inflation.
Angola’s inflation rate eased to 8.97 percent in August, down from 9.04 percent in July, as inflation continues to remain below 10 percent, a central goal of the BNA.
The LUIBOR overnight rate was 5.51 percent with maturities of 3 and 12 months at 8.46 percent and 10.03 percent, respectively, “thus confirming the downward trend in interest rates practiced in the interbank money market,” the central bank said.
Credit to the economy maintained its upward trend in August, rising 4.3 percent since the start of the year while the average reference exchange rate for the kwanza against the U.S. dollar was 95.91 at the end of August, an appreciation of 0.04 percent compared to the end of July.
www.CentralBankNews.info
The U.S. Congress is still Undecided
Article by Investazor.com
The federal debt ceiling issues maintains the thrill of these days as the Congress hasn’t reach an agreement yet. President Obama is confident that the government won’t get to the point of shutdown as this scenario would be devastating the american economy. As is was observed in the past, this kind of events, when the government shows weakness and uncertainty, results in a degradation of the business and consumer confidence sectors.
As expected consequences of this situation we can observe the price of gold futures which went up 8% for the quarter. Later this week, as the job report is expected on Friday, economists believe that the force behind the NFP report will be the decision concerning the fiscal policy. In other words, the nonfarm payrolls may be influenced, even if is a last minute impacting factor.
For now, Congress still have to agree on a bill that would fund the government for next month. If Congress fail to take a decision, we may see the government half paralyzed. As suggests the latest news, any measure that will be taken in order to temporarily overcome this situation will be implemented only if “Obamacare” will be at least one year postponed.
The post The U.S. Congress is still Undecided appeared first on investazor.com.
EURUSD Technical Overview before the ECB Press Conference
Article by Investazor.com
This week, as I wrote in the last article (What is Programmed in the Forex Calendar for Next Week?), the volatility for the Forex market might go through the sky. EURUSD can become one of the hardest currency pair to trade for the rest of the week. The debt ceiling problem from the United States, the ECB Press conference and the US Non-Farm Employment Change from Friday are the main events of the week.
Leaving aside economic data, let’s take a look over the technical analysis of this pair. From 6th of September started the last up move which ended after a 3.5% win for the European single currency. The main resistance from 1.3450 was broken after the FOMC meeting and the price touched a high at 1.3565.
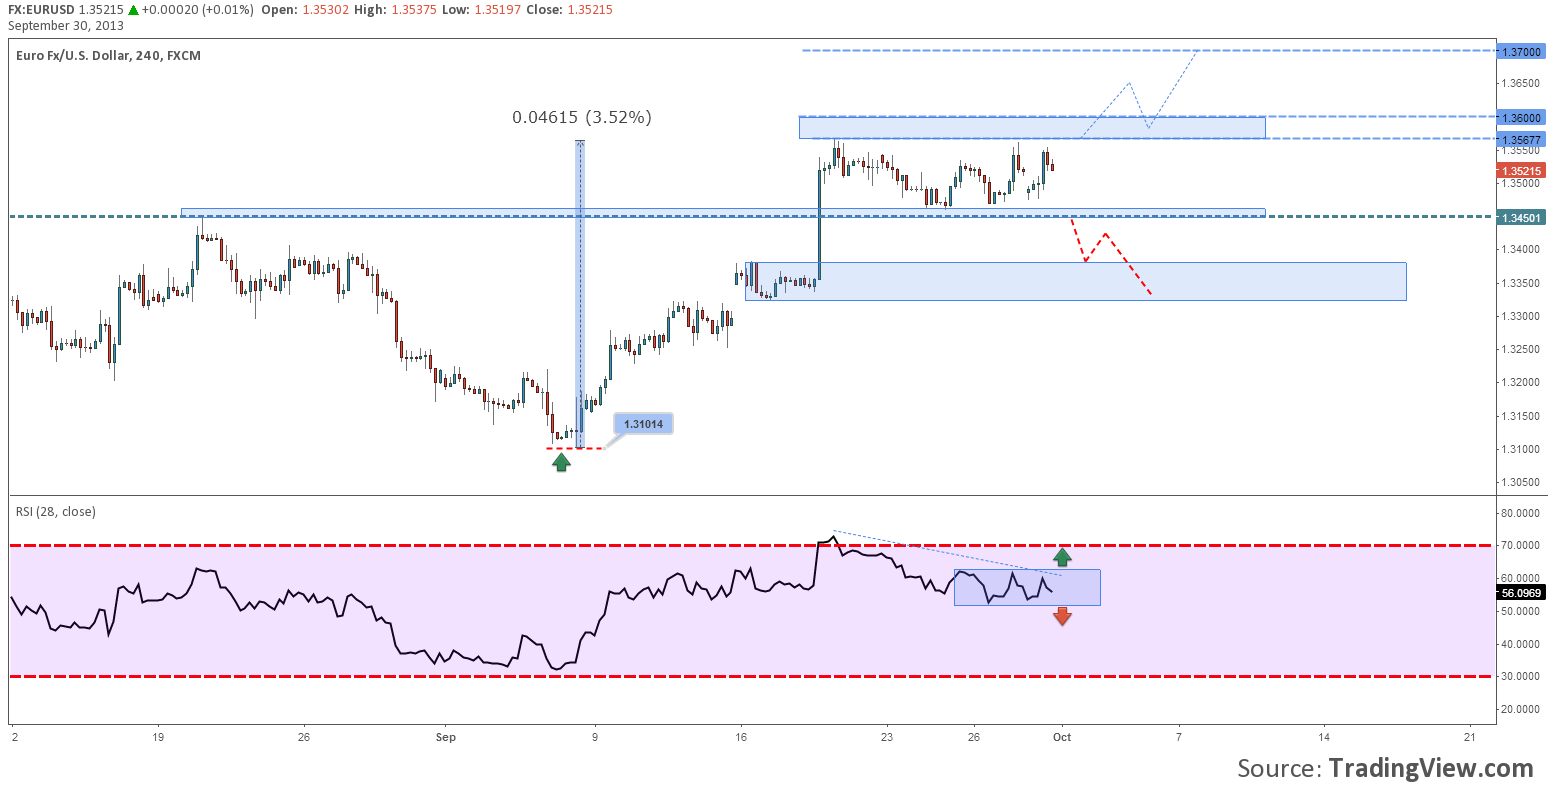
Chart: EURUSD, H4
The price started a rectangle consolidation between 1.3460 and 1.3465. The range might continue until the ECB press conference from Wednesday, especially if there will be no surprises from the Congress regarding the debt ceiling.
If the price will break the upper area and close on a daily basis above 1.3600 we could expect a rally to 1.3700, from my opinion a bit difficult in the current context. On the other hand if the market will panic and safe heavens will be bought, or the ECB will surprisingly drop the interest rate lower, we might see a down fall under 1.34500 all the way to 1.33.
If you are trading EURUSD it would be best to keep an eye over the economic calendar and an eye over the news regarding the debt ceilings. As for the technical analysis look for clear signals and don’t forget what you see and not what you think you see.
The post EURUSD Technical Overview before the ECB Press Conference appeared first on investazor.com.
Mauritius holds repo rate on contained inflation
By www.CentralBankNews.info The central bank of Mauritius held its key repo rate steady at 4.65 percent as a majority of the members of the monetary policy committee agreed that rates could remain at its current level “to continue to provide support to the economy against the backdrop of contained inflation, which they expected to remain below the staff forecast.”
The Bank of Mauritius, which cut its rate by 25 basis points in June, said other members on the committee argued that upside inflation risks were still present and considered it important to normalize the repo rate to address vulnerabilities in the banking sector from prolonged negative real interest rates and offer rates that would help change savings and consumption behaviour.
“The MPC maintains strong vigilance in monitoring economic and financial developments and stands ready to meet in between its regular meetings, if the need arises,” the bank said.
When the central bank cut its rate in June, the governor told Bloomberg that he had voted for an increase in the rate to help contain inflation.
Mauritius’ inflation rate fell to 3.1 percent in August from 3.6 percent in July. Since January it has fluctuated between 3.6 and 3.7 percent and the central bank’s staff projects inflation remaining in a range of 4.5-4.9 percent by December before rising to 4.9-5.5 percent by June 2014.
Economic activity in Mauritius continues to face headwinds from soft economic conditions in its main trading partners with the output gap projected to remain slightly negative, the bank said, taking note of the statistics’ office revising down its 2013 growth forecast to 3.2 percent from 3.3 percent.
The central bank’s own staff trimmed its forecasts 2013 growth to a range of 3.1-3.5 percent from a forecast of 3.2-3.7 percent in June.
The global economy had improved slightly since June, the bank said, though the outlook for the U.S. remains clouded by the fiscal deadlock and growth in China and India has slowed and looks unlikely to return to previous highs. Global inflation is broadly benign, below target in advanced economies while some emerging countries have seen higher inflation due to depreciating currencies.
It’s Time to Buy China
By The Sizemore Letter
In recent weeks, I’ve advocated buying European stocks and REITs. I’m still wildly bullish on both, but today my attention is turning to emerging markets and specifically to China.
I first mentioned China about a month ago, noting that Chinese stocks were cheap and that they had quietly been outperforming the S&P 500.
Well, Chinese stocks are still cheap, fetching only 7 times earnings by the Financial Times’ estimates. And though Chinese stocks have slumped over the past week, they are still outperforming the S&P 500 by a wide margin.
The general consensus is still pretty bearish on China. The feeling is that the country’s best days of growth are behind it. This is true, of course. China will probably never enjoy 10% annual GDP growth again. But its growth rate still puts all developed markets and most emerging markets to shame. And the recent data coming out of China is encouraging.
Earlier this week, I received an email from KraneShares, an advisor specializing in China-focused ETFs that laid out a few economic stats worth bullet pointing:
- Home prices for new residential properties in 66 of 70 mid and large cities rose on a monthly basis in August. For price movement, the largest increase was 1.7% and lowest was a fall of 0.1%. Compared to a year ago, 69 cities saw higher home prices, with the greatest gain at 19.3%.
- China rail cargo volumes measured in tons-carried improved by 3.9% year on year according to July statistics. A reversal of a negative trend dating back to Feb 2013.
- Government revenue rose by 9.2% year on year to Rmb858.8bn (US$140.3bn) in August, according to the Ministry of Finance (MOF), while expenditures grew by 6.5% to Rmb960.7bn. The MOF stated that revenue and expenditure increased by 8.1% and 7.4% respectively in January-August over the year-earlier period. Revenue has accelerated since June, buoyed by stronger corporate and personal income tax, as well as resurgent land sales.
None of these are a reason to run out and invest in Chinese stocks today (though their cheap pricing and momentum certainly are). But they do point to a Chinese economy that has likely quit cooling for now.
Action to take: Allocate a portion of your portfolio to Chinese stocks and plan to hold through at least the first quarter of next year. The popular iShares China Large Cap ETF (FXI) is a good option, though KraneShares has some interesting alternatives as well. The KraneShares CSO China Five Year Plan ETF (KFYP) targets Chinese companies that the advisor expects to benefit from the Chinese government’s current five-year plan.
The fund is very thinly traded, so be careful if you decide to buy it. But it also allocated very differently from FXI, with a much higher allocation to technology and consumer stocks. Purchased together, the two ETFs should give you broad exposure to the Chinese market.
Disclosures: Sizemore Capital does not currently have a position in any security mentioned. This article first appeared on TraderPlanet.
Charles Lewis Sizemore, CFA, is the editor of the Sizemore Investment Letter and the chief investment officer of investments firm Sizemore Capital Management. Click here to learn about his top 5 global investing trends and get your copy of “The Top 5 Million Dollar Trends of 2013.”
This article first appeared on Sizemore Insights as It’s Time to Buy China
Fibonacci Retracements: From Natural Series to Human Nature
Fibonacci retracements, based on the naturally occurring Fibonacci sequence, together with the Elliott Wave Theory, have provided a means of predicting movements in the markets for almost 80 years, but many investors have been put off these methods by the fact that they can be tricky to apply. The new Automatic Fibonacci Retracements tool has made making predictions using this theory much simpler, and there is plenty of evidence to suggest that understanding how fluctuations tend to occur in proportion to previous movements in the market can be a useful factor in making trading decisions.
Why Fibonacci Retracements Work
Fibonacci retracements are based on the Fibonacci sequence of numbers, each of which is the sum of the two previous numbers. Fibonacci originally described this sequence in terms of the reproduction of a population of rabbits, so it is unsurprising that it can be found in many natural phenomena. It is a fact of nature that quantifiable traits such as population size or plant growth will occur in proportion to their magnitude in the past. This proportion is typically the same as is demonstrated by the Fibonacci sequence. Human nature is no different, and since movements in the markets depend upon human trading decisions, it is only to be expected that patterns reflecting the Fibonacci series seen in nature can also be observed in market fluctuations. Fibonacci retracements look for these types of ratios in the market and use them to predict future movements. The expectation is that both low and high peaks are likely to stop at points that are proportional to previous movements, particularly when they reach 38% or 62% of the original movement. The Elliott Wave theory extends this idea further, to predict movements that occur in a series of waves.
The turning points between waves can provide support areas where the market is expected to pause temporarily and then change direction. Knowing when such shifts are likely to occur can give investors a significant advantage, but, as with any predictive tool, it is important to be aware of the limitations of the technique as well as its possibilities. Fibonacci retracements and the Elliott Wave theory can enable patterns of movements to be analyzed in a manner that can complement the close market watching and news analysis that is advised by money.co.uk, particularly for potentially volatile markets such as Forex trading. Locating stable areas in these rapidly changing markets can make a significant difference to trading decisions. There will always be other considerations when choosing trades, whether it is an expected news release about the economy, or one’s own personal ethical choices about where to invest, but learning how to use these types of tools can be an important step towards managing your own investments rather than relying on an investment fund or manager. Many online brokers will offer the chance to test these methods using a virtual trading platform before you attempt it with a real investment, although the demonstration may be restricted to the most commonly traded currencies, which money.co.uk names as the EUR, USD, GBP and YEN. This can be a good opportunity to see how well Fibonacci retracements reflect the real world.
Waves in the S&P
A recent example demonstrating how Fibonacci retracements can work comes from the S&P 500 in July 2013. A series of fluctuations in this market followed the predictions of the Elliott Wave Theory and Fibonacci retracement very closely. The predicted fluctuation, as described by technical analyst Walter Zimmerman in the Wall Street Journal, were originally based upon the rise from a low point of 1560.33 to a peak at 1626.61 on July 1st, and the dip that followed, down to 1604.57 on July 3rd. According to the theory, markets will tend to follow a pattern of five waves, with a rise and fall, another rise and fall, and a final rise that will reach the highest point in the series. Based on the first two waves, Fibonacci ratios made it possible to predict the course of the next three waves. It was expected that there would first be another rise, a third wave peaking at about 1711.81. Next, the S&P 500 would fall again, in a fourth wave descending to 1686.50. Finally, a fifth wave would occur, bringing the S&P 500 up to its highest peak in the pattern, estimated to be at 1752.78.
Looking at what really happened to the S&P 500, we can see that this prediction turned out to be fairly accurate, although there was some deviation from the “technical perfection” described by Zimmerman. The S&P 500 did indeed rise again, to a peak of 1709.67, fell to a low of 1630.48, and then rose again to peak at 1725.52. The predicted pattern is clearly present, although the exact predictions were slightly different. The main issue with the prediction was that the fourth wave fell further than expected, past 1660, the point at which Zimmerman suggested he would need to recalculate his predictions.
Making Predictions using Fibonacci Retracements
Applying similar methods to the Forex market, using the Automated Fibonacci Retracement tool, makes it possible to gain a better idea of how current waves are likely to be followed by proportional fluctuations in the near future. An Elliott Wave analysis of the market in September 2013, for example, would suggest that the USD is likely to experience a short-term drop against EUR, GBP and CHF, as the fourth wave reaches its lowest point, before the final fifth wave recovery begins.
Twitter IPO: It’s Exciting, But How Can You Profit?
By The Sizemore Letter
This time last year, “social media” was an expletive in financial circles. The Facebook (FB) IPO had long since gone down in flames, as had other new technology IPOs like Groupon (GRPN) and Zynga (ZNGA). At this point last year, Facebook, Groupon and Zynga were off 55%, 83% and 85%, respectively, from their previous highs.
It seemed like a case of the emperor’s new clothes. Social media stocks were surrounded by buzz and hype … yet they didn’t have much in the way of profits.
Then a funny thing happened. In July, Facebook announced earnings that were much better than expected, and — more importantly — announced a surge in mobile ad sales. Perhaps social media could make money after all.
And this brings us to Twitter, which is arguably the most anticipated IPO since Google’s.
Twitter IPO Buzz
What should we expect from the Twitter IPO?
At this point, we can’t draw a lot of conclusions about Twitter’s revenues and profitability. Being private, they are under no obligation to disclose that information. The most credible estimates I’ve seen have the company generating $600 million in sales in 2013 and $1 billion in 2014.
What does that imply for an IPO price? It’s far too early to say. Early estimates value the company at around $15 billion. That would represent a price/sales ratio of 15 based on expected 2014 revenues. That’s expensive, but not unheard of for a tech IPO. As a point of reference, Facebook currently trades for 19.7 times sales.
The success of any investment — IPO or otherwise — ultimately comes down to the price paid. This is a topic we’ll have to revisit as more details about the IPO are released. But in the meantime, there are a few points for us to consider.
First off, Twitter seems to have a more promising business model in place than Facebook did at the time of its IPO (and does today), in that it’s building partnerships with corporate sponsors rather than simply viewing them as disposable, churnable advertising clients.
As an example, earlier this year, ESPN and Ford (F) sponsored instant replay tweets during last season’s college football bowls. And Turner Sports, the NCAA, AT&T (T) and Coca-Cola (KO) followed suit during March Madness.
What are these relationships worth?
Again, it’s too early to determine the exact value of the relationship. But this shows that corporations are becoming engaged with Twitter on a far deeper level than they are with Facebook, where their role is still limited to building a fan page and inviting viewers to “like” it.
Here are some other fun facts from the Twitter blog: 95% of live TV conversation currently happens on Twitter, and half of all national Super Bowl commercials had hashtags on them this past year.
I find Twitter “high-fiving” during football games to be obnoxious and distracting. I prefer to sit and watch the game with a cold beer in my hands and not my smartphone or laptop. But I guess I’m old school.
Still, while I have little interest in tweeting with complete strangers during a football game, the ubiquitous hashtags are proof of Twitter’s emergence as the medium of mass communication. It’s also worth noting that Carl Icahn announced his Apple (AAPL) purchase on Twitter … not Facebook.
How to Profit off the Twitter IPO
So, how can investors without VIP access to IPOs get access to Twitter?
The easiest way is through shares of GSV Capital (GSVC). GSVC is a publicly traded venture capital firm with stakes in several up-and-coming technology companies.
Twitter makes up about 15% of the portfolio, so GSVC is not a pure play by any stretch. But it’s as close as most individual investors can get at the moment, and a successful Twitter IPO should cause many of GSVC’s other holdings to rise in sympathy.
Prior to the Facebook earnings announcement, GSVC’s shares had languished, and the stock traded at a large discount to its book value. You could effectively buy shares of Twitter cheaper via GSVC than buy buying them directly as a private placement. But as Facebook’s earnings surprise has reawakened the animal spirits in the sector, GSVC shares now trade at roughly a 10%-15% premium to book value.
Does that make GSVC expensive? Not quite. GSVC’s book value is a moving target, and its “real” book value would probably be a good 10%-20% higher if its holdings were to be repriced today.
This is a long way of saying that, while it might no longer be the screaming bargain it was, GSVC is by no means expensive if you believe the Twitter IPO will be successful.
Charles Lewis Sizemore, CFA, is the editor of the Sizemore Investment Letter and the chief investment officer of investments firm Sizemore Capital Management. As of this writing, he was long GSVC. Click here to learn about his top 5 global investing trends and get your copy of “The Top 5 Million Dollar Trends of 2013.” This article first appeared on InvestorPlace.
This article first appeared on Sizemore Insights as Twitter IPO: It’s Exciting, But How Can You Profit?
Announcing Trader Education Week — a Free Event to Help You Learn to Spot Trading Opportunities
Announcing Trader Education Week — A FREE trading event that will teach you how to spot trading opportunities in your charts. Spend October 2-9 getting free trading lessons that you can apply to your trading immediately — from one of the world’s foremost market technicians, Jeffrey Kennedy.
Dear Trader,
You have an opportunity to spend the next week learning how you can spot high-confidence trade setups in the charts you follow every day.
Elliott Wave International (EWI) is hosting a free Trader Education Week, October 2-9. Register now and get instant access to free trading resources — plus you’ll receive more lessons as they’re unlocked each day of the event.
Jeffrey Kennedy, EWI analyst and one of the world’s foremost market technicians, has taught thousands how to improve their trading through his courses, subscription services and as an adjunct professor of technical analysis at Georgia Tech University. Now you have the opportunity to be a student in his online classroom, as he takes complex technical methods and tools and breaks them down so that you can apply them to your trading immediately.
Don’t miss this opportunity to learn how to spot trading opportunities in the markets you follow.
Register today and get your first 4 free trading resources immediately, plus we’ll alert you to valuable new resources unlocked every day beginning October 2.
Register for Trader Education Week — It’s FREE!
About the Publisher, Elliott Wave International
Founded in 1979 by Robert R. Prechter Jr., Elliott Wave International (EWI) is the world’s largest market forecasting firm. Its staff of full-time analysts provides 24-hour-a-day market analysis to institutional and private investors around the world.
Romania cuts rate third time in row on lower inflation
By www.CentralBankNews.info Romania’s central bank cut its policy rate by a further 25 basis points to 4.25 percent, as expected, saying a resumption of disinflation has allowed the central bank to continue easing its policy.
It is the third rate cut in a row by the National Bank of Romania (NBR), which has cut rates by a 100 basis points this year following last year’s cuts totaling 75 basis points.
Romania’s inflation rate fell to 3.67 percent in August from 4.41 percent in July due to lower food prices and the effect of the negative output gap, the NBR said.
“This trend, in line with the central bank’s forecast in the latest inflation report, strengthens the favourable outlook for the annual inflation rate to fall below the 2.5 percent target in the forthcoming period,” the central bank said, adding it expects disinflation to continue until the first half of 2014.
Last month the central bank lowered its inflation forecast for this year to 3.1 percent from 3.2 percent and economists expect the NBR to continue to cut rates further this year.
The pass-through of the central bank’s rate cuts to lending rates to companies and households is still moderate and taking place with a certain lag, but the ongoing adjustment of monetary conditions is aimed at preserving medium-term price stability while also paving the way for the sustainable recovery of lending to the private sector and thus restore confidence and lasting economic growth, the NBR said.
Economic activity in Romania has been mixed, with exports as the main driver having a positive impact on manufacturing output and the current account, offsetting the unfavourable impact of the slow recovery of consumption and investment on growth.
Romania’s Gross Domestic Product expanded by 0.5 percent in the second quarter from the first, for annual growth of 1.5 percent, down from 2.1 percent in the first.
The NBR said annual growth in loans to the private sector remain in negative territory but credit institutions have “considerable room for manoeuvre in cutting interest rates on lending to the real sector, subject to prudential rules.”
A balanced monetary policy stance and the new precautionary funding arrangement concluded with the International Monetary Fund will contribute to stabilize Romania’s economy and strengthen its resilience to external shocks, the bank added.
On Friday the IMF’s board approved a two-year $2.7 billion stand-by arrangement for Romania. Under the deal, Romania does not plan to draw on the funds but retain them as a buffer to reassure investors. Romania has committed itself to undertake structural reforms, including an update to its health system and sell state assets in the energy sector.
Senior Strategist: Political complications in both the US and Italy
The US government will face its first shutdown in nearly 20 years on Monday night unless the White House and Republicans can broker a last-minute deal.
In Italy Prime Minister Enrico Letta plans to hold a confidence vote on Wednesday, to seek the backing of Italy’s parliament. He was forced to make that move after five ministers from Silvio Berlusconi’s party stepped down at the weekend.
Senior Strategist, Ib Fredslund Madsen, predicts a negative week on the financial markets.
Video by en.jyskebank.tv