By CentralBankNews.info
Hungary’s central bank cut policy rate for the 16th time in a row, trimming its base rate by another 20 basis points to 3.20 percent, a move that was largely expected.
The National Bank of Hungary, which has now cut rates by 255 basis points this year and by 380 points since August last year when it began its current easing cycle. The central bank did not give any immediate explanation for its decision.
Why It “Won’t Be Different” This Time Around
By Moe Zulfiqar for Daily Gains Letter
 Buy the U.S. dollar, because it’s going to gain strength going forward, or so say the mainstream. The reasoning behind this investment strategy is very simple: the central banks of major economic hubs are working to devalue their currencies. As a result, there will be a rush to buy the U.S. dollar—it’s proven to be safe in the past. Just look at Japan, for example; it continues to be in favor of printing, which is why you should sell the Japanese yen. The European Central Bank (ECB) has hinted it might go ahead with quantitative easing—sell the euro. Others, like Australia, have already lowered their interest rates, and while they haven’t started printing yet, but say they are open to it—sell the Australian dollar.
In the short run, these investment strategies may be viable. In fact, since late October, we have been seeing the U.S. dollar gain strength compared to other major currencies. Please look at the chart below of the U.S. dollar index.

Chart courtesy of www.StockCharts.com
I question if this strategy of buying the U.S. dollar is going to be profitable in the long run. Those who are looking at the fundamentals of the U.S. dollar from a long-term perceptive will agree with me that they are looking very bleak.
First, the printing continues. We heard from the Federal Reserve that it will continue to print U.S. dollars in exchange for government bonds and mortgage-backed securities (MBS). Sadly, what many don’t realize is that even if the central bank says it will taper, it simply means it will be printing, just at a slower pace. What this printing eventually does is devalue the U.S. dollar and create monetary inflation.
Secondly, the budget deficit of the U.S. government continues to remain high. We heard in the fiscal year 2013 that the U.S. budget deficit slowed to $680 billion from over $1.0 trillion in 2012, but I say the damage has been done. After the financial crisis struck the U.S. economy, the government came and spent; as a result of this, the U.S. national debt has surpassed $17.0 trillion. The greater the budget deficit the U.S. government incurs, the higher the national debt is going to be. This phenomenon eventually increases the chance of the government defaulting on its debt, resulting in creditors selling their bonds and flooding the markets with U.S. dollars.
Last but not least, there’s simply no economic growth in the U.S. economy. The misery of the average Joe remains: he continues to work at a low-wage-paying job and needs food stamps because he can’t afford even the most basic needs with his income.
The U.S. dollar may excel in the short run because the general consensus is that it’s a good trade, but I continue to be skeptical over its long term performance. Looking at the fundamentals, the U.S. dollar appears weak, and as we see more of the same in terms of printing, budget deficits, and higher national debt, it’s going to deteriorate further.
With the U.S. dollar’s fundamentals becoming anemic in the long term and other major central banks promising to print more (they all want to devalue their currencies), I see only one currency that will shine as a result. No, it can’t be printed out of thin air. I am, of course, talking about gold bullion. History suggests that the precious metal provides investors safety from uncertainty and the devaluation of currencies. This time, it won’t be any different.
http://www.dailygainsletter.com/us-dollar/why-it-wont-be-different-this-time-around/2145/
E-mini S&P500 Looks To Complete The Five Wave Rally: Elliott Wave
S&P Futures are at new highs which has been expected after only three wave retracement back to 1774 last week, labeled as black wave iv. This black wave iv is part of a five wave rally which means that price is now in final stages of current impulse so correction could occur in this week. This can happen from around current levels where wave v equals to wave i, or it can be from the second projected level 1825 (261.8% extension of wave i). A divergence on the RSI also suggests a coming reversal in price.
E-mini S&P500 4h Elliott Wave Analysis
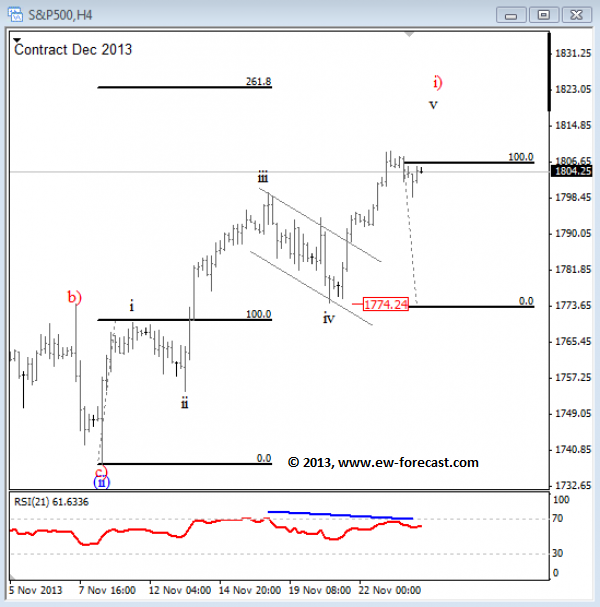
Written by www.ew-forecast.com

Euro Advanced as ECB Member Discuss Negative Deposit Rate
The euro rose higher against the US dollar on Tuesday, picking up from the losses which following comments from the European Central Bank (ECB) board member, who said the negative deposit rate was an option.
The euro rose 0.28% higher to $1.3554 against the US Dollar as of 8:53am GMT and advanced 0.06% to £0.8371 against the UK pound and the same time.
The 17-nation currency edged 10% higher at ¥137.52 against the Japanese yen, remaining close to a four-year high after Tuesday’s Bank of Japan (BoJ) October minutes hinted that the policymakers may come across some difficulties in achieving its inflation target.
ECB
On Tuesday, ECB board member Benoit Coeure, said that the negative deposit rate was a possibility that was discussed and the central bank would make sure it reaches its inflation 2% target.
Earlier this month, the European Commission forecasted that inflation would reach 1.5% this year and remain the same till next year before slightly dropping to 1.4% in 2015.
Iran Deal
The US dollar was boosted after the historic deal with Iran over its nuclear program was finalized over the weekend.
The six-month deal was made between the Western nations and Iran, in which the Persian gulf country agreed to ease the extensive nuclear program in the country in return of an estimated $7 billion-worth of economic sanctions.
Iran pledged to give access to international nuclear weapons inspectors at its nuclear facilities Natanz and Fordo.
Visit www.hymarkets.com to find out more about our products and start trading today with only $50 using the latest trading technology today.
The post Euro Advanced as ECB Member Discuss Negative Deposit Rate appeared first on | HY Markets Official blog.
Article provided by HY Markets Forex Blog
WTI Bounces Back on Stockpiles Drop Forecast
West Texas Intermediate (WTI) rebounded on Tuesday from its biggest drop in a week on speculations that the US crude inventories dropped for the first time in more than two months, while Brent crude eased further below the $111-level. Traders continue to focus on the historic Iran deal.
WTI for January delivery rose by 53 cents to $94.62 per barrel on the New York Mercantile Exchange. It stood at $94.48 at 3:45pm in Singapore. The contract dropped to its lowest level since November 20, down by 75 cents to $94.09 yesterday.
European benchmark Brent for January settlement dropped 0.11% at $110.76 a barrel on the ICE Futures Europe exchange. Brent crude was at a premium of $16.28 to WTI futures.
The world’s biggest crude consumer’s stockpiles dropped by 300,000 barrels in the week ended November 22, first decline in over two months according to forecasts ahead of the weekly official reports from the US Energy Information Administration (EIA), which is expected to be released on Wednesday.
Iran
Five permanent Security Council members, Britain, France, US, China, Russia and Germany concluded an agreement with Iran over the weekend to ease the extensive nuclear program in the country in return of an estimated $7 billion-worth of sanctions on Iran’s exports for the coming six months. As part of the six-month agreement, Iran will get access to $4.2 billion in foreign exchange, a Western diplomat confirmed to the press.
The Persian Gulf nation shipped 715,000 barrels a day in October, down from 1.26 million in September, the International Energy Agency confirmed in its monthly report.
The country holds the world’s fourth-largest oil reserves and second-largest natural gas reserves, according to data from the US Energy Information Administration (EIA).
US Inventories
Gasoline supplies are expected to show a climb by 1 million barrels last week, analysts forecasted, while distillate inventories including heating oil and diesel, are predicted to have dropped by 10.03 million barrels.
The American Petroleum Institute is expected to release a separate stockpile report late in the day.
WTI posted its longest streak of weekly losses in 15 years after the US crude inventories rose and production surged.
Visit www.hymarkets.com today and find out more on how you can how you can trade Energy products with only $50.
The post WTI Bounces Back on Stockpiles Drop Forecast appeared first on | HY Markets Official blog.
Article provided by HY Markets Forex Blog
Forex Technical Analysis 26.11.2013 (EUR/USD, GBP/USD, USD/CHF, USD/JPY, AUD/USD, GOLD)
Article By RoboForex.com
Analysis for November 26th, 2013
EUR/USD
Euro continues growing up towards target at 1.3590; right now market is forming the fifth ascending wave. We think, today price may consolidate at current levels and then start moving upwards to reach above-mentioned target. Later, in our opinion, pair may start new correction towards level of 1.3440 (as a maximum).

GBP/USD
Correction is taking place and Pound has reached its minimum. We think, today price may continue forming ascending structure towards level of 1.6350. Alternative scenario implies that pair may fall down to 1.607 and then start forming ascending structure to reach above-mentioned level.

USD/CHF
Franc rebounded from 0.9125 and right now is moving inside descending structure again. We think, today price may continue moving downwards to reach new minimum and then start new correction towards 0.9160. Alternative scenario implies that pair may consolidate for a while after reaching new minimum and then continue moving inside down-trend.

USD/JPY
Yen is forming descending impulse, which is not strong enough to continue current correction. We think, today price may continue growing up towards level of 102.60 ad then start correction to reach 99.74.

AUD/USD
Australian Dollar is trying to grow up while forming divergent triangle pattern. We think, today price may reach 0.9200 and then move downwards to reach new minimum.

GOLD
Gold is trying to from ascending wave with continuation; right now market is attempting to break descending channel. We think, today price may fall down towards 1235 and only after that, price (in case it breaks current maximum) may start new correction. Until that, main scenario suggests that instrument may continue falling down towards 1195.

RoboForex Analytical Department
Attention!
Forecasts presented in this section only reflect the author’s private opinion and should not be considered as guidance for trading. RoboForex LP bears no responsibility for trading results based on trading recommendations described in these analytical reviews.
Article By RoboForex.com
Three Irrefutable Signs We’re in a 3-D Printing Bubble
In an unsuspecting lab – tucked inside an office complex somewhere near the base of the San Gabriel Mountains – Charles W. Hull developed a system for generating three-dimensional objects by “printing” several thin layers of an ultraviolet, curable material.
Or, in layman’s terms, he developed the first 3-D printer.
You can read all about it in an obscure patent filing at the U.S. Patent and Trademark Office (#4,575,330). But here’s the most important detail of all…
The filing was made way back in 1984.
That’s right. The technology at the epicenter of hype today, which some believe will usher in the next Industrial Revolution, officially launched some 30 years ago.
What the heck took so long for the technology to take off?
The same thing that’s preventing every middle-class family from purchasing a brand spanking new, fully electric, Tesla (TSLA) Model S sedan: cost.
For years, 3-D printers were prohibitively expensive, costing more than $100,000. Fast forward to today, though, and any hobbyist with a couple grand can print as many ABS and PLA plastic tchotchkes as he wants.
But will the democratization of this truly innovative technology really spurn a mega-billion-dollar revolution? And, more importantly, is it a trend we can invest in for handsome profits?
You Missed the Boat…
Pick any old cliché about being too late: You missed the boat… The train has already left the station…
They all apply.
The time to invest in 3-D printing stocks is not now. It was back in 2010.
That’s when the innovating technology was “percolating in online discussions, at conferences and among the nerdosphere,” as The New York Times put it.
Nowadays, though, awareness of 3-D printing has gone mainstream.
Case in point: The August 2013 issue of Delta Sky Magazine includes a feature story on the technology, titled “This is Just the Beginning.”
Remember, we’re talking about an airline rag here, not a forward-looking media publication like Gizmodo or Fast Company.
I don’t think any airline magazine has successfully called a trend early. Ever.
For good measure, here are three more telltale signs we’re in a 3-D printing bubble…
~3-D Printing Bubble Sign #1: Even Gartner Sees Excessive Hype
Every summer since 1995, top tech research firm, Gartner, has released its Hype Cycle Report.
Per its own billing, the “report assesses the maturity, business benefit and future direction of more than 1,900 technologies and trends.”
In this year’s report, the hype surrounding 3-D printing got so out of hand that Gartner felt compelled to break out the trend into two components – “Consumer 3-D Printing” and “Enterprise 3-D Printing.”
And guess what? The former is perched right atop the “Peak of Inflated Expectations,” which is quite instructive…
You see, most of the hype surrounding the 3-D printing space involves the belief that every office, school and home will soon own a 3-D printer.
The truth? 3-D printers probably won’t ever go mainstream. The majority will be used by enterprises. In fact, nearly half of the global revenue generated by 3-D printers comes from prototypes and other design-related work, according to Wohlers Associates.
In turn, bidding up 3-D printing stocks on the premise that they’ll be as ubiquitous as smartphones is just plain foolish.
~3-D Printing Bubble Sign #2: Market Cap Far Exceeds Market Size
Wohlers estimates that the 3-D printing industry generated $2.2 billion in global sales in 2012.
However, the market capitalizations of the two biggest 3-D printing companies – 3D Systems (DDD) and Stratasys Ltd. (SSYS) – currently checks in at a combined $13.05 billion.
Even if the two companies collectively account for 100% of the industry, which they don’t, that implies a staggering price-to-sales ratio of 5.93 for the industry.
In comparison, the average stock in the S&P 500 Index trades at just 1.6 times sales.
If pundits think the S&P 500 is in bubble territory at 1.6 times sales, 3-D printing is way beyond that point, based on the same metric.
~3-D Printing Bubble Sign #3: Look At the Chart!
As John Maynard Keynes famously observed, “The market can stay irrational longer than you can stay solvent.”
If we look at the price chart for the 3-D printing pioneer, 3D Systems, it’s clear that we’ve entered the “irrational” stage.

When I first recommended the stock to WSD Insiders, shares traded hands at a split-adjusted $7.85. Now they fetch north of $72, representing a rally of more than 600%.
As you can see in the chart, a substantial portion of those profits came in 2013, too.
Bottom line: This is not the time to be buying into the 3-D printing hype. The downside far outweighs any further upside potential.
Turning Bubbles into Profits
Don’t fret, though. There’s still an indirect way to profit from the 3-D printing boom.
How? Well, if you take another look at the chart above, you’ll notice I included the performance of a mystery stock.
It hasn’t participated in the recent run-up for 3-D printing stocks. Yet it makes a device that’s vitally important to the long-term growth of the 3-D printing industry.
In tomorrow’s column, I’ll share the company’s identity – and, more importantly, why I’m convinced the stock could easily double from current prices. Stay tuned.
Ahead of the tape,
Louis Basenese
The post Three Irrefutable Signs We’re in a 3-D Printing Bubble appeared first on Wall Street Daily.
Article By WallStreetDaily.com
Original Article: Three Irrefutable Signs We’re in a 3-D Printing Bubble
Gold’s response to Iran resolution illustrates safe haven nature of metal
Individuals who want to make money by trading gold might benefit from knowing about how the precious metal depreciated in response to news that Iran made an agreement to cut back on its nuclear program.
The price of the commodity dropped more than 1 percent on Nov. 25, as market participants were impacted by the announcement that Iran had reached a resolution of sorts with several major nations, MarketWatch reported.
Gold plunges to lowest in more than four months
Spot gold dropped to $1,227.54 an ounce during the trading session, according to Reuters. This represented a decline of 1.2 percent for the day, and the contract fell to its lowest value since July 8. By 10:56 GMT, spot gold had risen to $1,231.66 per ounce.
After several days of talks in Geneva, Iran indicated that, in exchange for the relaxation of certain economic sanctions, it would curb its nuclear activities, according to Bloomberg. This development helped to lessen the risk aversion of many global market participants, which therefore motivated them to flee gold and instead seek assets such as equities that are considered to be more risky.
Individuals who want to make money trading gold might benefit from knowing about the impact that the latest progress in the Iran situation had on the price of the precious metal, and how these developments illustrate how major news events can lower the risk-aversion of market participants. Such a change in sentiment is generally considered bearish for gold, as the commodity has long been thought of as a safe-haven asset.
Expert: Investors lack incentive to buy gold
Jonathan Barratt, chief executive officer of Barratt’s Bulletin, told the news that the latest news has not given market participants a good reason to buy gold.
“A lot of the risk premium, the safe haven status that gold has, the reason that people bought gold is not there,” the market expert told the news source. “You can certainly see that in developments in the Middle East as well. We’re losing a lot of the riskier concerns out there and as a result, many people are revising their portfolio. It’s evidenced by the draw in the ETF market.”
In addition to the downward pressure that gold has received because of the latest progress in the Iran situation, recent data provided by the U.S. Commodity Futures Trading Commission revealed that in recent weeks, hedge funds have become highly bearish about the future of gold, according to MarketWatch. Such bets could push the metal even lower in value. This information could also be helpful for people who want to make money trading gold.
The post Gold’s response to Iran resolution illustrates safe haven nature of metal appeared first on | HY Markets Official blog.
Article provided by HY Markets Forex Blog
Japanese Candlesticks Analysis 26.11.2013 (EUR/USD, USD/JPY)
Article By RoboForex.com
Analysis for November 26th, 2013
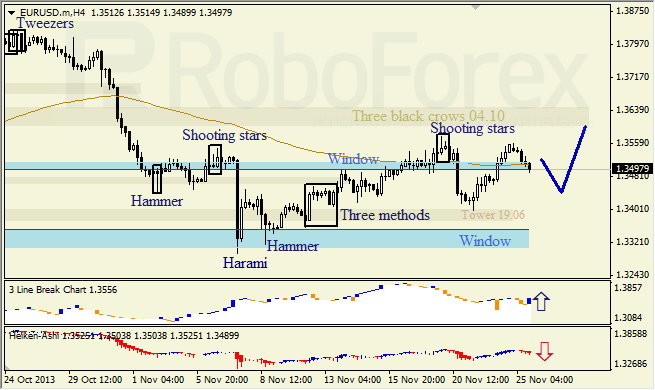
EUR/USD
H4 chart of EUR/USD shows sideways correction. Three Line Break chart indicates ascending movement; Heiken Ashi candlesticks confirm that correction continues.
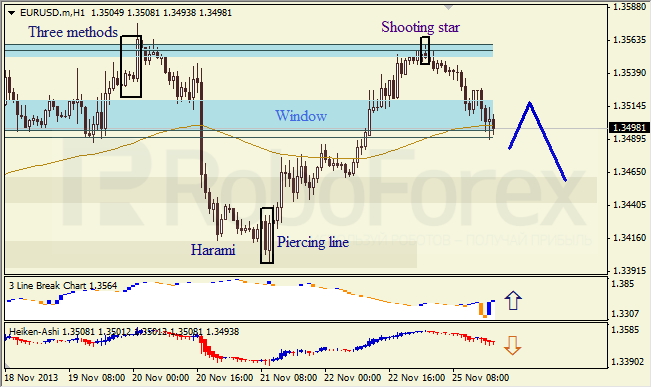
H1 chart of EUR/USD shows bearish tendency, which is indicated by Shooting Star pattern. Upper Window is resistance level. Three Line Break chart indicates ascending movement; Heiken Ashi candlesticks confirm descending tendency.
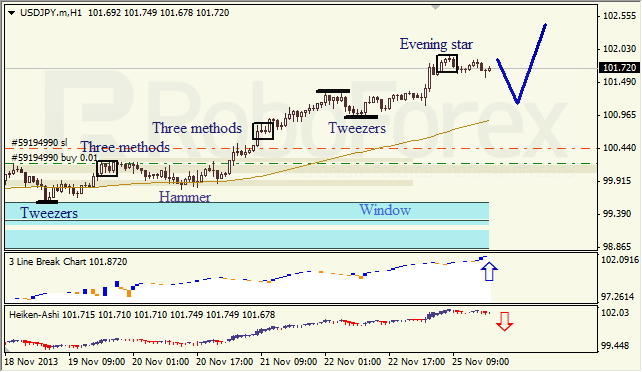
USD/JPY
H4 chart of USD/JPY shows bullish tendency. Three Line Break chart and Heiken Ashi candlesticks confirm ascending movement.

H1 chart of USD/JPY shows correction, which is indicated by Evening Star pattern. Three Line Break chart indicates current trend; Heiken Ashi candlesticks confirm that correction continues.
RoboForex Analytical Department
Article By RoboForex.com
Attention!
Forecasts presented in this section only reflect the author’s private opinion and should not be considered as guidance for trading. RoboForex LP bears no responsibility for trading results based on trading recommendations described in these analytical reviews.
JC Penney On Express Train to Oblivion
I was on CNBC this week to discuss battered retailer JC Penney (JCP), commenting that the company “is on an express train to oblivion.”
Activist investor Bill Ackman is widely blamed for running the company into the ground, and the criticism is justified. Ackman installed former Apple (AAPL) retail guru Ron Johnson as CEO, and in a span of less than two years, he managed to alienate (some might say actually antagonize) Penney’s core customer base and shrink the store’s annual revenues by a quarter.
But as destructive as Ackman was during his tenure as a major shareholder, he didn’t create Penney’s problems. Penney had been losing market share to nimbler retailers like Target (TGT), Wal-Mart (WMT) and Kohl’s (KSS) for years. In a strong retail market, a marginal player like Penney can survive and have some degree of success. But the retail market has been soft for years, particularly at Penney’s working and middle-class price points. Target, Wal-Mart and Kohl’s have all had disappointing years, and Wal-Mart has repeatedly mentioned the difficult financial conditions of its core working-class customers. If Wal-Mart is having a hard time growing, then what possible chance does Penney have of turning it around?
And this says nothing of the retail elephant in the room, internet retailer Amazon.com (AMZN) and its online peers. JC Penney has made decent progress online, as have most major retailers. But Amazon’s insistence on growth over profitability has a way of crimping the margins of virtually all its competitors.
JC Penney was slowly dying before Ackman got his claws into it. But at this stage in the game, the company will burn through its cash in less than a year unless sales show meaningful improvement. This brings up a good question: If Penney is dying, might it have value as an asset liquidation play?
Two years ago, I asked tongue in cheek if Sears was the next Berkshire Hathaway, noting that Eddie Lampert, the company chairman, was essentially doing what Warren Buffett did a generation ago: Turning a dying dinosaur into an investment holding company. Two year later, it seems that Lampert is carrying on as before, slowly selling off Sears’ valuable real estate while keeping the retail operations afloat, but just barely.
So, might JC Penney be a candidate for a similar strategy?
Well, yes, in theory. Except that Penney put its real estate up as collateral to Goldman Sachs (GS) in exchange for a lifeline loan earlier this year.
Don’t even think about buying Penney stock, even at current prices. In fact, you should use any end-of-year rally as an opportunity to short.
Charles Lewis Sizemore, CFA, is the chief investment officer of the investment firm Sizemore Capital Management. As of this writing, he was long DVA, MO and MSFT. Click here to receive his FREE 8-part investing series that will not only show you which sectors will soar, but also which stocks will deliver the highest returns. This series starts Nov. 5 and includes a FREE copy of his 2014 Macro Trend Profit Report.
This article first appeared on Sizemore Insights as JC Penney On Express Train to Oblivion