By CentralBankNews.info
Poland’s central bank held its reference rate steady at 2.50 percent, as widely expected and will explain its decision at a press conference later today.
The National Bank of Poland (NBP) has cut rates by 175 basis points this year, most recently in July when it said the cycle of easier policy had ended. Last month the bank said it would maintain rates “at least until the end of the first half of 2014.”
Poland’s inflation rate fell to 0.8 percent in October from 1.0 percent in September, well below the central bank’s 2.5 percent target.
The country’s Gross Domestic Product expanded by a stronger-than-expected 0.6 percent in the third quarter from the second for annual growth of 1.9 percent, up from 0.8 percent.
Last month the NBP said the Polish government’s expectation that the economy will grow by 2.5 percent in 2014 compared with 1.5 percent in 2013 was realistic while the OECD raised its 2013 growth forecast to 1.4 percent from a previous 0.9 percent and its 2014 forecast to 2.7 percent from 2.2 percent.
Uranium Stocks for Long-Term Investing Success?
By Sasha Cekerevac for Investment Contrarians
 Many times people ask me how I come up with my investment strategy.
Obviously, there is no one answer, but a common trick I use when developing any investment strategy is to look for areas where market sentiment still remains below peak optimism.
Following the tragic events of the Fukushima Daiichi nuclear power plant disaster in Japan, market sentiment for uranium dropped, naturally. As Japan halted all nuclear power plants, shareholders adjusted their investment strategy to get out of uranium mining stocks.
Now, the time when market sentiment is about to shift for the uranium industry, I believe, is close at hand.
The reality for energy use over the next decade is that it will grow massively around the world. Nations like China and India cannot keep up with industrial demand for energy, which is now causing huge amounts of pollution.
Chinese authorities are aware of the polluting side effects of conventional energy sources, such as coal, and are building several new nuclear power plants, which is a much cleaner energy source. Market sentiment will continue to shift in favor of uranium as more nations realize that nuclear power will continue to be with us for some time.
Adjusting your investment strategy before everyone jumps on board is important. Even Japan is now conducting analysis to re-open 14 nuclear power plants, as five utilities within that nation are requesting these energy sources be put back online.
If you’re going to look for a uranium miner to add to your portfolio, one well-established and smooth-running company to consider is Cameco Corporation (NYSE/CCJ, TSX/CCO).

Chart courtesy of www.StockCharts.com
In the latest quarter, Cameco posted revenue growth of over 102% from the same quarter in 2012. Net earnings increased by an even greater 167% year-over-year. (Source: Cameco Corporation web site, last accessed December 1, 2013.)
While market sentiment for the stock has begun to improve since October, as you can see in the multiyear chart above, the stock still remains far below previous levels.
After several years of lackluster performance, I believe that adjusting an investment strategy to at least incorporate some exposure to the uranium industry is beginning to look more appealing.
It can be difficult to go against market sentiment in one’s investment strategy. No one is talking about uranium right now; instead, everyone is focused on social media stocks and Bitcoin. However, the time to begin adjusting your investment strategy into a new sector is exactly when others are not excitedly talking about it and market sentiment remains relatively weak.
Market sentiment still remains very low for the commodity and stocks in the uranium energy sector. However, during turning points (which can last many years), you need to look past the short-term gyrations and look out over the long term to see what’s occurring at ground level.
Of course, when I’m talking about uranium and new nuclear power plants, this is a very long-term investment strategy. Market sentiment for these types of industries can take a long time to adjust.
With demand continuing to grow in nations such as China and India over the next decade, and with more regulations being applied against traditional power sources such as coal, I see uranium prices moving up over the next few years. Now is the time for smart investors to consider building an investment strategy in this energy source.
Euro Traded Flat amid Germany’s Upbeat Services PMI
The euro was flat versus the US dollar during European session on Wednesday, after a report released showed that Germany’s services Purchasing Managers’ Index (PMI) rose higher than forecasted in November.
The 17-bloc euro dropped 0.02% lower to $1.3585 against the greenback as of 8:55am GMT; before rising after the release of Germany’s final services PMI rose 55.7 points higher in November, up from the previous reading of 52.9 points seen in October.
The macroeconomic figure of the day will be the second forecast for eurozone’s gross domestic product (GDP). GDP growth is expected to remain unchanged at 0.1%. The report is expected to be released by the Statistical office of the European Union (Eurostat).
Eurozone services PMI
In Spain, the final services PMI increased to 51.5 points in November, rising from the previous reading of 49.6 points seen in October and above analysts forecast of 49.7.
The Italian services Purchasing Managers’ Index dropped to 47.2 points in November from the previously recorded 50.5 in October and lower than analysts forecast of 50.4 points.
In France, the final PMI in services stood at 48.0 in November, dropping from 50.9 seen in the previous month.
Manufacturing PMI
Factory activity in the eurozone’s largest economy showed ongoing improvement in November, rising above the 50-mark threshold for the fifth month in a row, reports from Markit Economics confirmed.
November’s final PMI Index for Germany’s manufacturing sector advanced 52.7 higher, rising above 51.7 points seen in October final reading.
Italy’s manufacturing PMI increased to 51.4 points in November, rising from 50.7 recorded in October and above analysts forecast of 50.8 points.
The French final PMI in the manufacturing sector came in at 48.4 in November and lower than the 49.1 registered in October.
ECB
The European Central Banks (ECB) is expected to announce its benchmark interest rates on Thursday, with predictions of borrowing costs to remain at its current rate of 0.25%, according to analysts.
The preliminary report released by Eurostat on November 29, showed that inflation in the eurozone rose 0.9% higher in November, up from the 0.7% seen in the previous month; marking its lowest rise in 47 months.
Visit www.hymarkets.com to find out more about our products and start trading today with only $50 using the latest trading technology today.
The post Euro Traded Flat amid Germany’s Upbeat Services PMI appeared first on | HY Markets Official blog.
Article provided by HY Markets Forex Blog
New Zealand Dollar Declines on Weak Australian GDP
The New Zealand dollar declined during the early Asian trading session on Wednesday, mirroring its Australian counterpart which was dragged lower by the weak Australian gross domestic product (GDP) growth in the third quarter.
The New Zealand kiwi edged 0.61% lower at $0.8191 against the greenback at the time of writing, while the Australian dollar dropped 0.84% against the US dollar to $0.9059 at the same time.
The Australian dollar dropped to its lowest level since October 2008 against the kiwi, trading at $1.104 per New Zealand dollar. Building activity increased 1.4% on a quarter-to-quarter basis due to a strong rise of 8.1% in residential building activity, the Statistics New Zealand data confirmed.
Statistics New Zealand also stated that the trend for all building increased in the third quarter; however the growth rate was seen to be at a slow pace.
Australian GDP
Australia’s economy grew at a steady pace but remained at a slow rate in the last quarter as the fall in the private sector investment offset higher exports and consumption.
Australia’s gross domestic product (GDP) advanced 0.6% higher in the three months to September, reports from the Australian Bureau of Statistics confirmed, dropped from the revised second quarter growth of 0.7% and below a forecast of 0.7%.
RBA
The Governor of the Reserve Bank of Australia, Glenn Stevens maintained the bank’s 2.5% interest rate, according to an official statement released on Tuesday.
According to the statement the private demand out of the mining sector was at a positive condition, but there was still a considerable uncertainty with the outlook.
“The easing in monetary policy that has already occurred since late 2011 has supported interest-sensitive spending and asset values,” Stevens said “The full effects of these decisions are still coming through, and will be for a while yet,” he added.
Visit www.hymarkets.com to find out more about our products and start trading today with only $50 using the latest trading technology today.
The post New Zealand Dollar Declines on Weak Australian GDP appeared first on | HY Markets Official blog.
Article provided by HY Markets Forex Blog
Bill Williams’ Indicators Analysis 04.12.2013 (USD/CAD, NZD/USD)
Article By RoboForex.com
Analysis for December 4th, 2013
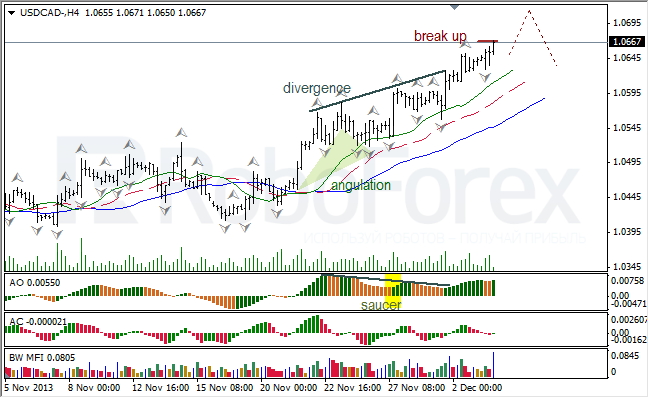
USD/CAD
At H4 chart of USD/CAD, Alligator is moving northwards. Price is forming bullish fractal; AO is in green zone; there might be Squat bar on the MFI. I expect slight breakout of fractals to the upside.
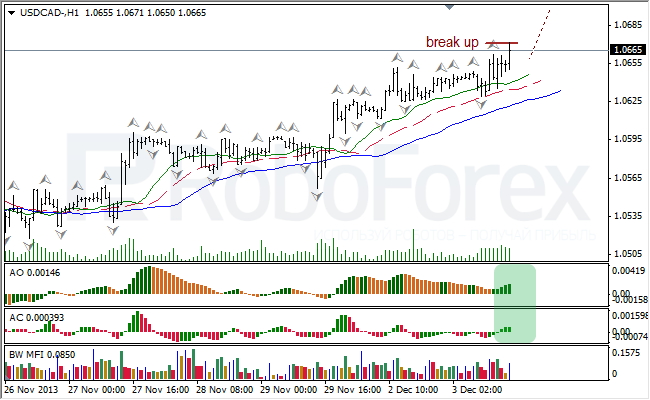
At H1 chart of USD/CAD, Alligator continues moving upwards. Indicators are in green zone; there is Squat bar on the MFI. I expect breakout of fractals to the upside.
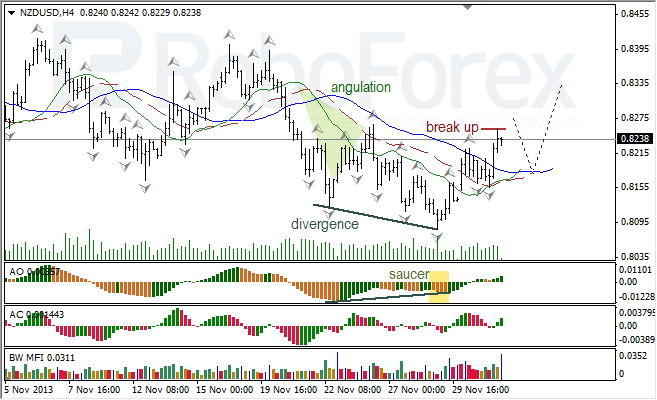
NZD/USD
At H4 chart of NZD/USD, Alligator is reversing upwards. Price is forming bullish fractal; indicators are in green zone; there might be Squat bar on the MFI. I expect breakout of fractals to the upside.
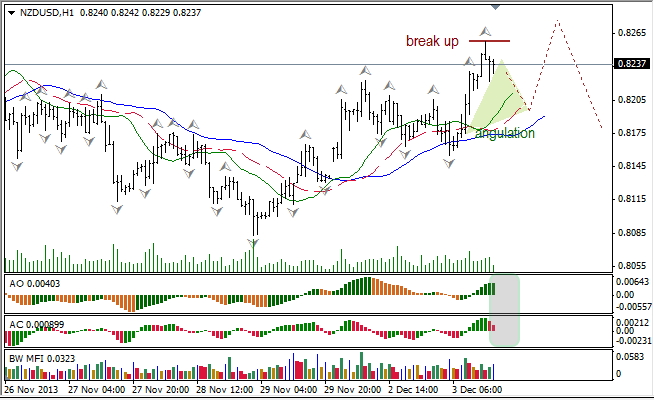
At H1 chart of NZD/USD, Alligator is moving northwards. Angulation is open; AO and AC are in grey zone; there is Green bar on the MFI and might be Squat one too. Bearish fractal may reach Alligator’s teeth (red line) and then I expect slight breakout of fractals to the upside.
RoboForex Analytical Department
Article By RoboForex.com
Attention!
Forecasts presented in this section only reflect the author’s private opinion and should not be considered as guidance for trading. RoboForex LP bears no responsibility for trading results based on trading recommendations described in these analytical reviews.
No surprises should be expected from EuCB
Eur/Usd:
Current week is very interesting and eventful. On Monday and Wednesday all participants of Eur/Usd trades will receive report from the Institute for Supply Management with manufacture figures and the report on the US service sector. Data on the US labor market will be published on the last trading day of the week. It is worth mentioning that over the last time,positive news prevails over negative and releases can be just above expectations. FRS will carefully study Friday’s report on labor market in the view of making decisions regarding future cut of the QE3 program.
For European currency, core event of the week will be EuCB meeting scheduled for Thursday, 5th of December. In the end of the recent week, Consumer Price Index was released and showed growth in the rate of 0.2%. Now we can expect that European regulator will take a time-out in the task of cutting interest rates. In the terms of technical analysis, breakthrough of a strong resistance level 1.3645 will open a path to 1.37.
In general, a flat trend within the range of 1.3450-1.3700 can be expected for the European currency.

Article by freshforex.com
A Telltale Sign of Economic Strength
Apparently, I threw one faithful reader for a loop yesterday when I agreed with Nobel Prize-winning economist Robert Shiller’s assessment that the U.S. economy “is still weak and vulnerable.”
Here’s what Rick H. wrote in to say: “Is the always optimistic, super bullish and esteemed Louis Basenese suddenly becoming more pragmatic, perhaps even pessimistic? Say it ain’t so!”
Well, it ain’t so!
A bit of clarification is in order: I agree with Shiller that the U.S. economy is vulnerable, not that it’s weak.
I mean, with so much debt and money printing, there’s a lot that could go wrong with Bernanke’s grand monetary experiment.
Not to mention that politicians still don’t seem to care about holding the economy hostage (again and again) as they hash out their ideological differences.
Both conditions certainly make the economy vulnerable. However, that doesn’t mean we’re on the brink of another collapse or one step away from being put on life support.
To the contrary, there are several bastions of strength that suggest the U.S. economy is becoming less and less vulnerable.
Just ask Nomura’s strategist, Michael Kurtz. In his outlook for 2014, titled “The End of the End of the World,” he notes, “The Global Financial Crisis is over. Not that clocks have simply rewound to 2006, but: The U.S. property market has been recovering for no less than 20 months, the U.S. household balance sheet is largely repaired and the U.S.-China current account imbalance [is now] vastly reduced.”
Rick H., if that’s not enough to convince you, here’s an undeniably optimistic chart just for you…
Consumers Step on the Gas
With the holiday shopping season underway, everyone is laser-focused on consumer spending habits. After all, the consumer accounts for a sizeable 42% of U.S. GDP.
But holiday shopping is a one-off event. It’s dangerous to make sweeping assumptions about the health of the consumer – and, in turn, the economy – based on a brief spurt of activity.
It’s much more instructive to track trends over longer periods of time.
Like automobile and light truck sales, for instance. Why? The answer can be found on any local radio or television ad. As they all say, “If you’ve got a job, you can buy a car.” And if you don’t, well… you can’t.
So car and truck sales provide insights into the health of the labor market. I think we can all agree – a stronger labor market makes for a stronger economy.
As you can see in this chart, auto sales are actually a leading indicator. They keep climbing as more and more people get back to work.
Some will try to discount this connection, arguing that the official unemployment rate, known as U-3 unemployment, conveniently excludes three groups of people. I agree with the knock against U-3 and have said as much before.
Rest assured, though, that this long-term relationship between auto sales and unemployment still holds true if we use the broadest and most inclusive measure – U-6 employment. The reason I used U-3 in the graph is because the data goes back further.

With that being said, let’s get to the most important thing…
Throughout the day yesterday, automakers reported November monthly sales. There’s no way to interpret the data as anything but bullish…
- Land Rover reported its best November ever.
- Jaguar’s sales more than doubled year-over-year.
- Mitsubishi reported 6,071 deliveries, up 62.3% from November 2012’s results.
- South Korean automaker, Hyundai, reported record sales volume – delivering 56,005 cars.
- And daily sales volumes in November at Chrysler, Ford and GM were up 7.4%, collectively.
All told, WardsAuto projects that total sales for November will check in at a seasonally adjusted rate close to 16.3 million units.
To put that into perspective, October light auto sales came in at a seasonally adjusted rate of only 15.17 million units. So we’re talking about a sharp acceleration in only one month’s time.
Come Friday morning, when the Bureau of Labor Statistics releases its November jobs report, I suspect that we’ll see a steady improvement, too.
Bottom line: By no means am I predicting boom times ahead for the U.S. economy. But any talk about pervasive weakness is sorely misplaced. In fact, the latest auto sales data points to a strengthening economy, not a deteriorating one.
Ahead of the tape,
Louis Basenese
The post A Telltale Sign of Economic Strength appeared first on Wall Street Daily.
Article By WallStreetDaily.com
Original Article: A Telltale Sign of Economic Strength
Japanese Candlesticks Analysis 04.12.2013 (EUR/USD, USD/JPY)
Article By RoboForex.com
Analysis for December 4th, 2013
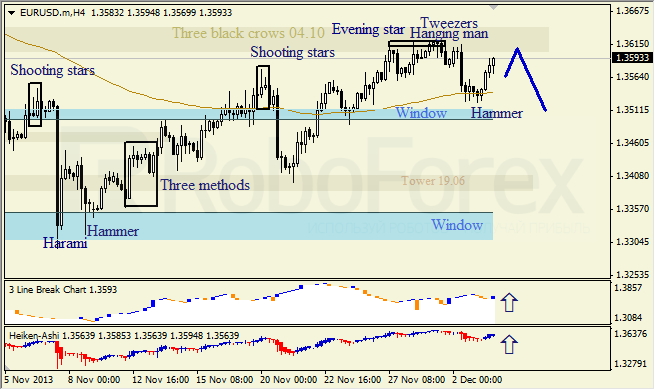
EUR/USD
H4 chart of EUR/USD shows sideways correction, which continued after bearish patterns, Evening Star, Hanging Man, and Tweezers. Closest Window is support level. Three Line Break chart and Heiken Ashi candlesticks confirm ascending movement.
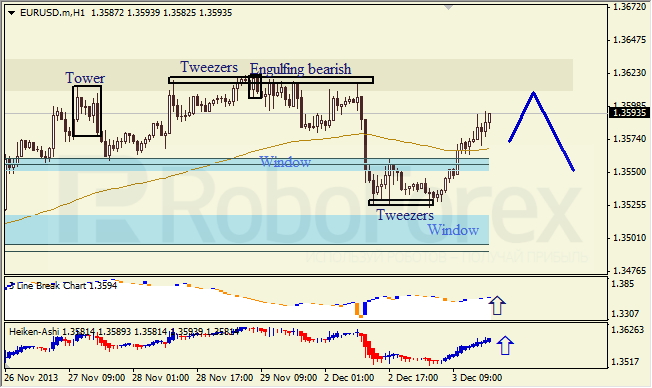
H1 chart of EUR/USD shows bullish tendency, which started after Tweezers pattern. Three Line Break chart and Heiken Ashi candlesticks confirm ascending movement.
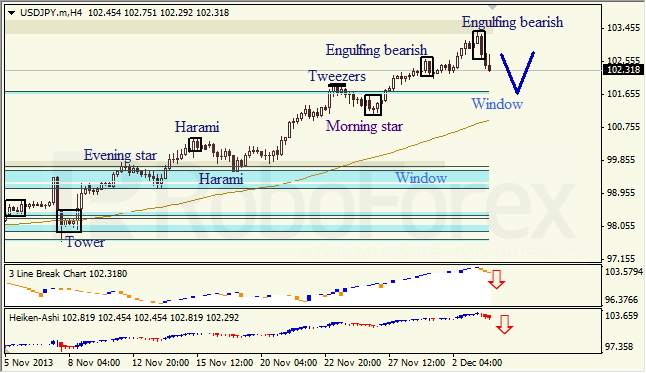
USD/JPY
H4 chart of USD/JPY shows correction, which started after Engulfing Bearish pattern. Three Line Break chart and Heiken Ashi candlesticks confirm descending movement.
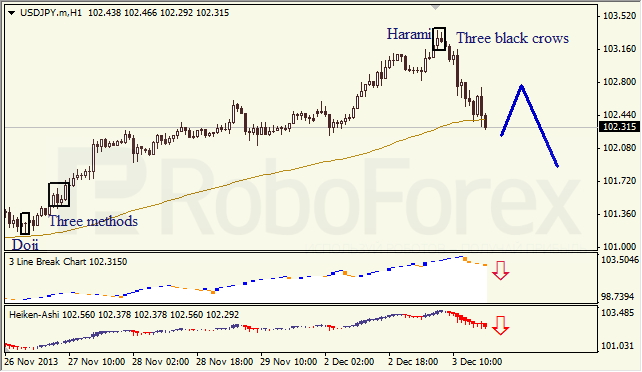
H1 chart of USD/JPY shows correction, which is indicated by Harami and Three Black Crows patterns. Three Line Break chart and Heiken Ashi candlesticks confirm descending movement.
RoboForex Analytical Department
Article By RoboForex.com
Attention!
Forecasts presented in this section only reflect the author’s private opinion and should not be considered as guidance for trading. RoboForex LP bears no responsibility for trading results based on trading recommendations described in these analytical reviews.
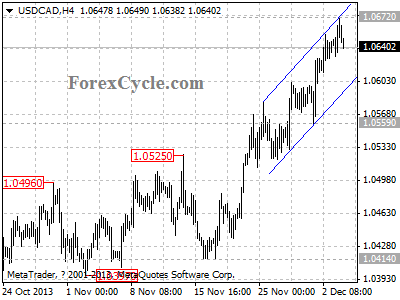
USDCAD’s upward movement extends to 1.0672
USDCAD’s upward movement from 1.0414 extends to as high as 1.0672, the subsequent fall suggest that consolidation of the uptrend is underway. Support is located at the lower line of the rising price channel on 4-hour chart, as long as the channel support holds, the uptrend could be expected to resume, and another rise towards 1.0700 could be expected after consolidation. On the downside, a clear break below the channel support will indicate that the uptrend from 1.0414 had completed at 1.0672 already, then the following downward movement could bring price back to 1.0500 zone.
Provided by ForexCycle.com
What Does Our Resources Expert Think About Gold Stocks?
At what point does a crash stop being a crash and become an opportunity?
That’s the conversation your editor had with Diggers and Drillers resources analyst Jason Stevenson yesterday afternoon.
But we weren’t talking about any old crash.
We were talking about one of the biggest crashes of the past three years.
That’s right, gold and gold stocks.
We wanted to know Jason’s view on whether now was the right time to buy…
Let’s look at the evidence.
First, the overall position of commodity prices. This week the Reserve Bank of Australia released the latest Index of Commodity prices. It’s not a pretty picture for mining companies.

There’s no doubt the index of commodity prices looks remarkably like the price chart of most asset bubbles.
It has the initial surge, the sell-off, followed by the recovery as investors assume the worst is over, and finally the beginning of the real crash.
If most other asset bubbles are anything to go by, commodity prices could have much further to go. But what about gold and gold stocks? Well, if you think the above chart looks bad, just wait until you see these next charts…
The Big Bubble That Never Quite Happened
We’re sure you remember when the gold price hit US$1,921 in September 2011. It seemed that a rise to US$2,000 and above was inevitable.
We’ll admit that we thought it was inevitable. We thought it could be the big one…gold would soon trade at US$2,000 then US$3,000 and perhaps even US$5,000.
But that never happened. In fact, gold went the other way. This morning it’s trading at US$1,221. As we said at the start of this year, even though we’re still happy to buy gold, the great gold bull market is on hold for now.
How long it will stay on hold is anyone’s guess. All we know is that the worst won’t be over until even the biggest gold market bulls have finally given up. At that point the next phase of the gold bull market will begin.
That could take months, and more likely, years.
But it isn’t just the gold price that has taken a pounding. Below is a chart for the Market Vectors Gold Miners ETF [NYSE: GDX] and the Market Vectors Gold Junior Miners ETF [NYSE: GDXJ]:

These indices have fallen 66.5% and 78.5% respectively since September 2011.
Over the past year, just when it seemed they couldn’t fall any further, they’ve defied belief and…fallen further. As an optimist on the future and on stock prices, it’s tempting to think that this is the bottom for gold stocks.
But do we have 100% conviction on that? And more importantly, does our resources analyst?
Pit-Bull v the Sober Analyst
We put the question to Jason yesterday.
You’ve got to understand that your editor is like a pit-bull yanking at the leash eager to make the most of the collapse in resources stock prices.
So it’s fortunate that we’ve got a resources analyst like Jason who can take a sober and analytical approach to resource stocks. Like your editor, Jason likes the fundamentals for gold, and he likes the potential for big gains from gold stocks.
What he’s not so keen on is trying – as he put it – ‘to catch a falling knife‘ as some of these gold stocks continue to fall.
Now you may think that as contrarian investors we should plunge in to recommend these stocks. And it’s possible Jason will do that. He’s running the numbers on a bunch of resource stocks right now.
But remember what we’ve said before. Contrarian investing isn’t about doing the opposite of everyone else, it’s about getting into an opportunity just ahead of everyone else. In other words, just before or just as the market changes direction.
Of course, you’ll never get the timing perfectly right as a contrarian investor. Sometimes the market stops falling, but it can take months before it turns higher. That could mean locking up your money for some time while you wait.
Waiting for the ‘No-Brainer’ Day to Buy Gold Stocks
As it stands today gold stocks are super risky. But if you’re a speculator that may be just the kind of risk you’re happy to take. If you’re a more conservative investor, because Jason still sees some risks that gold stocks could fall further, you may want to wait a little longer before taking a punt on gold stocks.
Naturally, that view could change at any point over the days, weeks and months ahead.
One thing’s for sure: the combined value of all gold stocks won’t fall to zero. At some point there will be a clear no-brainer decision to buy gold stocks.
We’ve written in Money Morning previously that we see the resources sector as one of the best places to earn speculative gains in 2014. As the dedicated resources analyst for the investment newsletter Diggers and Drillers Jason Stevenson is excited about the potential as well.
The task now is to find the best stocks on the market, value them, and then make a decision on when to buy. That will be a tall order with over 1,000 resources stocks on the ASX…
But it’s a challenge Jason is prepared to take.
Cheers,
Kris+
From the Port Phillip Publishing Library
Special Report: The ‘Wonder Weld’ That Could Triple Your Money