What are the Investors expecting from the FOMC Meeting?

Article by Investazor.com

Can we consider today to be the beginning of the end of the Quantitative Easing program? Well looking backward to the economic data we could see some reasons for Fed ti start tapering from today, after the FOMC meeting. But even if we were to be sure of a tapering it wouldn’t be enough to know for sure the direction market will take.

The markets are waiting for a good reason to take a certain direction. The expectations for today are for the Fed to:

–          Take no action. Fed could not start the QE tapering nor say nothing about a certain date when it will happen. This could trigger high volatility and the market could become bearish on the US dollar.

–          Not start tapering, but announce a certain date when they will and turn to a hawkish tone. This could have a higher impact on the market and the dollar could spike.

–          Start tapering the QE with less than 10B a month. This action is pretty expected by the market, so it might not have a very big impact, but on short term the US dollar might gain.

–          Start tapering heavily with more than 10B. This would be a big surprise and the volatility might get through the sky. The dollar could rally from the first seconds to the end of this week.

These are the market expectations as for now.

17 of the main commercial banks (Citi, BNP, Barclays, Goldman, Nomura, Credit Suisse, DBank, JPM, BOFAML, RBS and Soc Gen are only a bunch of them) have announced their expectations for today’s meeting.

Two of these are expecting a tapering starring from today, six are betting on a January tapering, three of them are going for March and the rest are holding back. So from what we see the higher probability remains somewhere around the middle. There are equal chances for starting the tapering with less than 10B or no taper but some details regarding when it will start.

eurusd-before-the-fomc-meeting-resize-18.12.2013

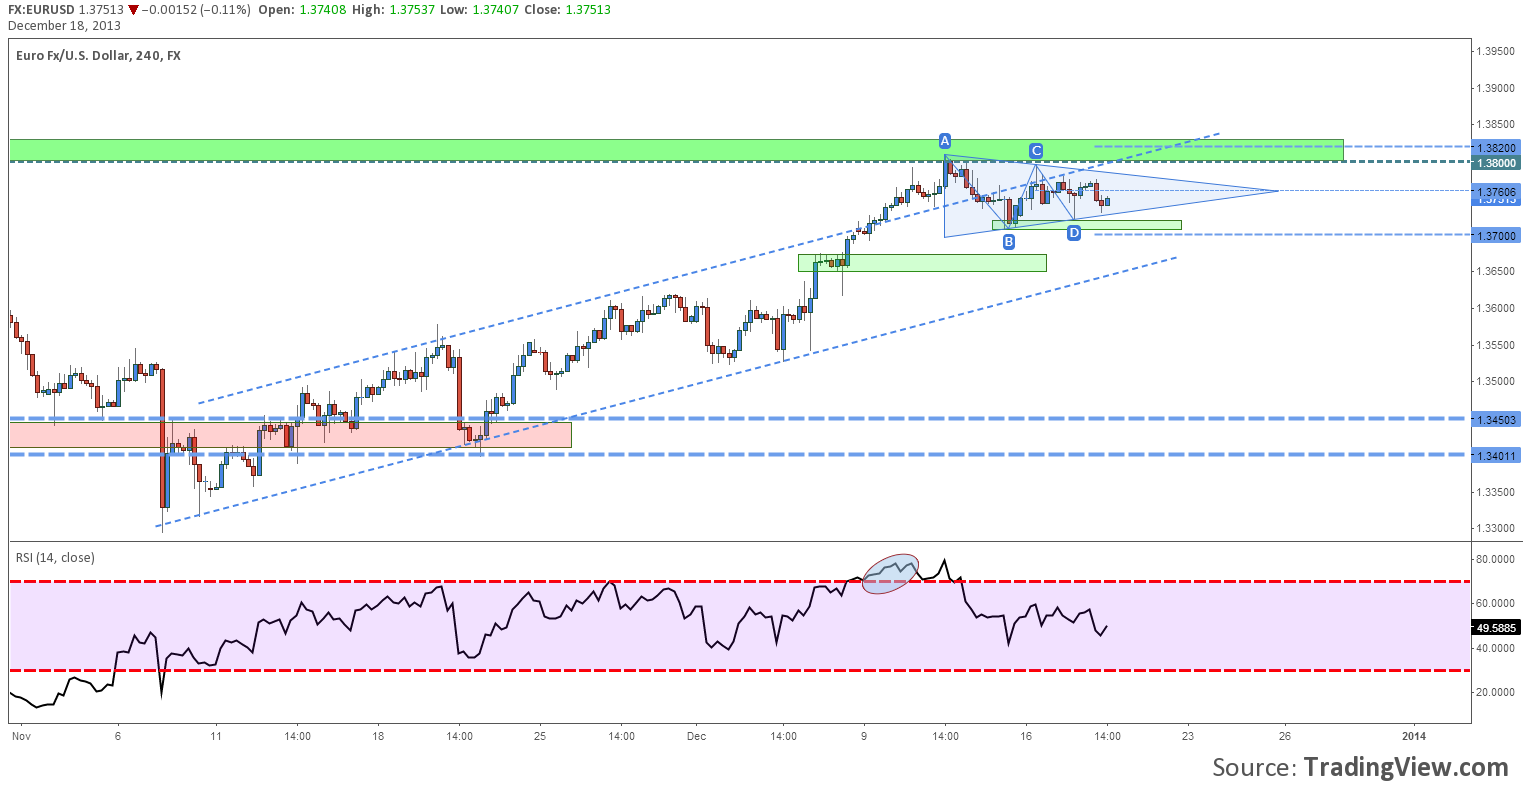
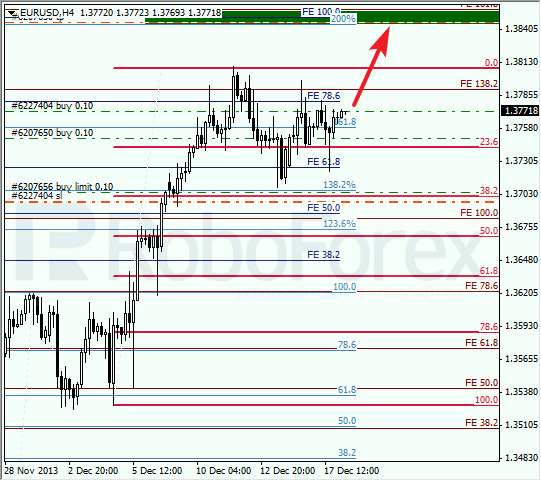
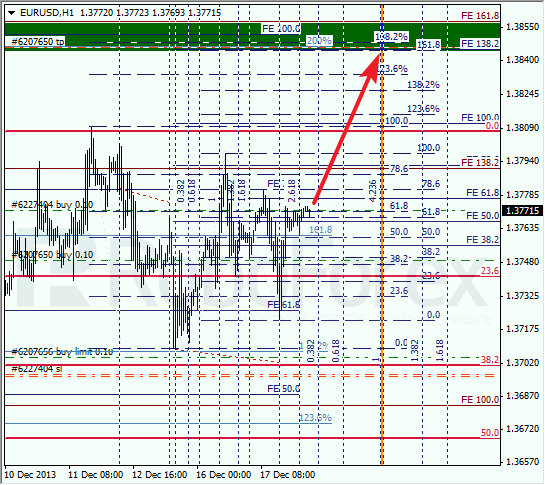
For the technical point of view we are looking at the most traded currency pair in the Forex market, EURUSD. Its price has consolidated in a symmetrical triangle right under 1.3800 and above the up channel trend line. If we stick to probabilities we would then think that is better to get with the bulls and wait for an upside breakout, followed by a rally above 1.3820 (latest high).

On the other hand the sceptics would say that a surprise could get the dollar back on its feet and 1.3700 support will be broken and a drop wouldn’t be stopped until 1.3600.

We are telling you to play it safe. If you would like to have a higher probability for your trade wait for the FOMC meeting, see where the market is heading and take action. If you would like to take a risk, then take it smart. Our favorite play for this event would be a Long Outside European Option, especially on the FX market.

Set a range of 1.5 or 2x the daily average of the FX (this way you will have a pretty nice risk reward for you option) and an expiry date for tomorrow, this way you will keep your premium as low as possible  and get a pretty nice payout. For an example we took a Long Outside E.O. for the EURUSD with the Trigger Price 1 at 1.3820 and the Trigger Price 2 at 1.3680. Outside this range we will have a payout 5 times higher than the Premium we paid. If the price will remain inside the range, our risk is limited to the amount we already paid.

The post What are the Investors expecting from the FOMC Meeting? appeared first on investazor.com.

The Mirage Called a “U.S. Economic Recovery”

By for Daily Gains Letter

U.S. Economic Recovery“Just give up being so negative; there’s economic growth in the U.S. economy.”

These were the exact words of my good old friend, Mr. Speculator. Over the weekend, when I received a call from him, he added, “You see the average American is better off than before. There are jobs; and no matter where you look, you won’t find much negativity. Look at the stock markets; they probably will show a 30% increase for 2013.”

Sadly, Mr. Speculator has become a victim of the false assumptions that seem to prevail in the markets these days. He’s basing his conclusion on just a few indicators that he looked at from just the surface, not looking much into the details. For example, the stock market doesn’t really portray the real image of the U.S. economy, but it’s used as one of the indicators.

Here’s what is really happening in the U.S. economy that keeps me skeptical.

First of all, jobs growth in the U.S. economy has been center stage for some time. I agree that the unemployment rate has gone down, but I ask where the jobs were created. In November, for example, we saw the unemployment rate in the U.S. economy reach seven percent, and it sent a wave of optimism across the mainstream. Sadly, a major portion of the jobs created for that month were in the low-wage-paying industries. Mind you; this has been the trend for some time now. (Source: “Employment Situation Summary,” Bureau of Labor Statistics web site, December 6, 2013.) In periods of real economic growth, you want equal jobs creation, which we are clearly missing in the U.S. economy.

Secondly, Americans really aren’t better off than they were before—incomes are declining. Consider this: between 2007 and 2012, the real median household income in the U.S. economy has fallen by more than eight percent. In 2007, the median household income registered at $55,627. In 2012, it declined to $51,017. (Source: Federal Reserve Bank of St. Louis web site, last accessed December 13, 2013.) In times of real economic growth, you want to see increasing incomes.

Thirdly, more and more individuals in the U.S. economy are seeking the help of food stamps. In September, there were more than 47.3 million Americans on food stamps. This number has grown significantly over the past few years. (Source: United States Department of Agriculture, “Supplemental Nutrition Assistance Program,” United States Department of Agriculture, Food and Nutrition Service web site, December 6, 2013.)

Last but not least, over the past few years, consumer confidence in the U.S. economy has increased, but it is nowhere close to where it was before the financial crisis. Take a look at the chart below of the University of Michigan Consumer Sentiment index, which is an indicator of consumer confidence in the U.S. economy.

Univercity of Michigan Chart

Chart courtesy of www.StockCharts.com

To me, what I have mentioned aren’t indicators of economic growth in the U.S. economy, and this is what keeps me skeptical. On the surface, the indicators are creating a sort of mirage that suggests a false truth—the reality of which is very unpleasant.

For investors, this means the key stock indices, whose performance relies on the overall state of the economy, are running beyond reality. They may face turbulence ahead if the economic factors remain bleak. Investors seeking to profit from the decline in key stock indices may want to look at exchange-traded funds (ETFs), like the ProShares Short Dow30 (NYSEArca/DOG).


Source: http://www.dailygainsletter.com/economy/the-mirage-called-a-u-s-economic-recovery/2241/


Bitcoins – a Glimpse Overview about Its Nature

Guest Post by Miles Wiseman

Some of you have already heard about the bitcoins. So, most of you have some perceptions regarding these. Generally, bitcoin is described as digital currency in non-government. It is also sometimes being called as a cyber currency or a crypto currency. Those descriptions are good enough to describe the bitcoins. But for you to understand it more clearly, just keep in touch with the succeeding topics and discussions. This article will provide you a great notion when it comes to Forex trading including the use of a bitcoin.

Bitcoins are being used by the anonymous traders all over the internet. This is being done without the participation of any financial institutions. Some of the Bitcoin users are saying that this kind of currency being presented could be a means in order to avoid the taxes. In some cases, this might be true, but only in the instances that users of these bitcoins are doing some illegal works that may lead to tax evasion. Though using Bitcoins constitutes negative result to some aspects, still, there are some traders who are continually using these.

Uses and Functions of Bitcoins

The use of the bitcoins as one form of foreign exchange can be considered useful for some people. However, the functions of it may go directly towards negative results. As of year 2012, some other black-market commodities and the sales of drugs which were accounted for more than 20% of exchanges from the bitcoins to US$. Therefore, this kind of currency is being used in making illegal actions all over the country. Many traders tend to use this as their means of purchasing products and services through online because they are trying to evade on the taxes which must be paid for the transaction. Aside from that, illegal actions and negotiations are being conducted. That’s why; their account must be seen anonymously.

In some point, the uses of bitcoins extend on its good side. There are still several consumers who are looking for way in order to trade using bitcoins. They are still using this currency but in a good form or way (you can buy or sell common things, such as T-shirts, cosmetics or tools). If you are one of them who would like to use this currency as a means for trading online, then you can possibly use it for good. However, you need to take some essential considerations prior to buy bitcoins and to use it in Forex. The following guide will help you in purchasing bitcoins for trading:

· Before starting to buy bitcoins for your online transaction, you should understand first all the possible risks associated with it. First and foremost, you have to bear in your mind that there is no guarantee in using a bitcoin. These can’t guarantee any sources unlike some other currencies such as dollars, pounds or euros. In fact, these are not issued by the government or any financial banks. Thus, there is no accountability just in case you want to trace it. You can’t even foretell if where the bitcoins came from since anyone can use on an online basis.

· Read some reviews about the bitcoins and the Forex which will guide you for your future transactions. Never quit looking for more information about your online business so that you can have an assurance that you will end up winning.

· If you don’t have any idea about using bitcoins in the foreign exchange markets, then you could probably solicit some pieces of advice from any experts. You can ask from your friends and relatives who know a lot when it comes to this trading.

By these things being cited above, it would be possible now to cater all your needs when it comes to bitcoin foreign exchange. You may just take a glimpse on the given data and you will know how essential these things to some other people.

In some cases, the use of bitcoins was already banned by some financial banks. China, which is one of the countries that is aware of the issue, has already warned some particular banks about the bitcoins. The country warned some banks not to accept this crypto currency in relation to the anti fraud and money laundering act. Though this warning is already made, still, anyone has the freedom to use and buy bitcoins as long as that they will be liable for the risks that might happen. And the PBC is not accountable for whatever losses it might bring to you since it is not connected on the banks and the government.


About the Author

Miles Wiseman is a blogger and a writer who takes particular interest in finance and insurance. He writes about all the interesting things related to forex such as exchange rates, currency conversion, etc.


Shares in Asia Advances Ahead of Fed-Meeting Conclusion

By HY Markets Forex Blog

Shares in the Asian region were mostly seen trading higher on Wednesday, ahead of the Federal Reserve’s conclusion on its monthly asset-purchasing program. The Federal Reserve began its two-day policy meeting on Tuesday and expected to end today, as market analysts predicts the central bank would begin to scale-back on its $85 billion monthly stimulus program following the meeting conclusion.

Earlier this year, the Chairman of the Federal Reserve Ben Bernanke said the US economy is recovering, especially in the job market and with the recent string of positive data.

The Japanese benchmark Nikkei 225 index came in 1.62% to 15,522.56 points at the time of writing, while the Tokyo’s broader Topix index rose 1.05% higher to 1,245.14 points.

Shares – China

In China, Hong Kong’s benchmark Hang Seng index rose 0.61% higher to 23,211 points at the time of writing, at the same time the mainland benchmark Shanghai Composite dropped 0.03% to 2,151.63 points.

Shares – Australia

Australia’s benchmark S&P ASX 200 index edged 0.12% lower at 5,097.00 points as of 5:05am GMT.

The Governor of the Reserve Bank of Australia (RBA) Glenn Stevens said the bank did not rule out the option of lowering interest rates even further, individuals and firms have to take advantage of the situation.

“They have to be willing to take a risk – on a new project, a new product, a new market, a new worker. Monetary policy can’t force spending to occur,” Stevens said in the statement.

The Aussie rose after the statement release, jumping to $0.8928 against the US dollar.

In New Zealand, the NZX 50 index dropped 1.10% as of 5:05am GMT to 4,675.88 points. Economic indicators released on Wednesday, revealed the third-quarter current account data rose to its highest deficit since 2008.

The business outlook survey from ANZ, showed confidence climbing to the highest level in almost 15 years, rising to 64.1 higher in December from 60.5 in the previous month.


Win a luxurious trip to the Maldives & up to $30,000 cash for trading with us!

Visit for details http://alturl.com/2kysk 

The post Shares in Asia Advances Ahead of Fed-Meeting Conclusion appeared first on | HY Markets Official blog.

Article provided by HY Markets Forex Blog

Oil Prices Rises as Crude Stockpiles Drops

By HY Markets Forex Blog

Crude oil  prices were seen trading higher on Wednesday, as the Federal Reserve Open Market Committee (FOMC) is expected to end its two-day meeting today. While investors await a conclusion on what the central bank will decided over its $85 billion monthly asset-purchasing program, a fresh data on US stockpiles is expected to be released from the Energy Information Administration (EIA).

West Texas Intermediate (WTI) for January delivery gained 24 cents to $97.46 per barrel on the New York Mercantile Exchange at the time of writing.  At the same time the European benchmark Brent crude for February settlement rose 0.1% higher to $108.59 per barrel on the ICE Futures Europe exchange. Brent crude was at a $10.86 premium to WTI for the same month.

Oil Prices – Federal Reserve Meeting

Market participants are expecting to hear an announcement from the Federal Reserve (Fed) Chairman Ben Bernanke after the Federal Reserve’s two-day meeting, on when and whether the central bank would begin to taper its monthly stimulus bond-buying program.

The $85 billion monthly stimulus program has supported the markets and commodity prices, to strengthen the world’s largest economy.

Analysts are expecting tapering to begin following the meeting, due to the improved labour market and the string of positive data which shows the health of the US economy is improving.  While some analysts are predicting the central bank will maintain its stimulus till next year to get more evidence that the US economy’s recovery is stable.

Oil Prices – US Inventories

The US Inventories report from the Energy Information Administration (EIA) is expected to be released on Wednesday, with forecasts of drop of 2.186 barrels in the latest week.

According to reports from the American Petroleum Institute, crude inventories declined by 2.5 barrels in the week ended December 13, to 367.8 million barrels.

Oil Prices – Libya

Crude prices were also affected by the oil supplies from Libya, as the country’s oil production dropped from more than 1 million barrels a day to 110,000 barrels per day.


Get $100 FREE Funded into your MT4 Account as well as many more amazing benefits! Register with HY Markets today.

http://www.hymarkets.com/english/reg/reg.hyml …

The post Oil Prices Rises as Crude Stockpiles Drops appeared first on | HY Markets Official blog.

Article provided by HY Markets Forex Blog

Profit Play on the Great Disappearing “Corporate Earnings Growth” Act

By for Daily Gains Letter

Corporate ProfitsAs many of you already know, the gross domestic product (GDP) estimate for the third quarter came in above estimates at 3.6%, with most of the increase coming from higher inventory levels.

But I would like to look at something slightly different than the inventory buildup. I think we are all aware of what happens when inventory builds and consumers don’t buy—corporate profits get hit. However, looking at the data a bit closer, there are more worrisome signs aside from excess inventory that are also pointing to tough times ahead for corporate profits.

The S&P 500 has had a stellar run since its bottom in 2009. Part of the reason for this is that corporate profits have expanded tremendously as firms cut costs through massive layoffs, as well as lower financing payments through the cheap money provided by depressed interest rates. But this might be coming to a close, as corporate profits for S&P 500 companies appear to be peaking.

According to the latest data from the U.S. Department of Commerce, third-quarter corporate profits on an after-tax basis were a record 11.1% as a share of GDP. (Source: “National Income and Product Account, GDP 3rd Quarter 2013,” U.S. Department of Commerce, December 5, 2013.)

What this means is that the S&P 500 companies are generating extremely high profit margins. Obviously, this alone is not bad; however, business is always cyclical. We will always move from peaks to troughs, and corporate profits and margins are no exception.

Wall Street analysts continue to tell people that the S&P 500 is a buy, because they are taking the data from the past couple of years showing growth in corporate profits and extrapolating it out over the next couple of years.

The problem is that the way firms have generated growth in corporate profits is eroding. Over the past year, companies are actually beginning to hire new workers, albeit at a relatively slow pace. The net result is higher costs. Interest rates are beginning to move upward, too; again, this is a higher cost.

Revenues are not accelerating for S&P 500 companies. Most of the growth in corporate profits came from cost-cutting, not revenue growth.

Many analysts continue to believe corporate profits will grow 10%–15% next year, but if revenues are not increasing and costs are beginning to rise, this simply doesn’t add up.

Even the growth in corporate profits for S&P 500 companies is beginning to decelerate. Domestically, corporate profits generated by non-financial companies in the third quarter increased to $13.0 billion, a much lower level than the $37.8 billion of corporate profits generated in the second quarter.

I think we are already witnessing a deceleration in corporate profits, and many investors and analysts are far too optimistic in their belief that the S&P 500 companies can continue driving growth to the bottom line.

S&P 500Large Cap Index Chart

Chart courtesy of www.StockCharts.com

As the S&P 500 has recently continued moving higher, another worry for me is a negative divergence between the index and the moving average convergence/divergence (MACD) indicator. Essentially, the momentum appears to be decreasing, even as the S&P 500 moves higher. This doesn’t necessarily mean that the S&P 500 has made a top, but it is yet another worrisome sign for investors at these lofty levels.

For those investors who believe that the S&P 500 might pull back and want to profit over the short term, I would look to such inverse exchange-traded funds (ETF) as the ProShares Ultra Short S&P500 (NYSEArca/SDS), which moves up as the S&P 500 moves down.

This particular ETF seeks for an inverse of two times the return of the S&P 500 on a daily basis. Over the long term, leveraged ETFs will not mimic their specific indices in such a manner, but as short-term hedges, they might be suitable, depending on each investor’s risk profile.


Source: http://www.dailygainsletter.com/stock-market/what-wall-street-is-forgetting-in-corporate-profits/2245/


If Money Printing Failed in Japan, Why Would It Work in the U.S.?

What the Federal Reserve is doing in the U.S.—its effort to get the economy going via its money printing program—has already been tried by the second-largest economy in the world: Japan.

Unfortunately, the easy monetary policy implemented by the Bank of Japan didn’t spur the Japanese economy. So why would it work for the U.S. economy?

One of the core purposes of easy monetary policy by the Federal Reserve was to improve lending so businesses would borrow money and grow (hopefully creating jobs) and consumers would borrow and spend (creating economic activity). All of this would lead to improved consumer confidence.

The Bank of Japan started a scheme to increase lending in Japan in 2010. It gave funds to its biggest banks to lend to companies. It set aside 21.5 trillion yen for this scheme; but sadly, only 8 trillion yen has been used. (Source: Reuters, October 17, 2013.) Easy money policies, and a program specially designed to give money to banks to lend out to companies, did not work in the Japanese economy.

And consumer confidence in the Japanese economy remains bleak. The index that tracks consumer confidence in the country stood at 41.9 in November. At the beginning of the year, it hovered near 45.0. A subset of consumer confidence, an index tracking consumers’ willingness to buy durable goods, stood at the lowest level of the year in November at 42.4 compared to 44.9 in January. (Source: Japan’s Cabinet Office, December 10, 2013.) The bottom line: after years of easy money policies and with a national debt-to-GDP multiple of 205%, there’s been no improvement in consumer confidence or consumer spending in the Japanese economy.

By no surprise, growth in the Japanese economy is now becoming questionable. An indicator that can suggest where an economy might be heading, capital spending, is declining in the Japanese economy again.

According to the Japanese Cabinet Office, the value of machine orders received by 280 manufacturers operating in the Japanese economy plunged by 4.6% in October from the previous month. This was the first decline since July. (Source: Japan’s Cabinet Office, December 10, 2013.)

What has happened and what is happening in the Japanese economy is a major concern to me. While the easy monetary policy wasn’t able to bring growth to that country, it did other things; it devalued the Japanese currency and created a stock market bubble.

The Japanese currency has reached a multiyear low due to too much yen (freshly printed new money) in the system. To see how bad the yen has deteriorated in value, look at the chart below of the Japanese Yen index. It compares the Japanese currency to a basket of other major world currencies.

Chart courtesy of www.StockCharts.com

Looking at all this, I can’t help but come to the conclusion that we are on the same path the Japanese economy took. Our stock market has taken the shape of a bubble, and the U.S. dollar continues to buck the trend downward. We all know what happens next.

This article If Money Printing Failed in Japan, Why Would It Work in the U.S.?  is originally publish at Profitconfidential


Why These Particular Markets Will Be More Attractive to Investors in 2014

By for Daily Gains Letter

Investors in 2014The U.S. stock market rally has been on a solid run this year, thanks in large part to the Federal Reserve’s $85.0-billion-per-month quantitative easing policy—well, that and some solid economic indicators. But the question remains: will the momentum continue into 2014?

It all depends on whether or not the U.S. stock market rally follows the laws of physics. For example, when it comes to momentum, an object will continue unless force is applied against it, either a huge amount of force all at once or an applied force over a given period of time. On the other hand, the more momentum something has, the harder it is to stop.

The fuel that has helped propel the U.S. stock market rally over the last number of years could be flickering out. Thanks to better-than-expected employment and retail numbers and strong preliminary gross domestic product (GDP) numbers, many think the Federal Reserve will start to taper its quantitative easing strategy sooner than later.

The end of easy money, some think, could put a cramp in the stock market’s four-year-plus rally—or at least make it run a little more slowly in 2014 than it did in 2013. Whereas the S&P 500 is up roughly 25% year-to-date, analysts think it will grow by as little as six percent and as much as 11% in 2014. This means that the S&P 500 will experience another year of record-highs in 2014, but not quite as bullish as 2013. (Source: “Here’s What 14 Top Wall Street Strategists Are Saying About The Stock Market In 2014,” Business Insider web site, December 13, 2013.)

Those looking to outpace the U.S. stock market rally might want to diversify their portfolios with a more global bent. The first reason for this is because there are a lot of excellent companies out there trading on different international stock markets at this time. Plus, it doesn’t make sense to miss out on a global stock market rally that outpaces America’s stock market rally just because of a bias toward Wall Street.

Diversifying globally can also help reduce your risk or vulnerability should the U.S. stock market rally run out of fuel or experience some sort of turmoil. There are a lot of excellent companies from emerging markets that can and do stand on their own two feet when it comes to revenues and earnings.

And when you factor in the number of global economies that are expanding and the number of central banks that are going to continue to inject their own quantitative easing, you’ll discover there are more and more reasons to explore international stock markets and exchange-traded funds (ETFs).

Those who think Germany and France will continue to help propel Europe’s recovery may want to look at the Vanguard FTSE Europe ETF (NYSEArca/VGK). Some of this ETF’s top holdings include Nestle S.A., Royal Dutch Shell plc, Roche Holding AG, Novartis AG, BP p.l.c., and GlaxoSmithKline plc.

Many think emerging markets will have continued momentum in 2014. Compared to the S&P 500’s six-percent gain, Asian stocks are predicted to climb 13% in 2014, led by China’s Shanghai composite index. While 2013 was unkind to Latin American stocks, 2014 could be a different matter altogether. Stocks are forecast to gain, on average, 11%—with Brazil’s Bovespa index leading the way with an 18% gain. (Source: “Steadier gains expected for world stocks in 2014 – Reuters poll,” Reuters, December 13, 2013.)

Those looking for exposure to the emerging markets could research the Vanguard FTSE Emerging Markets ETF (NYSEArca/VWO). This ETF’s holdings include Petroleo Brasileiro S.A., China Construction Bank Corporation, China Mobile Limited, and Taiwan Semiconductor Manufacturing Company Limited.


Source: http://www.dailygainsletter.com/investment-strategy/investors-forced-to-look-outside-u-s-in-2014/2239/


Bill Williams’ Indicators Analysis 18.12.2013 (USD/CAD, NZD/USD)

Article By RoboForex.com

Analysis for December 18th, 2013

USD/CAD

At H4 chart of USD/CAD, Alligator is sleeping. AC is in green zone, AO is near balance line; angulation is closed; there might be Squat bar on the MFI. After bullish fractals, I expect breakout of fractals to the downside.

At H1 chart of USD/CAD, Alligator is moving upwards. AO is in green zone, AC is near balance line; there might be Squat bar on the MFI. Bearish fractal may reach Alligator’s teeth (red line); then I expect breakout of fractals to the upside and downside.

NZD/USD

At H4 chart of NZD/USD, Alligator is still sleeping. AO and AC are near balance line; there might be Squat bar on the MFI. I expect breakout of fractals to the upside.

At H1 chart of NZD/USD, Alligator is sleeping. AO and AC are in red zone; there might be Squat bar on the MFI. After bearish fractal, I expect breakout of fractals to the upside.

RoboForex Analytical Department

Article By RoboForex.com

Attention!
Forecasts presented in this section only reflect the author’s private opinion and should not be considered as guidance for trading. RoboForex LP bears no responsibility for trading results based on trading recommendations described in these analytical reviews.


Fibonacci Retracements Analysis 18.12.2013 (EUR/USD, USD/CHF)

Article By RoboForex.com

Analysis for December 18th, 2013

EUR/USD

Eurodollar is still consolidating. After local correction, I opened my second buy order. In the future, price is expected to break maximum and continue growing up towards upper fibo-levels.

As we can see at H1 chart, there a several fibo-levels at the top. According to analysis of temporary fibo-zones, pair may reach its targets during Wednesday. I’ll move stop into the black as soon as price reaches new maximum.

USD/CHF

Franc reached new minimum. Probably, market is going to move towards lower levels, that’s why I opened short-term sell order during local correction. Stop is placed at local maximum.

At H1 chart we can see, that lower target area is formed by six fibo-levels. Possibly, pair may reach new minimums during the day. According to analysis of temporary fibo-zones, predicted targets may be reached tomorrow.

RoboForex Analytical Department

Article By RoboForex.com

Attention!
Forecasts presented in this section only reflect the author’s private opinion and should not be considered as guidance for trading. RoboForex LP bears no responsibility for trading results based on trading recommendations described in these analytical reviews.