By CentralBankNews.info
Poland’s central bank held its reference rate steady at 2.50 percent, as widely expected, along with its other main rates, and said in a brief statement that it would provide further details at a press conference later today.
The National Bank of Poland (NBP) cut its rates by 175 basis points in 2013 and repeated last month that it would keep rates unchanged at least until the end of the first half of 2014. Last July the central bank said its cycle of easing had ended after rates were cut by 225 basis points since November 2012.
Poland’s inflation rate fell to a five month low of 0.6 percent in November, below expectations, from 0.8 percent in October. The NBP targets 2.5 percent inflation.
Poland’s Gross Domestic Product expanded by 0.6 percent in the third quarter from the second quarter for annual growth of 1.9 percent, up from 0.8 percent.
In November the OECD raised its forecast for Poland’s 2013 growth to 1.4 percent from a previous 0.9 percent and the 2014 forecast to 2.7 percent from 2.2 percent. In 2012 Poland’s economy grew by 1.9 percent.
Romania cuts rate 25 bps to 3.75%, 5th cut a row
By CentralBankNews.info
Romania’s central bank cut its policy rate by 25 basis points to 3.75 percent, its fifth rate cut in a row, and lowered the minimum reserve requirements on both domestic and foreign currency liabilities by banks.
In a brief statement, the National Bank of Romania said the reserve requirements on leu-denominated liabilities would be cut by 300 basis points to 12 percent while foreign currency liabilities would be cut by 200 basis points to 18 percent starting from the Jan. 24-Feb. 23 maintenance period.
Further details about the central bank’s decision would be released at a press conference later today.
Romania’s central bank cut its rate by 125 basis points in 2013, most recently in November, in response to falling inflation.
In its November inflation report, the bank revised down its forecast for end-2013 inflation to 1.8 percent from 3.1 percent, and the 2014 forecast down to 3.0 percent from 3.1 percent. The central bank bank, which targets inflation of 2.5 percent within a one percentage point band, said it expected inflation to fall below its lower bound during the first half of this year and then gradually rise.
Romania’s inflation rate eased to a new low for the year of 1.83 percent in November, down from 1.88 percent in October and a 2013-high of 6.0 percent in January. The fall in inflation was due to lower agricultural prices due to a good harvest and a cut in taxes on bread and other bakery products.
The cut in reserve requirements comes after the central bank in December released a report into the reporting of bad bank debts that showed that the proportion of non-performing bank loans was 21.7 percent at the end of October.
Forex Trading Results in EUR/USD Rising in 2013
Forex trading has resulted in the EUR/USD pair rising in value in 2013. Those who trade the pair may benefit from knowing that the changes in the value of the two currencies were attributed by many to the stimulus of the central banks in both the U.S. and the euro zone. In addition, it was noted that speculation surrounding the actions that these financial institutions will take going forward was factored into the fluctuating value of the exchange rate.
EUR/USD rose last year
In 2013, the common currency rose more than 4 percent against the greenback. It is important to note the differences between the monetary policies being used by the Federal Reserve and the European Central Bank, as Kathleen Brooks, research director at Forex.com in London, told the news source that the latter is experiencing a decline in its balance sheet, while the former is still seeing increases.
The Fed announced at the conclusion of a policy meeting in December that beginning in January 2014, it would reduce the amount of bonds it purchased on a regular basis to $75 billion per month instead of the prior figure of $85 billion. Even though the financial institution indicated that its transactions were slowing, the balance sheet of the organization recently surpassed $4 trillion.
Brooks told the media outlet about how the changing policies of the Fed could result in the greenback rising in value.
“Once the Fed’s balance sheet starts to contract then we could see the dollar strengthen sharply, although this is unlikely to happen at all next year,” she told the news source.
Economic data key to tapering, says expert
However, another market expert emphasized that the pace with which the financial institution gradually reduces and then eliminates its bond purchases will hinge largely on the strength of the figures that are released in relation to the economy, according to Reuters.
“We think things are going to be very data-dependent,” Paul Chappell, chief investment officer of U.K.-based hedge fund manager C-View, told the news source. “At the moment that looks like U.S. numbers are going to be relatively robust compared with some other G7 peers, so the dollar is likely to be relatively robust versus other developed country currencies.”
Central Banks moving in different directions
Regardless of what the economic figures look like further down the road, central banks in varying jurisdictions are moving in vastly different directions in terms of their use of policy to affect the economy, according to Bloomberg. For example, the European Central Bank, which was scheduled to hold a meeting during the week starting on Jan. 6, has mostly made an effort to push stubbornly low price levels higher through the use of stimulus.
“The world’s main central banks have very different things going on, which is an opportunity for investors,” Scott Thiel, managing director, deputy chief investment officer of Fixed Income, Fundamental Portfolios and head of European and & Global Bonds for BlackRock Inc., told the news source. “It’s very important to look at the economies close to inflection points on monetary policy.”
Thiel predicted that central banks across the world have begun their slow withdrawal from using bond purchases to help manage economic growth and inflation, and that the move made by the Fed to start reducing these transactions represents the start of this new trend.
Another factor that could easily have an impact on the decisions of those who trade forex pairs such as the EUR/USD is the benchmark rates that central banks have. In November, the ECB announced its forecast that the 18-nation region could easily run into a “prolonged period” where the price level rises at a very modest rate, according to Bloomberg News.
In addition, Fed officials recently stated that they plan to keep their key rates low “well past the time that the unemployment rate declines below 6.5 percent,” the media outlet reported.
While it seems that both of these financial institutions will likely keep their borrowing costs low for some time, one market expert noted that the ECB may need to purchase assets if inflation in the euro zone does not pick up to adequate levels, according to Bloomberg.
Ken Wattret, who works for BNP Paribas SA in London as an economist, told the news source that the officials in the region’s central bank may opt to start off by buying private-sector securities since they have not formed a consensus opinion on whether they should purchase government debt.
A willingness to engage in further stimulus has been indicated by Mario Draghi, president of the ECB, the media outlet reported. This key official has promised to keep interest rates at a low level for an “extended period,” and has refrained from indicating that rates cannot be cut any further.
Such a situation could easily have any impact on forex trading and the value of the EUR/USD.
The post Forex Trading Results in EUR/USD Rising in 2013 appeared first on | HY Markets Official blog.
Article provided by HY Markets Forex Blog
Fibonacci Retracements Analysis 08.01.2014 (EUR/USD, USD/CHF)
Article By RoboForex.com
Analysis for January 8th, 2014
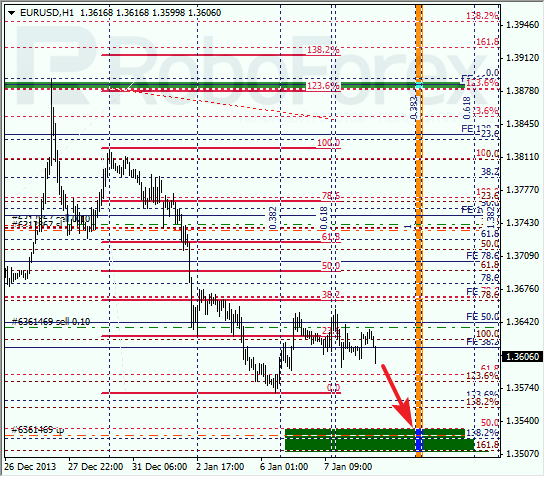
EUR/USD
Eurodollar is still moving downwards. Possibly, pair may beak current minimum during Wednesday. If later price rebounds from lower levels, market may start new correction.
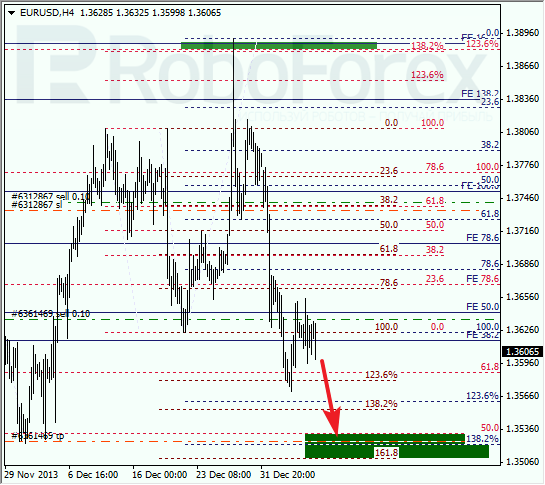
Yesterday, after pair completed correction, I opened one more sell order. Market has almost reached level of 38.2%. According to analysis of temporary fibo-zones, predicted targets may be reached during the day.
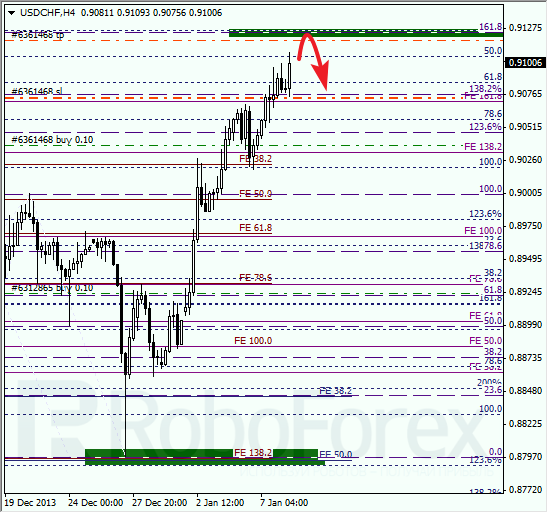
USD/CHF
Franc continues breaking maximums; market has almost reached several fibo-levels located in upper area. I’ve moved stops on my buy orders to latest maximum in order to secure some part of profit.
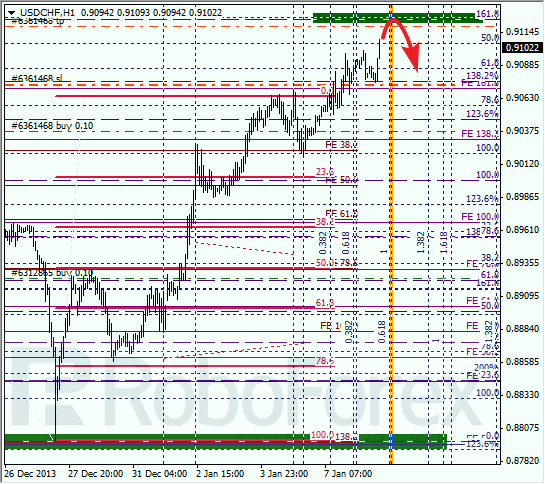
At H1 chart we can see, that market is about to reach temporary fibo-zone quite soon. Local correction, which took place earlier, turned out to be quite short, and then price broke maximum. In the near term, instrument is expected to start deeper and more serious correction.
RoboForex Analytical Department
Article By RoboForex.com
Attention!
Forecasts presented in this section only reflect the author’s private opinion and should not be considered as guidance for trading. RoboForex LP bears no responsibility for trading results based on trading recommendations described in these analytical reviews.
Ichimoku Cloud Analysis 08.01.2014 (GBP/USD, GOLD)
Article By RoboForex.com
Analysis for January 8th, 2014
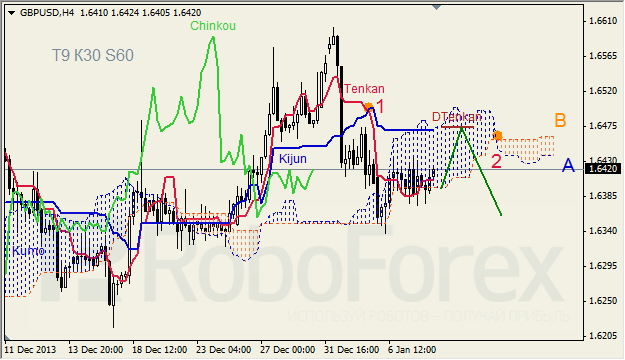
GBP/USD
GBPUSD, Time Frame H4. Tenkan-Sen and Kijun-Sen are influenced by “Dead Cross” (1). Ichimoku Cloud is going down (2); the price is on Tenkan-Sen, inside Kumo Cloud. Short‑term forecast: we can expect support from Tenkan-Sen – Senkou Span B, and resistance from Kijun-Sen – D Tenkan-Sen.
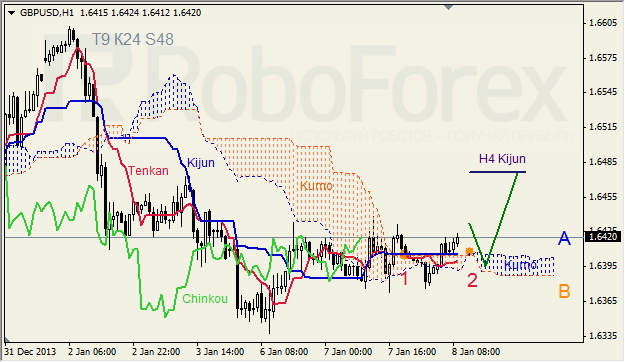
GBPUSD, Time Frame H1. Tenkan-Sen and Kijun-Sen intersected and formed “Dead Cross” (1). Ichimoku Cloud is going up (2), and the price is above the lines. Short‑term forecast: we can expect support from Tenkan-Sen – Senkou Span B, and growth of the price.
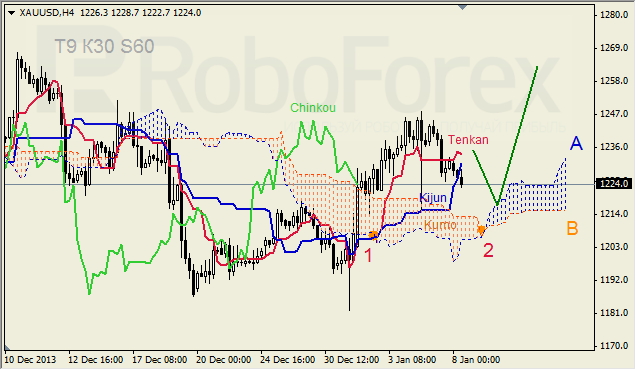
GOLD
XAUUSD, Time Frame H4. Tenkan-Sen and Kijun-Sen are influenced by “Golden Cross” (1); Kijun-Sen and Senkou Span A are directed upwards. Ichimoku Cloud is going up (2). Short-term forecast: we can expect support from Senkou Span A and growth of the price.
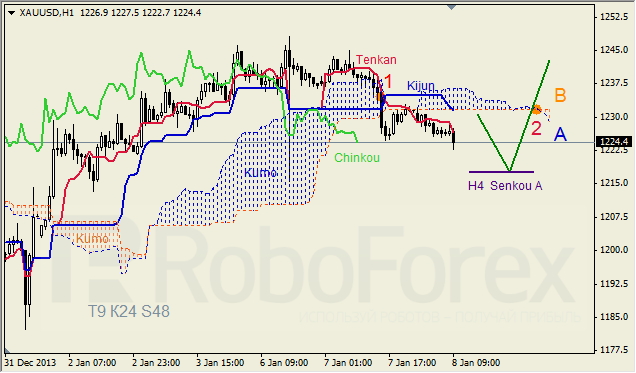
XAUUSD, Time Frame H1. Tenkan-Sen and Kijun-Sen intersected and formed “Dead Cross” (1); Senkou Span B is horizontal, other lines are directed downwards. Ichimoku Cloud is going down (2), and the price is on Tenkan-Sen. Short‑term forecast: we can expect support from H4 Senkou Span B.
RoboForex Analytical Department
Article By RoboForex.com
Attention!
Forecasts presented in this section only reflect the author’s private opinion and should not be considered as guidance for trading. RoboForex LP bears no responsibility for trading results based on trading recommendations described in these analytical reviews.
Simple USDJPY Scalping Strategy on EMA and Stochastic
Article by Investazor.com
As we said it before, scalping could be a good way to make some fast money, especially if you don’t have too much time to spend in front of your PC as a trader. But to stay on a good a profitable path, in time you should test several scalping systems before trading your real money.
In our trading experience we observed that there really are trading strategies that do not have to be complex or hard to be applied to make money. Sometimes there are simple strategies that help traders get to constant profits. And the probability for this to happen rises with a good money management system applied to a simple strategy.
We back tested and live tested the following strategy and now we are putting it on our website for you to test and give us your feedback. It is a pretty simple strategy that uses a slow EMA and a default Stochastic (which is actually pretty fast, comparing it to the EMA) on a 1 minute USDJPY chart.
Why USDJPY? We saw in our testing that this currency pair gave us the best results without making many changes to the initial strategy. This major FX pair it is usually trending and has a medium volatility. Taking these into consideration we can say that it is a medium risk pair and can be used easily with a scalping strategy.
Let us now get to our strategy:
– We used a 224 EMA on a 1 minute time frame. The slow EMA sets the trend and we used it as a support line, betting on a bounce after the price hits it.
– Stochastic (14, 3, 3) on 1 minute chart. It is a default Stochastic, which has given pretty good signals. We were looking for oversold/overbought signals when the price touched the EMA.
– For even better filtering we also looked for Candlestick patterns to raise the probability for a good entry.

In our example, you can see that the 224 EMA is below the price, meaning that the trend is up. In this case it is important to wait for pullbacks to the moving average. It will offer support, but to have better buying signals we should also look if the Stochastic fell in an oversold area and comes back (giving also a buying signal) and if we have a Candlestick pattern.
If these three conditions are met (see the second example with the Morning Star) we can enter a trade right after the Candlestick pattern is confirmed (on the opening of the next candle). Set a Stop Loss below the pattern and below the EMA and a Take Profit at a distance 2 times further than the Stop Loss. This way you will have also a positive money management.
It is important for the price to get very close to the EMA, or even better to touch or cross the moving average. This way it will assure you a tighter and safer Stop Loss.
Changes can also be made to the strategy. Instead of using Candlestick patterns you can also use price patterns like Double Bottoms, Rectangles and triangles. These kinds of patterns usually give stronger signals, but you will need to have patience and wait for them to be drawn. Another change would be divergences on the Stochastic. Instead of simple overbought/oversold, this oscillator also makes divergences and these are also stronger signals of reversal.
We gave only an example on an uptrend, but the strategy works as well on a downtrend, you will just have to see the 224 EMA above the price, wait for overbought signals from the Stochastic and see Bearish Candlestick Patterns.
The post Simple USDJPY Scalping Strategy on EMA and Stochastic appeared first on investazor.com.
EURUSD remains in downtrend from 1.3892
EURUSD remains in downtrend from 1.3892, the rise from 1.3571 could be treated as consolidation of the downtrend. As long as 1.3680 resistance holds, the downtrend could be expected to resume, and the target would be at 1.3400 area. On the upside, a break above 1.3680 resistance will indicate that the downward movement from 1.3892 is complete, then further rise to 1.3780 area could be seen.

Provided by ForexCycle.com
Is the Stock Market Approaching Bubble Territory?
Here’s an easy question for you.
Are stock markets in or approaching bubble territory?
Of course, it depends which stock markets we’re talking about.
But if you answered yes then we’d have to agree. Generally speaking stock markets are in or approaching bubble territory.
That’s got to be bad news right? It’s got to mean stock markets are primed to crash. That’s the argument put forward by the bubble watchers.
But as we’ll show you today, a stock price bubble doesn’t always mean a crash is imminent. In fact, it can be the pre-cursor to the bubble growing further.
Just ask the Danish…
We’ll make something clear, just in case you’re not sure of where we stand. We’re not one of those zombie lame-brained mainstream analysts who think the world has recovered from the 2008 meltdown.
We’re not one of those dopes who urged governments and central banks to intervene.
And we’re not one of those stock market cheerleaders who think it’s always a good time to invest in stocks. If you’re a long-time Money Morning reader you’ll know we’ve advised readers to get into stocks when things look good, and get out of stocks when things look bad.
So when we tell you it’s still a great time to own stocks, you can be sure that we believe it.
Bubbles Burst When They Burst and Not Before
OK. Now we’ve made that clear, we can make our point.
A common mistake made by bubble watchers is to assume that once they’ve spotted a bubble that bubble must immediately burst.
They don’t seem to accept the possibility that already stretched valuations can stretch even further. Or that company earnings could improve so that the valuation remains the same even though the price may go higher.
But the stock market is only half the ledger. The other side of the ledger is the debt market. The assumption on both sides of the debt debate is potentially flawed.
On the one hand those who rail against high debt levels say that central banks can’t do anymore with interest rates. They say that it’s inevitable that interest rates will rise. And when interest rates do go up it will spell trouble for borrowers, banks, companies, and the economy.
On the other hand, those who say the high debt levels don’t matter, argue that interest rates won’t go up, but that they won’t go down either. They say central banks have done as much as they can and that interest rates are now structurally – and potentially permanently – low.
But there is another possibility. And that’s where the Danish enter the frame…
Paying to Save
According to Bloomberg News, Denmark has the world’s highest household debt levels. The report notes:
‘Danish households owe their creditors 321 percent of disposable incomes, according to the Organisation for Economic Cooperation and Development. That’s the highest ratio in the world and a level that has prompted warnings from both the OECD and the International Monetary Fund to rein in borrowing.‘
As you’d expect, the Danes are eager to say that high household debt levels aren’t a problem. We’re sure the Danes are also fond of saying, ‘Det er anderledes her.’ That’s Danish for, ‘It’s different here.’
And maybe they’re right. Who knows?
For all those saying Denmark has a problem and should be worried, well, what if things are different there? What if Denmark provides a clue of what could happen elsewhere? What if Denmark has found a way to inflate bubbles further than most think possible?
That’s a heck of a lot of questions. And remember, we’re not saying any of this is desirable in the long run. All we’re saying is that folks shouldn’t be in a hurry to shout about bubbles if there’s a chance the bubble could keep expanding.
So, what’s the Danish secret?
Well, since 2012 the Danish central bank has operated a negative interest rate policy of minus 0.1%. That means in effect that banks have to pay in order to hold cash on deposit with the Danish central bank.
Needless to say, that’s not ideal for Danish banks. Why would they waste their capital by holding cash at the central bank when they could use it more effectively…by lending the money to borrowers?
Hence household debt currently standing at 321% of household income.
Denmark Proves Central Banks Can Cut Further
You can only imagine the impact negative interest rates have had on asset prices.
Like many countries, Denmark went through a housing bubble leading into 2008. And like many countries the housing bubble popped. But since early last year the market has begun to recover. No doubt low interest rates have helped.
But the place where low interest rates have really made their mark is in the Danish stock market. The OMX Copenhagen 20 index is up 160.7% since the 2009 low.
That’s three times better than the Aussie market performance, and it’s even better than the US S&P 500 index, which has ‘only’ clocked up a 148.5% gain.
This is why we caution people about selling stocks too early because they think they’ve identified a bubble. Remember, many cautioned during the mid-1990′s about the emerging internet stock bubble.
They were right to caution about it, but probably wrong to sell or short sell stocks seeing as even the blue-chip S&P 500 index gained 218% from 1995 to 2000. That’s a pretty good return.
The way we see it is that sure a stock bubble is forming, but it’s nowhere near the top. As we’ve warned, that doesn’t mean you should put all your money into stocks. But it does mean if you’re out of the market you’re also missing out on a lot of gains.
Contrary to popular opinion, the US Federal Reserve, European Central Bank, Bank of England, Bank of Japan, and even the Reserve Bank of Australia can still cut rates lower if they want. Look at Denmark. Maybe negative interest rates are on the way. How attractive would cash be in that scenario?
Cheers,
Kris+
From the Port Phillip Publishing Library
Special Report: 574 Years in the Making
The Six-Letter Solution for 2014 Profits
What is a six letter word that’s great for the markets and your portfolio?
G-R-O-W-T-H.
In case you didn’t know, last month marked the hundredth anniversary of the crossword puzzle. The New York World published the very first one on Dec. 21, 1913. It was originally called the ‘Word Cross’, designed by Arthur Wynne. Since then, they’ve become been a fun diversion and a helpful tool for building a better lexicon in any language.
My grandparents introduced them to me as a small child. They would both do the puzzles from the New York Times, Philadelphia Inquirer as well as the now folded Philadelphia Bulletin. Doing the puzzles with my grandfather gave me my initial workout on words and research as well as disappointments when those last few words just wouldn’t come together to finish one of them off.
It formed the foundation for how I approach problems today – including puzzling out what’s going on in the markets.
So it seems appropriate to start this note with a crossword clue for a word that’s currently on every investors’ lips…G-R-O-W-T-H.
In December, the U.S. Department of Commerce reported that the economy expanded by 4.1% in the third quarter – almost back to the heady growth seen in the days before the financial fiascos of 2007-2008. Not only was it well above the initial estimates…it was also much better than analysts were expecting.
In addition, the internal rate of price inflation was actually down from earlier preliminary indications. The Core Personal Consumption Expenditure Index (PCE) was said to be rising by 1.5% – well below the 2.5% the Federal Reserve Bank’s Open Market Committee warned would be the signal to tighten money. But now it seems that the PCE is only rising at a rate of 1.4%.
Both the GDP and PCE indicate that the economy is faring better. Consumers are spending, businesses are investing and inflation is still tame by the official standards.
So fears of FOMC tightening should be set aside, and the markets should look for better performances by more and more companies – justifying higher stock prices.
And with lower inflation pressures – at least in the index that matters more to investors and the Fed – the value of dividend-paying income investments should also see the benefit of less of an attack from inflationary conditions.
In addition to the nice bit of economic news, the guys and gals in the US Senate also did some good work for the markets late last year by passing some budget legislation, including the budget for the Defense Department.
While there is still some further work on debt limits, for the most part we’re seeing Congress’ financial brinksmanship getting pushed back in the closet.
This means less uncertainty – and even if the deal isn’t what we as taxpayers might prefer, the markets like it when things get done and there’s some degree of knowing what’s coming.
So, good growth, lower inflation and stability. That should lead us into the New Year with a positive start.
Adding to the mix, of course, is that the Fed also assured us that they will keep spending $75 billion a month on Treasuries and mortgage securities – continuing to swell its portfolio by the trillions of dollars.
And not only will the Fed keep buying new debt, but all of the coupon payments and maturities of its massive Treasury and mortgage portfolios will keep being re-invested – meaning that the $75 billion is just part of the massive continued bond buying that’s not going away any time soon.
Our six-letter trend (G-R-O-W-T-H) looks set to payoff in 2014.
All my best,
Neil George
Contributing Editor, Money Morning
Ed Note: The Six-Letter Solution for 2014 Profits was originally published in Daily Resource Hunter.
Why This Company Should Be a Case Study in Business Schools
In the pursuit of reliability and consistency in business performance, AAON, Inc. (AAON) came through once again by reporting another record quarter.
I’m absolutely convinced that any equity market portfolio is well served by having at least some exposure to what I refer to as “old economy” types of businesses. AAON is a Tulsa, Oklahoma-based company that manufactures and sells heating, ventilation, and air conditioning (HVAC) equipment to industrial customers.
In the third quarter of 2013, the company generated record revenues and earnings—the strongest AAON has seen in its 25-year history.
Third-quarter sales were $89.7 million, representing a gain of 17% over the third quarter of 2012. Earnings came to $10.5 million, or $0.28 per diluted share, compared to $6.0 million, or $0.16 per diluted share, representing an impressive gain of 75% over last year’s third-quarter earnings.
While the company’s backlog declined slightly in the third quarter of 2013, management noted that an increase in its market share, rising selling prices, and lower costs for materials were all reasons for the earnings gain.
This stock has had an exceptional breakout from its long-term trend. But even before the recent positive trading action, it was still a consistent winner and a very good enterprise in terms of generating sales and earnings growth. The company’s stock chart is featured below:

Chart courtesy of http://stockcharts.com/
Arguably, investing in the HVAC industry is a long-haul proposition, as AAON’s share price performance in the above chart illustrates. But consistent stock market winners, as far as I’m concerned, are absolutely golden, especially given the inherent volatility with equity securities and the business cycle.
Stocks that trade sideways when the broader market is trending lower are often good indicators of the types of businesses that will hold up well over time.
When we looked at AAON in June of last year (see “How the Old Economy Can Pay More Than You Might Think”), the company reported record 2013 first-quarter results. Sales grew three percent to $66.8 million, while earnings grew 56% to $7.1 million, or $0.29 per diluted share.
With so much media emphasis on technology and those companies generating the fastest growth, great old economy enterprises like this company are easily overlooked, which is a mistake, because AAON is a very good business.
The company might be too small for a Berkshire Hathaway, Inc. (BRK-B) acquisition, but I wouldn’t be surprised at all if a larger corporation decides someday that it wants to add this little business to its portfolio.
With its recent breakout, this stock has been well bid and is fully priced like most other equities. But AAON serves as a great example of an enterprise that’s done a very good job of managing a cyclical business with the purpose of delivering consistent growth to shareholders.
There aren’t a lot of businesses out there that are able to deliver consistent results, even if the growth is only modest. A company like AAON is a model for other public companies, because management wants deliberate growth, not grandiose outperformance. It’s also a model of a great stock market investment. It should be a case study in business schools.
This article Why This Company Should Be a Case Study in Business Schools was originally published at Profit Confidential