By CentralBankNews.info
Moldova’s central bank maintained its base rate at 3.5 percent, along with its rates on overnight loans and deposits, saying monetary policy continues to be determined by the complex balance of risks from inflationary and disinflationary forces.
The National Bank of Moldova, which last cut its rate by 100 basis points in April 2013, said inflation eased to 5.1 percent in January from 5.2 percent in December due to lower regulated prices, a lack of aggregate demand and inflationary pressures despite the depreciation of the Moldavian leu against major trading partners.
The central bank targets inflation of 5.0 percent, plus/minus 1.5 percentage point. The leu depreciated by 10.6 percent against the euro in 2013 and has continued to drop this year, down 4 percent so far in 2014, trading at 18.62 to the euro today.
The central bank also said data for trade and industrial production showed significant growth in the fourth quarter of 2013, with exports and imports up by 11.0 percent and 5.4 percent, respectively, while industrial production was up by 6.8 percent. In terms of consumer demand, annual real wage growth in the fourth quarter was 3.6 percent while cash remittances rose by an annual 6.2 percent.
EURUSD: Weakens, Eyes Further Downside.
EURUSD: While EUR maintains an immediate downside pressure, its broader medium term upside bias remains intact. However, the pair should face further weakness before eventually putting in a bottom. Support comes in at the 1.3600 level , its psycho level with a breach of here paving the way for a run to the downside towards the 1.3561 level, its Feb 12 2014 level. Its daily RSI is bearish and pointing lower supporting this view. On the other hand, EUR will have to retake the 1.3695 level to halt its present decline. This if seen could force further upside towards the 1.3772 level. Above here will turn attention to the 1.3800 level, its psycho level. Further out, resistance is located at the 1.3893 level, its Dec 27 2013 high. A turn above here will expose the 1.3950 level and next the 1.4000 level. All in all, EUR remains biased to the downside on pullbacks.
Article by www.fxtechstrategy.com
Euro Trades Lower on Spain GDP
The 18-nation euro was seen dropping as the Spanish economy weakened in the last quarter of 2013, reports from the National Institute of Statistics confirmed.
The euro declined by 0.23% at $1.3653, while Spain’s gross domestic product (GDP) report, lost approximately 30 pips.
The euro traded flat at £0.8207 against the British Pound, while against the Japanese yen, the euro eased 0.28% to ¥139.63.
Euro – Spain GDP
The Spanish economy expanded by 0.2% in the last quarter of 2013, compared to the rise of 0.5% seen in the previous three months and meeting in line with analysts’ forecasts, reports from the National Institute of Statistics confirmed on Thursday.
Spain’s gross domestic product (GDP) remained weak at an annual basis, dropping 0.2% in the fourth quarter.
However, the European Commission forecasted the Spanish economy would expand by 0.5% this year, while Spain’s Prime Minister Rajoy said the country’s economy is expected to rise more than the official estimates for this year.
Germany’s Data
Meanwhile in Germany, the country’s labour figures outpaced analysts forecasts as the number of unemployed in Germany dropped by 14,000 on a seasonally adjusted basis, reports from Destatis confirmed. Germany’s unemployment rate came in unchanged at 6.8%.
Additional releases such as Germany’s inflation data are due later, which analysts are expecting to see a quickened pace of 0.6% month-on-month, compared to the slowdown seen in January.
“German CPI print will provide an indication of what to expect for tomorrow’s euro zone aggregate print. A weak inflation number today will no doubt raise market concerns of potential ECB action next week,” Lloyds Bank wrote in its research note.
Yellen Testimony in Focus
Meanwhile traders are focusing on the new Federal Reserve (Fed) Chair Janet Yellen to deliver her testimony on monetary policy before the Senate Banking Committee as part of the Fed’s semi-annual policy report known as Humphrey Hawkins. The testimony is due later in the day.
The US Federal Reserve reduced its monthly bond purchases by $10 billion at each of its two meetings, leaving its monthly stimulus at $65 billion. The yellow metal surged 70% from December 2008 to June 2011 as the central bank added over $4 trillion into the financial system to boost growth.
Visit www.hymarkets.com to find out more about our products and start trading today with only $50 using the latest trading technology today
The post Euro Trades Lower on Spain GDP appeared first on | HY Markets Official blog.
Article provided by HY Markets Forex Blog
Gold Prices Trades Flat on US Home Sales
Gold futures were seen trading nearly flat on Thursday, dropping from a four-month high seen in the previous session as sales in new homes in the US climbs to a five-year high and market participants focus on the Federal Reserve (Fed) Chair Janet Yellen upcoming testimony later in the day.
Gold futures for April delivery climbed 0.05% higher to $1,328.60 an ounce at the time of writing on the Comex, while silver futures slid 0.78% to $21.090 an ounce at the same time.
The US dollar index, which measures the strength of the greenback against a basket of six of its major peers, dropped 0.05%lower to 80.392.
Holdings in the world’s biggest gold-backed exchange-traded fund, SPDR Gold Trust, came at 803.7 tones on Wednesday. Market analysts’ are forecasting SPDR Gold Trust to record its first monthly rise since December 2012.
Gold is climbing for the second month in a row in February, the longest rising-streak since August.
Gold – Yellen Testimony in Focus
Meanwhile traders are focusing on the new Federal Reserve (Fed) Chair Janet Yellen to deliver her testimony on monetary policy before the Senate Banking Committee as part of the Fed’s semi-annual policy report known as Humphrey Hawkins. The testimony is due later in the day.
The US Federal Reserve reduced its monthly bond purchases by $10 billion at each of its two meetings, leaving its monthly stimulus at $65 billion. The yellow metal surged 70% from December 2008 to June 2011 as the central bank added over $4 trillion into the financial system to boost growth.
US Home Sales
Meanwhile new home sales in the US climbed to its highest in five years boosting optimism in the economy.
Sales of new homes came in at 9.6% to 468,000 units in January, climbing to the highest level since June 2008 and compared to forecasts of a 3.4% drop to 400,000 units, reports from the Department of Commerce confirmed on Wednesday.
Visit www.hymarkets.com to find out more about our products and start trading today with only $50 using the latest trading technology today
The post Gold Prices Trades Flat on US Home Sales appeared first on | HY Markets Official blog.
Article provided by HY Markets Forex Blog
Fibonacci Retracements Analysis 27.02.2014 (EUR/USD, USD/CHF)
Article By RoboForex.com
Analysis for February 27th, 2014
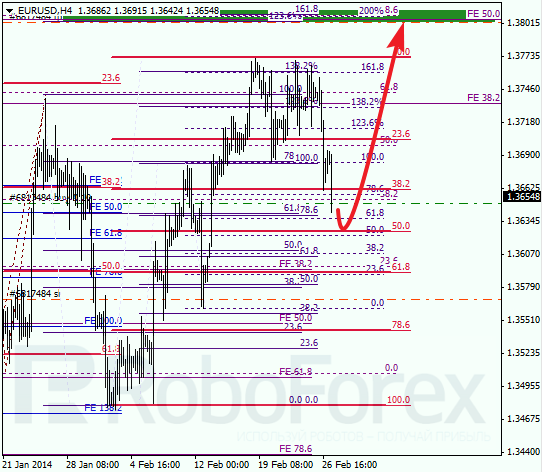
EUR USD, “Euro vs US Dollar”
Current correction turns out to be deeper that we expected. Possibly, later price may rebound from local level of 50%. If it happens, pair will start new ascending movement towards upper fibo-levels.
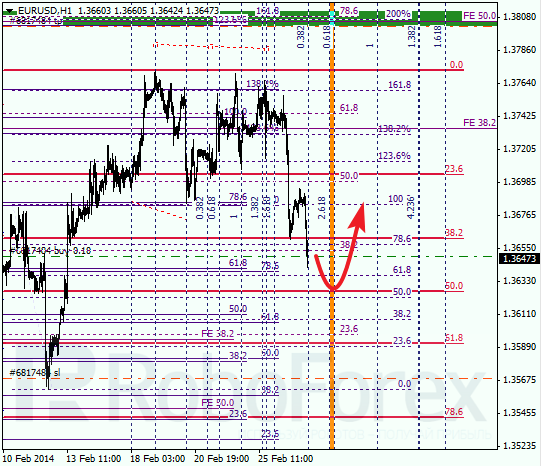
As we can see at H1 chart, price rebounded from one of intermediate levels and stated new correction. According to analysis of temporary fibo-zones, level of 50% may be reached during the day. If later price rebounds from it, I’ll increase my long position.
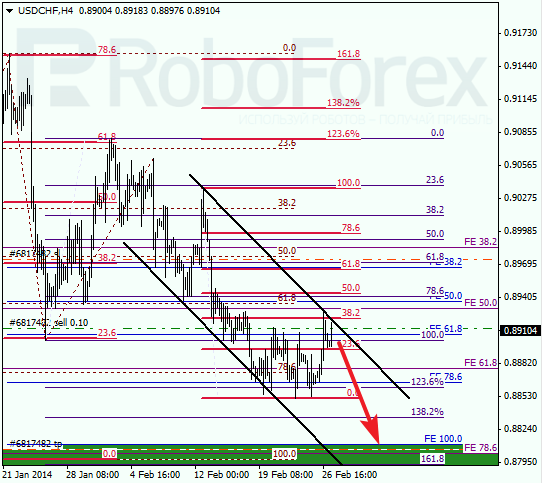
USD CHF, “US Dollar vs Swiss Franc”
Franc rebounded from local level of 38.2%; right now, price is trying to rebound from upper border of descending channel. I’ll move stop on my sell order into the black as soon as market starts falling down.
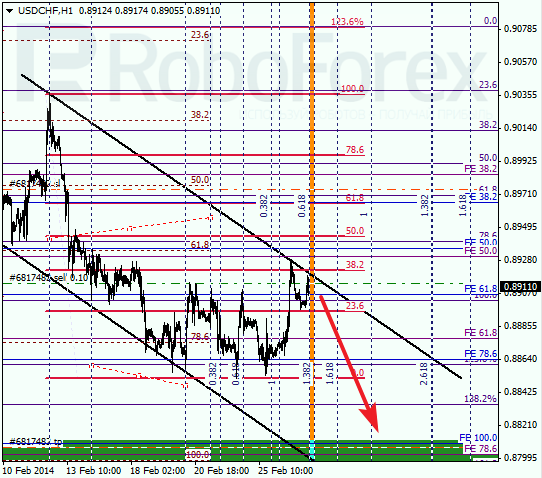
At H1 chart, price is getting closer to temporary fibo-zone. Possibly, pair may start new descending movement quite soon and break previous minimum by Friday.
RoboForex Analytical Department
Article By RoboForex.com
Attention!
Forecasts presented in this section only reflect the author’s private opinion and should not be considered as guidance for trading. RoboForex LP bears no responsibility for trading results based on trading recommendations described in these analytical reviews.
Wave Analysis 27.02.2014 (DJIA Index, Crude Oil)
Article By RoboForex.com
Analysis for February 27th, 2014
DJIA Index
Index is still consolidating. Probably, price has already completed wave [2] and right now is staring moving upwards inside the third one. I’m planning to move stop into the black right after instrument breaks local maximum.
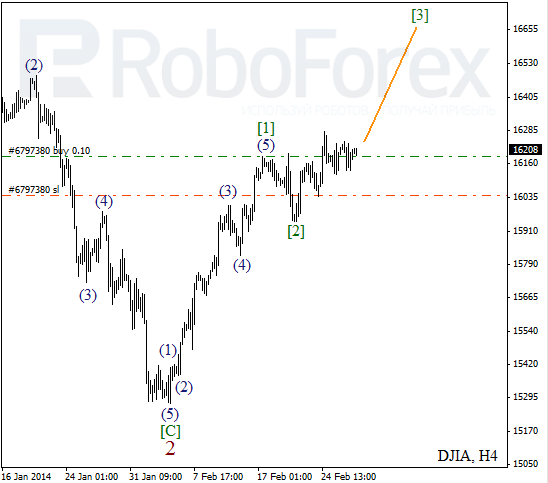
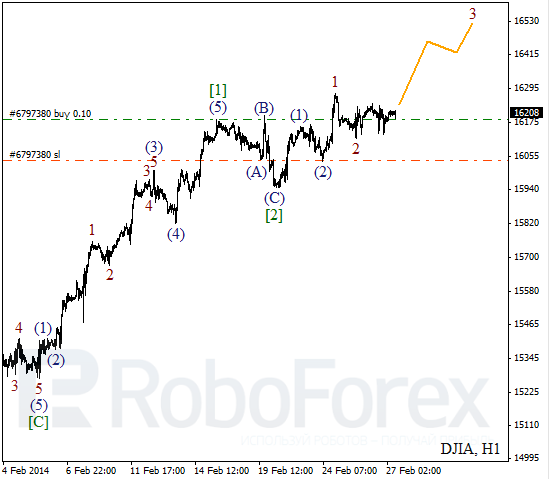
As we can see at the H1 chart, Index formed several initial ascending waves. Possibly, price is starting to form extension inside the third wave. Most likely, instrument will start moving upwards during the day.
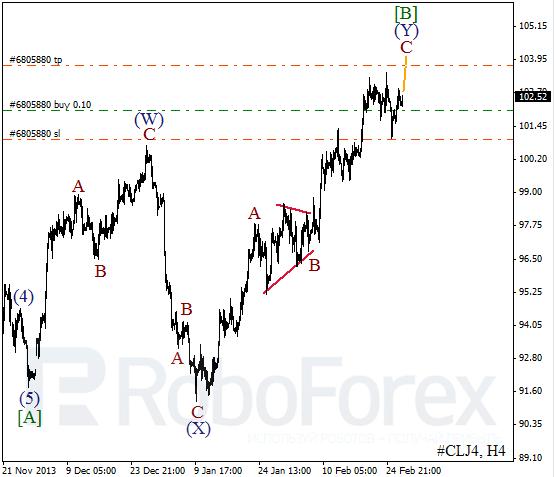
Crude Oil
Oil is still forming bullish impulse inside wave C. On major wave level, price is forming double zigzag pattern inside wave [B]. It looks like instrument is going to reach level of $104 per barrel of Light Sweet until the end of this week.
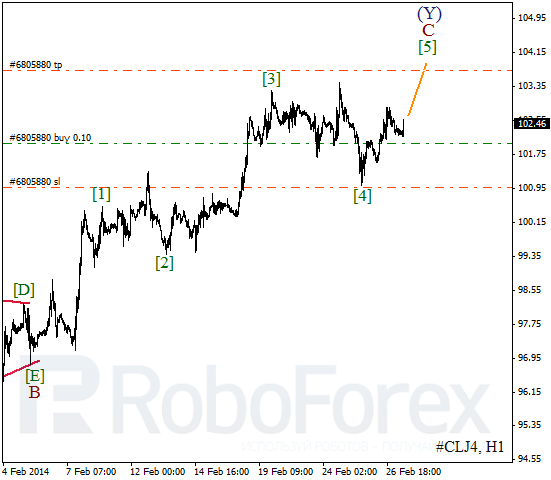
More detailed wave structure is shown on H1 chart. Oil completed the fourth wave inside wave C and started moving upwards the fifth one. I’ll move stop into the black right after instrument breaks maximum.
RoboForex Analytical Department
Article By RoboForex.com
Attention!
Forecasts presented in this section only reflect the author’s private opinion and should not be considered as guidance for trading. RoboForex LP bears no responsibility for trading results based on trading recommendations described in these analytical reviews.
AUDUSD is facing 0.8906 support
AUDUSD is facing 0.8906 support, a breakdown this level will signal completion of the uptrend from 0.8660, then next target would be at 0.8780 area. On the upside, as long as 0.8906 support holds, the price action in the trading range between 0.8906 and 0.9080 would possibly be consolidation of the uptrend from 0.8660, one more rise to 0.9400 area to complete the upward movement is still possible.

Provided by ForexCycle.com
Understanding Spot Gold Trading
 Those who trade the Forex market understand that global events can greatly influence how the Forex market moves. When there is turmoil in the world there is usually a flight to buy gold. For many it is not always practical to be holding gold bars and having to exchange the gold bars as the value of gold fluctuates. An alternative to this is trading spot gold.
Spot gold is not unlike many of the currency pairs that you may be familiar with. It is usually quoted against the US dollar and the symbol is XAU. The contract size for spot gold is 100 oz.
The PIP size for spot gold trading is 0.10. The PIP value for one lot would equal $10.
As with Forex the spot gold broker should offer streaming prices from banks with deep liquidity.
As always it is important to select a Forex broker that is in a regulated jurisdiction. Spot Gold trading offers many trading opportunities when there is turmoil and the markets become volatile.
Traders can also use instruments like binary options and CFDs on the spot gold market.
To learn more please visit www.clmforex.com
Disclaimer: Trading of foreign exchange contracts, contracts for difference, derivatives and other investment products which are leveraged, can carry a high level of risk. These products may not be suitable for all investors. It is possible to lose more than your initial investment. All funds committed should be risk capital. Past performance is not necessarily indicative of future results. A Product Disclosure Statement (PDS) is available from the company website. Please read and consider the PDS before making any decision to trade Core Liquidity Markets’ products. The risks must be understood prior to trading. Core Liquidity Markets refers to Core Liquidity Markets Pty Ltd. Core Liquidity Markets is an Australian company which is registered with ASIC, ACN 164 994 049. Core Liquidity Markets is an authorized representative of Direct FX Trading Pty Ltd (AFSL) Number 305539, which is the authorizing Licensee and Principal.
Investors Can Learn a Lot from this Famous 1951 Experiment
In 1951 Solomon Asch, of Swarthmore College in the US, conducted one of the most famous conformity tests.
The set-up was simple.
The experiment involved eight people sitting in a room. Seven of the participants were ‘insiders’. They knew the real purpose of the experiment. They had instructions to obey the commands of Asch and his team.
The eighth participant was the ‘guinea pig’. He or she was an outsider. They had no idea about the real purpose of the experiment.
The dangerous power of conformity
The experiment involved showing the participants the two following cards:
They had to answer which of the lines on the right hand card matched the line on the left hand card. Simple, right?
It should be. But here was the trick. The researchers instructed the seven ‘insiders’ to answer incorrectly, but they would all have to answer the same way – for instance they would all say that A was the matching line.
Now, A is clearly the wrong answer. But the set-up meant that the ‘guinea pig’ was always the last to answer. The objective of the test was to see whether they would give the correct answer (C), or whether they would follow the crowd and give the incorrect answer (A).
The results were stunning.
For all experimental groups, three-quarters of the participants gave at least one wrong answer, even though the correct answer was obvious.
Even more amazingly, in interviews conducted after the tests, most of the ‘guinea pig’ participants reported a distortion of judgement. That means even though the correct answer was obvious, the participants began to believe they must be wrong because the rest of the group gave an alternate answer.
It just goes to show how keen most people are to conform, and the pressure people feel. Even though something was obvious, they went against their better judgement because they didn’t think it was possible everyone else could be wrong.
In a lab test, there’s no harm done. But as an investor, if you take the same approach it could be disastrous.
The importance of not following the investment crowd
We covered this to some degree in yesterday’s Money Morning. This is the type of investor who is only too eager to follow the crowd.
They know that things don’t quite add up, but heck, everyone else is buying, so why shouldn’t they join in the fun…and the profits?
But following the crowd can be a dangerous way to invest if you don’t understand the risks involved.
That’s why long ago we introduced ‘buy up to’ prices in our paid investment advisories.
It’s a simple concept. When we publish investment research to buy a stock, we always include a maximum ‘buy up to’ price. For instance, if a stock is trading at $1 and our analysis suggests the price could go to $3, we may set a maximum buy up to price of $1.20.
The reason for this is simple (and yet few investors realise it). The more you pay for a stock, the lower your potential profits.
If you pay $1 for a stock that goes to $3 then you’ve made a 200% profit. If you pay $1.20 and it goes to $3 then you’ve made a 150% profit.
But if you chase the stock and pay $1.60 and it goes to $3 then you’ve ‘only’ made an 87.5% profit.
That may still seem pretty good. But remember, stocks don’t always behave how you expect. Sometimes they go down. So if you rush in to buy at $1.60 there’s no guarantee the price will keep going up.
But if you’re the type of investor who follows the crowd just because you believe the crowd is always right, then you’ll consistently find that you’re paying more than you should for stocks.
It also means you’ll find that you rarely lock away any profits.
Resist the pressure of the investment crowd
But that’s what most investors do.
It’s why most investors tend to buy stock when prices are already going up. It’s the urge to conform…to follow the crowd.
You won’t find many investors who will buy a stock when it’s bumping along the bottom of the market. Doing that involves taking initiative and going against the grain.
You may have experienced the pressure to conform when you’re chatting to friends or family about stocks. If you bring up the idea of buying shares, they’ll probably say you’re mad.
If it’s just one person telling you that it’s easy to fight your corner. But if there are three, four or five people telling you that buying stocks is a bad idea, you’re more likely to go along with it. After all, they couldn’t all be wrong, could they? Refer back to the Asch test.
But that’s all part of being a contrarian investor. Being a contrarian investor means having the smarts to identify new trends before everyone else.
So rather than seeing your minority position as a negative, see it as a positive. If everyone is telling you that it’s a bad time to invest in stocks, there’s a good chance you may be on to something.
Right now, we’re hearing that message non-stop from almost everyone we speak to. We see that as a good sign. Remember, just because there are more people saying it, doesn’t mean they’re right.
Cheers,
Kris+
PS: You can quiz me on my bullish stock market views in person at the upcoming World War D conference in Melbourne at the end of next month. I’ll be on the stage with global finance gurus Dr Marc Faber, Jim Rickards, and Satyajit Das. You can find out more here about what I consider to be the best money and finance conference in Australia this year. Click here for the revealing trailer…
From the Port Phillip Publishing Library
Special Report: Retirement Security Ladder
Emerging Markets May Have Further to Fall — but It’s Time to Start Buying
Investors are currently getting a nasty reminder that ‘emerging’ and ‘frontier’ markets have a risky reputation for a reason.
Nigeria has just suspended its popular, reformist central bank boss. It seems he’s been a little bit too candid about corruption in the country’s all-important oil industry. The move shocked investors, who saw him as a safe pair of hands and a source of credibility for the country.
Ukraine meanwhile is dangerously close to civil war. Turkey continues to suffer from political upheaval.
Elsewhere, currencies have slid, politics are being scrutinised more closely, and investors have generally decided they’d rather keep their money at home.
Of course, when everyone else decides they hate a market, that’s when contrarian investors prick up their ears.
So is this a buying opportunity?
There’s no reward for being a contrarian fund manager
I’ve never met a fund manager who wasn’t a contrarian.
Regardless of what their top ten holdings are, they all like to paint themselves as having a touch of the maverick — not afraid to go against the grain, and make bold calls in the face of opposition and even ridicule from their more timid peers.
Yet, for an industry stuffed full of radical free-thinkers, they all seem to jump on the same trades with remarkable consistency. Funny that.
The reality, of course, is that very few managers genuinely want to stand out from the crowd. It’s called ‘career risk’. Managers who make truly bold calls, and get it wrong, will rapidly lose clients and then their jobs, in that order.
Even a decent — or even stellar — track record doesn’t help much. It doesn’t take a long period of underperformance before you start seeing carping headlines about once-respected managers being behind the times, or overly wedded to a style or viewpoint.
So there’s really not a lot of benefit to sticking your neck out in the money management business.
That’s why I like to watch what fund managers as a group are thinking. Very few of them want to stand out from their peers. So when you start to see them all crowding one way or another, it’s often a good indication that you should be thinking about going in the opposite direction.
Take a look at the latest Merrill Lynch Bank of America fund manager survey. According to this, global fund managers are gloomier about emerging markets than they’ve ever been. Meanwhile, a record percentage are bullish on Europe for the year ahead.
This is classic. Much as I like eurozone stocks, some of the peripheral markets have practically doubled in the last 18 months. But it’s only now that everyone is turning bullish on them.
Meanwhile, on the emerging-market front, the MSCI Emerging Markets index hasn’t been this cheap compared to developed markets since October 2008. But no one’s interested.
One of the basic rules of investing is ‘buy low, sell high’. Yet even the professionals seem to have difficulty abiding by this one.
This is probably the biggest advantage that we have as private investors over the experts. No one but you scrutinises your investment performance. So if you see an investment opportunity — even if you’re a little early in the day — you can take it, and wait for it to pay off.
Emerging markets might fall further — but they’re already cheap
This point about timing is relevant. Despite the poor sentiment towards them, I’m not convinced this is the bottom for emerging markets.
I’m basing that on little more than gut feeling — it doesn’t quite ‘feel’ as if they’re hated enough, or that the news flow has been quite hyperbolic enough. I haven’t yet read any articles that say, ‘That’s it — these things are never going up again’.
But the point is, you don’t have to get the timing exactly right. As long as the markets are cheap enough, then in the long run, they’re likely to bounce back. Assuming you’re not retiring imminently, you can start drip-feeding money in (if you haven’t already) and be patient.
John Stepek,
Contributing Editor, Money Morning
Ed note: The above article was originally published in MoneyWeek.