Article by Investazor.com
The Japanese yen was in total control last week having been 5 days out of 5 in the positive territory in front of the US dollar. This is largely due to the escalation of the geopolitical conflict from Ukraine and the “Cold War” between Russia and the United States. The latter even threatened that will impose new sanctions to Russia if it continues its aggressive foreign policy regarding Ukraine.
Other than that, last week was kind of poor regarding the macro publications while investors were recovering after the holydays. The economic data from Japan were quite ugly. The week started with a trade deficit balance of -1.71T, much worse than the expectations and closed on the same negative tone with the indicator of All Industries Activity at -1.1%, again worse than the analysts’ estimates. On the American soil, the publications were mixed, but the end of the week brought hope after the consumer sentiment was published above expectations.
Economic Calendar
Retail Sales y/y (0:50 GMT)-Monday. This indicator is the primary gauge of consumer spending, which accounts for the majority of overall economic activity. It measures the change in the total value of sales at the retail level and it is considered has a medium impact on the markets. This month it is expected to be around 10.9%.
Bank Holiday-Tuesday. Japanese banks will be closed in observance of Showa Day.
Preliminary Industrial Production m/m (0:50 GMT)-Wednesday. It represents a medium impact that measures the change in the total inflation-adjusted value of output produced by manufacturers, mines and utilities. There are two versions of this indicator released about 15 days apart, the preliminary is the earliest and thus tends to have the most impact. This month it expected to be 0.6% after last month was -2.3%.
Monetary Policy Statement & BoJ Press Conference (Tentative)- Wednesday. These two monthly events have a high impact on the markets because it is among the primary tools the BoJ uses to communicate with investors about monetary policy and the Press Conference always brings some serious volatility. It is written Tentative because it was not established yet the exact hour, which will be communicated Tuesday.
Household Spending y/y (0:50 GMT)-Friday. This indicator measures the change in the inflation-adjusted value of all expenditures by consumers and it has a medium impact as the consumer spending accounts for a majority of overall economic activity. It will be interesting to see the publication as last month was -2.5% and this time it is expected to be around 1.7%.
Technical View
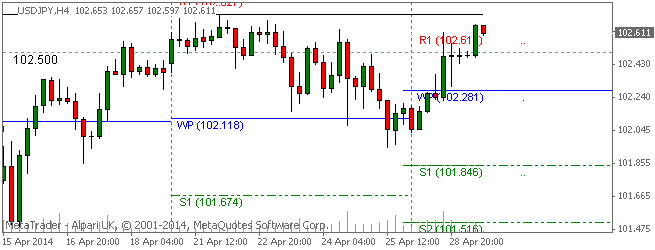
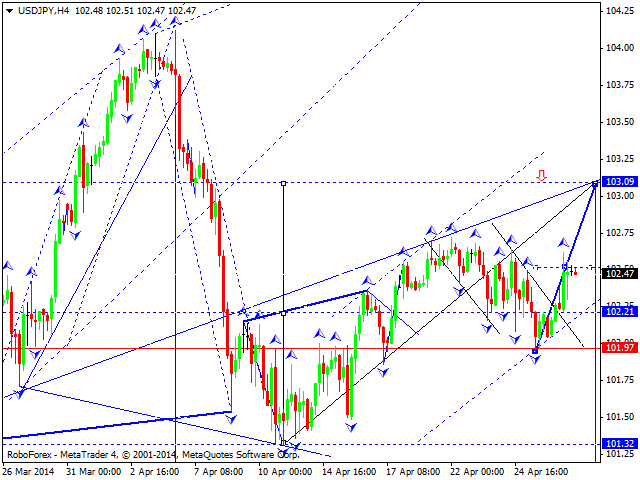
USDJPY, Daily
Support: 101.20, 100.00
Resistance: 103.00, 104.20

As time passes by, on the USDJPY daily chart we can see a triangle determined by higher lows and lower highs. Triangle patterns are usually continuation ones, so if the price motion remains in the same range, we could see an upside breakout. Regarding last week, USDJPY plunged and found support at 102.00. The MACD Histogram shows us a period of calm that could turn into a bullish movement, so we could see how the price will test the resistance level from 103.00.
USDJPY, H1
Support: 101.95, 101.60
Resistance: 102.60, 103.00

On the hourly chart the quotation is taking the shape of a mega phone, which is characteristic to broadening wedge patterns. If the pattern will be validated this means we should expect to a breakout of the resistance level from 102.60. A close on H1 above the level before mentioned could be the positive impulse the bullish investors are looking for in order to push the price upwards to 103.00 level.
Bullish or Bearish
Overall, this week I see a recovery of the US dollar. How strong that recovery will be? This aspect depends a lot on the situation from Ukraine. If the United States will impose new sanctions to Russia, we can see USDJPY below 102.00 whereas a de-escalation of the conflict could get quotation around 103.00 level.
The post USD/JPY Forecast For April 28 – 2 May appeared first on investazor.com.