GOLD Elliott Wave Forecast: Are Bears Coming Back?

GOLD is reversing lower from 1360 where a five wave move from 1251 may have completed a flat correction in wave 2. Notice that current weakness already extended through the small base channel which usually occurs in impulsive price action. With that said, further weakness is expected as we think that price is in red wave i), so if we are correct then short opportunity could occur in wave ii) maybe next week.

Gold Elliott Wave


Get 2 Month Package For Price Of 1 Month.

2 For 1


Well on the daily line chart of gold we see a possible Head and Shoulder pattern with price now moving down from the right shoulder. This is a bearish pattern that is pointing towards 1180, but not so soon. Firstly we need a broken neckline placed around 1271.

Gold HNS Pattern

Free Elliott Wave Webinar >>> http://goo.gl/kw2wUh


How to Profit from a Potential Housing Market Downdraft

by George Leong, B.Comm.

The housing market has had a nice run up over the past several years, but the party is beginning to fade.

Home prices continue to edge higher with a 12.8% jump in August, according to the S&P/Case-Shiller 20-City Home Price Index. While this seems positive, you also have to wonder if the housing market is headed for a bubble down the road as mortgage rates rise—and they will.

The chart of the S&P/Case-Shiller 20-City Home Price Index below shows the currency recovery in home prices. The index is still far below the peak in 2006 and 2007, prior to the subprime blow-up. These were unrealistic levels. We saw downward moves in 2009 and 2012, but it has been clear sailing. Yet the problem is that much of the buying in the housing market was driven by institutional buying. Once this begins to fade as home prices rise, we could see a relapse in the housing market.

            Chart courtesy of www.StockCharts.com


We saw a 5.6% decline in pending home sales in September. This metric is not considered as critical as the housing starts and building permits readings, but in my view, it’s a good indicator. In August, pending home sales slid 1.6%. We may be seeing a trend of lower demand for homes, which suggests there could be some issues on the horizon if pending home sales continue to be negative.

Existing home sales were also flat at 5.29 million units in September, down from 5.39 million units in August. Less people are buying homes, and this cannot be good for the homebuilder stocks.

What makes the situation in the housing market worse is that we are failing to see strong job creation. Without confidence and jobs, there will continue to be a tendency among consumers to not want to commit to a major purchase, such as a house.

I would be avoiding the homebuilder stocks at this time. The S&P Homebuilders Index is looking vulnerable, as shown in the chart below, based on my technical analysis.

            Chart courtesy of www.StockCharts.com


What I continue to like is the home building supplies companies. At the top is The Home Depot, Inc. (NYSE/HD), which is the “Best of Breed” in this sector in my opinion.

In the small-cap area, take a look at the suppliers to the housing market. Beacon Roofing Supply, Inc. (NASDAQ/BECN) is a stock that you should keep an eye on. The company supplies builders and roofing companies with roofing supplies.

This article How to Profit from a Potential Housing Market Downdraft was originally published at Investment Contrarians


BlackRock CEO Reports QE Causing Bubbles in Markets

011113_IC_cekerevacby Sasha Cekerevac, BA

As most readers know, I have been calling for a reduction in the Federal Reserve’s quantitative easing (QE) program for some time. My worry has been that the current level of quantitative easing is not doing much to help Main Street, and it is building potentially dangerous risks to our economy over the long term.

I’m worried about the future of this country, and yes, even my investments. I don’t want my hard-earned wealth to disappear due to mistakes made by the Federal Reserve in continuing to pump quantitative easing.

And I’m obviously not alone in this sentiment, as recently the CEO of BlackRock, Inc. (NYSE/BLK), Laurence Fink, stated that the Federal Reserve’s current quantitative easing policy is creating bubbles in various markets. (Source: Bloomberg, October 29, 2013.)

Fink’s opinion that the Federal Reserve should begin tapering quantitative easing immediately comes from the long-term viewpoint of the overall economy and the damage that is being done. Even though money managers like Fink might benefit from quantitative easing over the short term from the boost in asset prices, if bubbles get bigger, the damage over the long term could be extremely serious.

This has been my viewpoint for some time. Sure, it’s great that the market has gone up recently, but if it’s not sustainable, what’s the point?

Much like real estate a decade ago, we all enjoyed the party on the way up, but the hangover has taken years to work off.

Because the Federal Reserve has been so aggressive in its quantitative easing policy, it’s not just the stock market that is going up. Investors who are desperate for yields are piling into even the riskiest of assets, just to try and get some income.

This is where things can get dangerous. It goes beyond just one investor losing their hard-earned wealth. What about pension plans that are now placing your funds into junk bonds for just marginal yields?

The long-term implications of such an aggressive quantitative easing program by the Federal Reserve are unknown, as the central bank has never made such drastic moves in its history. We are in uncharted waters, and that’s a dangerous place to be.

Ultimately, reality will set in whether the Federal Reserve likes it or not. In fact, the Federal Reserve might lose the ability to impact the long-term bond market if foreign investors decide to pull out.

This means that even if the Federal Reserve continued pumping quantitative easing into the U.S. economy and short-term interest rates remained low, if investors in long-term bonds decide to sell, long-term interest rates will rise.

As well as increased interest rates, all of this excess quantitative easing could eventually lead to inflation moving significantly higher. This, too, would result in ever-higher long-term interest rates.

The fact of the matter is that no one knows what will happen, since the Federal Reserve has never taken such unorthodox action.

I think that over the next few years, we will see higher interest rates. One way investors can profit from a drop in bond prices (when bonds drop in price, interest rates move up) is through an inverse exchange-traded fund, such as ProShare Ultrashort 20+ Year Treasury (NYSEArca/TBT).

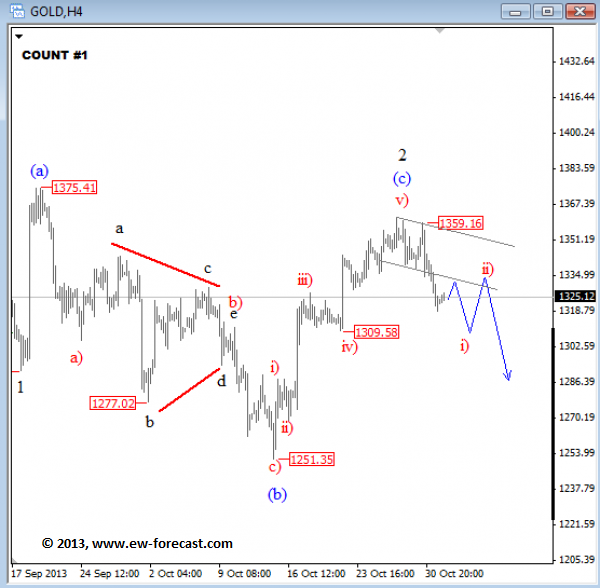
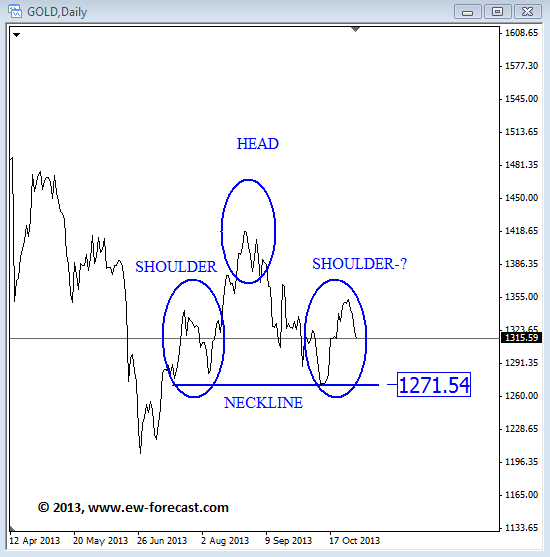
Of course, another approach is to diversify your investments by including such assets as gold or silver, which obviously can’t be printed at will. Regardless of what foreign investors do with our bonds, we know they can’t get enough gold and silver.

This article BlackRock CEO Reports QE Causing Bubbles in Markets was originally published at Investment Contrarians


Why Consumer Confidence is Falling at an Alarming Rate

by Mohammad Zulfiqar, BA

Consumer spending is very critical to the U.S. economy, as it makes up a significant portion of the gross domestic product (GDP). If consumer spending declines, then U.S. GDP growth becomes very questionable; when it increases, it can provide an idea about where the U.S. economy is heading.

I look at consumer confidence as one of the indicators of consumer spending. The logic behind this is that if consumers are confident, they will most likely spend more, compared to when they are pessimistic.

Sadly, the consumer confidence in the U.S. economy seems to be deteriorating these days. This is definitely not a good sign if we want the U.S. economy to improve going forward.

Look at the Conference Board Consumer Confidence Index, for example; in October, it witnessed a slide of more than 11%, having stood at 71.2 in October from 80.2 in September. The Consumer Expectations Index declined 15.5% in the same period. (Source: “Consumer Confidence Decreases Sharply in October,” The Conference Board web site, October 29, 2013.)

Some will blame the decline in consumer confidence on the U.S. government shutdown. This may not be completely true, however, as we have been seeing continuous deterioration in consumer confidence. Please look at the chart of the University of Michigan Consumer Sentiment Index below.

            Chart courtesy of www.StockCharts.com


The University of Michigan Consumer Sentiment Index stands at the lowest level of 2013 in October. It has been declining since July.

Currently, we are seeing too much attention being paid to the key stock indices making new highs each day, but not to the underlying factors that affect them.

Consumer confidence declining suggests that consumer spending going forward is going to be bleak. We are already seeing some effects of this; for example, companies on key stock indices are showing their sales below expectation.

Consider this: as of October 25, 244 companies on the S&P 500 have reported their third-quarter corporate earnings, and only a little more than half of them were able to beat the estimated revenues. (Source: “Apple continues to be largest drag on S&P 500 technology sector earnings growth,” FactSet web site, October 25, 2013.)

If this trend continues, which I think it will, then it can do a significant amount of damage. For example, if consumer confidence plummeting results in decreasing consumer spending, the retailers will face troubles. And if those retailers are not able to sell product, they will have to reduce staff to stay profitable, and so on.

But that’s not all: consumer spending declining could affect the GDP. The growth rate estimates we hear now may not be the same a few months down the road.

Investors have to be really cautious about what kind of investments they make. If their portfolio consists of companies in the consumer discretionary sector, they should consider taking some profits off the table or reducing their exposure to the sector.

This article Why Consumer Confidence is Falling at an Alarming Rate was originally published at Daily Gains Letter


European Stock Futures Open Slightly Changed

By HY Markets Forex Blog

European stock futures traded little changed on Friday as China’s manufacturing sector improved further in October.

Futures for the pan-European Euro Stoxx 50 edged 0.06% lower at 3,063.30, while the German DAX index declined 0.04% lower to 9,032.00.

At the same time the French CAC 40 climbed 0.06% higher at 4,302.30 while the UK FTSE 100 gained 0.37% at 6,756.30.

Markit Economics are expected to report the UK Purchasing Managers’ Index (PMI) at 9:30am GMT, with forecasts of a drop from previous recorded reading of 56.7 in September to 56.4 in October.

European Stock Futures – China

Meanwhile, the Chinese manufacturing PMI posted a reading of 51.4 for October, compared to the previous month’s reading of 51.1 and surpassing analysts’ forecast of 51.2 in October.

A separate report revealed that HSBC’s PMI climbed 50.9 in October from the previous reading of 50.2 in September, in line the bank’s forecast of 50.9 reported last week, which was based on survey responses.

China’s economy grew by an annualized 7.6% in the third quarter, according to a data released by the government last month.

Asian Trading

Stocks in the Asian region saw a slight boost on Friday, despite the expansion in the Chinese manufacturing sector.

Japanese benchmark Nikkei 225 index lost 0.88% to 14,201.82, while Tokyo’s broader Topix gauge declined 0.94% at 1,183.03.

In China, Hong Kong’s benchmark Hang Seng index gained 0.18% to 23,247.85, while the mainland Chinese benchmark Shanghai Composite edged 0.37% higher to 2,149.56.


Interested in trading In the European Market?

Visit www.hymarkets.com and find out how you can start trading today with only $50.


The post European Stock Futures Open Slightly Changed appeared first on | HY Markets Official blog.

Article provided by HY Markets Forex Blog

Asian Stocks Mixed On Strong Chinese Manufacturing Data

By HY Markets Forex Blog

Asian stocks closed mixed on Friday as the Chinese manufacturing sector showed an improvement. The Japanese stocks dropped lower on a weak corporate data.

Asian Stocks – Japan

The Japanese benchmark Nikkei 225 index edged 0.88% lower at 4,201.57, while Tokyo’s broader gauge, the Topix index declined 0.94% to 1,183.03.Nikkei’s main market mover’s, Sony said it was struggling to maintain the sales of digital cameras and televisions in the competitive market. Sony’s stocks declined more than 11%.While Panasonic shares climbed 6% higher.

The Bank of Japan (BoJ) changed its growth forecast to 1.5% next year, higher than the previous forecast of 1.3%. BoJ also forecasted that its 2% inflation rate target would be achieved by 2015, while its current monetary easing policy remains unchanged.

Asian Stocks – China

Gains were seen in the Chinese trading session, as Hong Kong’s benchmark Hang Seng climbed 0.20% higher to 23,252.87 as of 7:04am GMT, while the mainland Shanghai Composite traded 0.37% higher to 2,149.56 after China’s National Bureau of Statistics revealed that China’s manufacturing sector expanded in October.

The Chinese government manufacturing gauge revealed that the country’s PMI came in at 51.4 in October, compared to the previous reading of 51.1 seen in September and surpassing analysts’ forecast of 51.2.

A separate report released by HSBC showed a comparable result, revealing the manufacturing edged higher at 50.9 in October, from 50.2 in September.

Qu Hongbin, Chief economist in HSBC said China is gradually recovering after the country experienced a fall in growth in the second-quarter.

The South Korean Kospi index climbed 0.46% higher to 2,039.42, after the Korea National Statistical Office confirmed the South Korean consumer price inflation dropped to a negative 0.3%.

Australia

The Australian benchmark S&P/ASX 200 index edged 0.26% lower at the closing bell at 5,411.12, after the Australian Bureau of Statistics confirmed that Australia’s producer price inflation surpassed forecasted made by analysts.


The report also revealed wholesale inflation was at 1.9% in the September quarter, compared to 1.2% seen in the previous quarter, driven by the higher utilities prices.

Australia’s manufacturing gauge showed the sector was slightly recovering and expanding for the second month in October.


Interested in trading Asian Stocks Online?

Visit www.hymarkets.com and start trading today with only $50.

The post Asian Stocks Mixed On Strong Chinese Manufacturing Data appeared first on | HY Markets Official blog.

Article provided by HY Markets Forex Blog