Source: ForexYard
The euro reversed some of its recent gains throughout yesterday’s trading session, as investors eagerly await the outcome of a European Central Bank (ECB) meeting later this week. Additionally, a report indicating an increase in Spanish unemployment weighed down on riskier assets. Today, the main piece of economic news is likely to be the US ISM Non-Manufacturing PMI, scheduled to be released at 15:00 GMT. If the indicator comes in above the forecasted 55.2, the US dollar could see bullish movement during afternoon trading.
Economic News
USD – Dollar Sees Bearish Movement in Slow News Day
The US dollar took moderate losses against several of its main currency rivals during a slow news day yesterday, as investors continued to digest Friday’s worse than expected Non-Farm Payrolls report. The GBP/USD advanced close to 50 pips during the European session, eventually reaching the 1.5750 level. Meanwhile, after advancing close to 40 pips during the first part of the day, the USD/CHF saw a bearish correction during the mid-day session, virtually erasing its earlier gains. By the end of the European session, the pair was stable at the 0.9090.
Today, dollar traders will want to pay attention to the US ISM Non-Manufacturing PMI, scheduled to be released at 15:00 GMT. Analysts expect the indicator to come in at 55.2, slightly below last month’s 56.1. A worse than expected result today is likely to reinforce the idea that the Fed will keep US interest rates at their current record lows for the foreseeable future, which would weigh down on the greenback during afternoon trading.
EUR – Spanish Unemployment Data Leads to Euro Losses
A report showing an increase in Spanish unemployment from last month resulted in the euro turning bearish during European trading yesterday. Against the US dollar, the common-currency lost close to 80 pips during the morning session, eventually reaching as low as 1.3547, before bouncing back to the 1.3570 level. Meanwhile, the EUR/GBP fell more than 60 pips over the course of mid-day trading, to trade as low as 0.8610.
For euro traders today, the main pieces of economic news are likely to be the Spanish and Italian Services PMI’s, followed by the EU Retail Sales figure at 10:00 GMT. Better than expected results for any of the indicators could help the euro recoup some of yesterday’s losses. Later in the week, traders will not want to forget to pay attention to the ECB Press Conference, scheduled for Thursday at 13:30 GMT. Any optimistic statements during the press conference regarding the EU economic recovery could boost the euro.
Gold – Gold Prices Fall amid Bearish EUR/USD
The price of gold fell more than $10 an ounce during the first part of the day yesterday, following a report showing an increase in Spanish unemployment which turned the EUR/USD bearish. A bearish euro means gold becomes more expensive for international buyers, which often leads to a drop in prices. After a reaching as low as $1661.40 during mid-day trading, a slight upward correction brought the precious metal back to $1668 by the end of the European session.
Today, gold traders will want to pay attention to the US ISM Non-Manufacturing PMI, and its impact on the EUR/USD. A better than expected figure may result in additional gains for the greenback against the euro, which if true, may lead to an additional drop in gold prices.
Crude Oil – Spanish Unemployment Data Leads to Losses for Oil
The price of crude oil fell more than $1 a barrel during European trading yesterday, following the release of the Spanish Unemployment Change figure which resulted in investors shifting their funds to safe-haven assets. After trading as low as $96.04 a barrel, the commodity was able to bounce back to the $96.50 level by the beginning of US trading.
Today, oil traders will want to pay attention to the US ISM Non-Manufacturing PMI, scheduled to be released at 15:00 GMT. If the indicator comes in above the forecasted level, speculations that US demand for oil will increase may help the commodity recoup some of yesterday’s losses.
Technical News
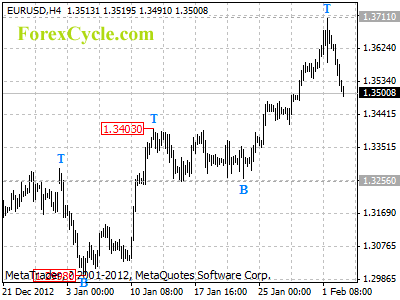
EUR/USD
The weekly chart’s Slow Stochastic is close to forming a bearish cross, indicating that a downward correction could occur in the near future. Additionally, the same chart’s Relative Strength Index has crossed into overbought territory. Opening long positions may be the smart choice for this pair.
GBP/USD
The Williams Percent Range on the weekly chart has fallen into oversold territory, indicating that an upward correction could occur in the near future. Furthermore, the MACD/OsMA on the daily chart appears close to forming a bullish cross. Traders may want to open long positions.
USD/JPY
The Relative Strength Index on the weekly chart has cross into overbought territory, indicating that a downward correction could occur in the coming days. This theory is supported by the Slow Stochastic on the same chart, which has formed a bearish cross. Opening short positions may be the smart choice for this pair.
USD/CHF
While the weekly chart’s Williams Percent Range has crossed over into oversold territory, most other long-term technical indicators place this pair in neutral territory. Traders may want to take a wait and see approach, as a clearer picture is likely to present itself in the near future.
The Wild Card
CAD/JPY
A bearish cross on the daily chart’s Slow Stochastic signals that this pair could see a downward correction in the near future. This theory is supported by the Relative Strength Index on the same chart, which is currently in overbought territory. Opening short positions may be the smart choice for forex traders today.
Forex Market Analysis provided by ForexYard.
© 2006 by FxYard Ltd
Disclaimer: Trading Foreign Exchange carries a high level of risk and may not be suitable for all investors. There is a possibility that you could sustain a loss of all of your investment and therefore you should not invest money that you cannot afford to lose. You should be aware of all the risks associated with Foreign Exchange trading.