Reverse Polarity in World Markets

By MoneyMorning.com.au

In order to talk about cycles, and how they can help your understanding of world markets, brings me to an idea I want to share with you. It’s also an idea that describes and predicts great change in the world.

The idea is that the world’s financial markets might be subject to the same kind of polarity reversal our own planet has periodically experienced. This reversal amounts to an enormous change in asset allocation models and even the way people think about risk. And according to PIMCO’s Ramin Toloui, the way to start preparing for this rebalancing of growth is to buy more government bonds in emerging markets.

A rebalancing of the world’s available pool of investable cash, based on a fundamental shift in attitudes toward risk, is basically the end of the world for the US dollar standard. PIMCO doesn’t say that. But it’s telling investors to plan for it and to profit from it.

But let me back up a second and explain what I mean about reverse polarity in scientific terms. For the planet, I’m talking about an event where the magnetic poles of the Earth reverse. North becomes South and South becomes North. It’s actually happened quite often, according to scientists And it will certainly happen again.

As you might expect, this kind of change can be pretty disruptive, especially if you’re eating your lunch at your desk on a Tuesday. It probably won’t be good for real estate values…anywhere. In fact, some scientists speculate that reverse polarity is what allowed the solar wind to blow away the atmosphere on Mars and make that planet less hospitable to life.

A Sudden Change of Direction for World Markets

I thought of reverse polarity because it’s one of the only metaphors that could describe a sudden change in the way the world’s large money managers and investors perceive risk. The current distinction is between the developing world and the developed world, between emerging markets and emerged markets, or between the US/Europe/Australia/ Japan and Brazil/China/Russia/South Africa/India/Indonesia/Korea etc.

Up until 2007, the idea is that one category of countries (the developed world) is “safe” while the other countries are “risky.” Thus, “risk on” trades saw investors buy emerging markets and commodities while “risk off” trades saw rallies in the US dollar, yen, euro (generally) and blue chip developed world stocks.

It’s a pretty simple way of thinking about the world markets and where to put your money at the right time. The only trouble is this description of the world no longer matches the world. The description needs to change. And like any change in investment markets, being ahead of it is better than getting run over by it.

Besides, after two years of constant crisis, the government bonds of developed world countries like the US, Spain, the UK, and Italy can hardly be described as “safe.” And in any event, their yields (on the shorter-term debt) are all nearing zero in nominal terms and below zero in real terms. The news about various bond auctions is a giant distraction.

Meanwhile, in the so-called developing world, government debt ratios as a percentage of GDP tend to be lower, savings rates higher, and GDP per/capita growing (rather than shrinking). Yet investments in the so-called developing world are still considered “risky” while US debt is considered “safe.”

This general attitude toward risk is subject to a pole reversal. It occurred to me that attitudes toward risk can change quickly too, with huge investment consequences. Attitudes at the margin are already changing. The fact that it’s showing up in PIMCOs advice to clients is another sign that the idea could reach a “tipping point.”

But a “tipping point” is another way of saying an event needs a catalyst to initiate what chemists would call a “phase change.” Solids don’t turn to liquids without a phase change. Liquids don’t turn into gasses without a phase change. And investors don’t suddenly change their attitude toward the world without a similar phase change.

Dan Denning

Editor, Australian Wealth Gameplan

From the Archives…

Why Graphite is the High Tech Commodity of the Future

2012-04-27 – Dr. Alex Cowie

Why Gold is Hands-Down the Best “Money” You Can Buy

2012-04-26 – Kris Sayce

12% Compulsory Super – Get Ready for the Government’s Next Tax Grab

2012-04-25 – Kris Sayce

Westfield – The Aussie Retail Stock That Could Make You Money

2012-04-24 – Shae Smith

Why Natural Gas Is Still My Favourite Resource Opportunity

2012-04-23 – Kris Sayce

For editorial enquiries and feedback, email [email protected]


Reverse Polarity in World Markets

Visa, MasterCard Still Charging Forward

By The Sizemore Letter

Credit card rivals MasterCard (NYSE:$MA) and Visa (NYSE:$V) released earnings on Wednesday, and both knocked the ball out of the park.

We’ll start with MasterCard.  This smaller of the two rivals enjoyed earnings growth of 25% in the first quarter and a 17% increase in worldwide purchase volumes.  Not to be outdone, Visa announced a 30% rise in earnings per share on an 11% rise in payments volume.

I admit, I’m a little partial to Visa.  The stock was my pick last year in InvestorPlace’s “10 Stocks for 2011” contest, and it crushed the competition.  (Alas, Turkcell (NYSE:$TKC), my pick for 2012, is off to a slower start—for now).

But as great as Visa’s performance has been over the past year and a half, MasterCard has been the better stock.

As a smaller, nimbler company, MasterCard’s growth has been more impressive than Visa’s in recent years, and MasterCard suffered less fallout from the Dodd-Frank Durbin Amendment fiasco that sought to limit the fees charged to merchants for debit cards.  Yet I contend that Visa remains the better long-term buy for reasons I’ll address shortly.  First, I’ll throw a bone to MasterCard bulls.

One of the provisions of the Durbin Amendment allowed merchants to choose the network that they used to process debit card transactions.  As the bigger of the two networks, Visa had far more to lose than MasterCard, and MasterCard has profiting handsomely at Visa’s expense.  Visa’s debit volume grew by only 2% for the quarter, while MasterCard’s grew by over 20%.  MasterCard will likely continue to nip at Visa’s heels for the foreseeable future in the U.S. debit market, which is the single most important segment of Visa’s business.

MasterCard and Visa have both benefitted from improving consumer sentiment in the United States and, outside of Europe, a healthier global economy.  But even if consumer spending growth is tepid in the years ahead, there is every reason to believe that both MasterCard and Visa can continue to see spectacular growth in purchase volumes (both credit and debit).

The world is going cashless.  Perhaps nothing illustrates this more than the various new iPhone credit-card-swiping apps.  Yes, next time you borrow $20 from your buddy, you can pay him back using nothing more than a credit or debit card and an iPhone.  Gotta love it.

Yet despite the seeming ubiquity of credit and debit cards, roughly 40% of all transactions are still carried out by cash and paper checks in the United States.  Remember, the United States is the most heavily penetrated of all major markets, so the percentage is much lower virtually everywhere else in the world.

This brings me to my primary reason for favoring Visa over MasterCard—Visa is far better positioned to profit from the rise of the emerging market consumer.

Visa already gets nearly half of its revenues from overseas, and most of this is from emerging markets. As incomes rise in the developing world, consumers have far more discretionary income than they used to, and they are spending a greater percentage of that with a swipe of plastic .

Alas, I would be remiss if I didn’t mention one big negative for Visa.  During the earnings release conference call, Visa announced that the U.S. Department of Justice was investigating the company for potential anti-trust violations related to debit card processing.  It’s too early to say how serious the investigation is or what Visa’s potential liability is, but the news sent the share price down sharply after hours.

At this stage, I do not see the investigation having a significant impact on Visa’s business, and I recommend using any weakness in the share price as an opportunity to accumulate more shares.

Disclosures: Visa is held by Sizemore Capital clients.


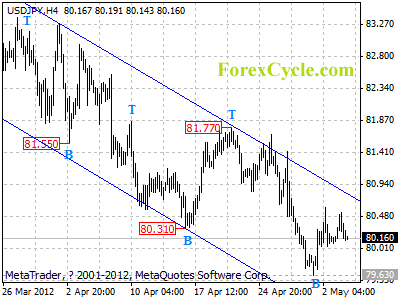
USDJPY remains in downtrend from 84.17

USDJPY remains in downtrend from 84.17, the price action from 79.63 is treated as consolidation of the downtrend. Resistance is at the upper line of the price channel on 4-hour chart, as long as the channel resistance holds, downtrend could be expected to resume, and another fall to 79.00 is still possible. On the other side, a clear break above the channel resistance will indicate that the downward movement from 84.17 has completed at 79.63 already, then the following upward movement could bring price back to 83.00 zone.

usdjpy

Daily Forex Forecast

Central Bank News Link List – 3 May 2012

By Central Bank News
Here's today's Central Bank News link list, click through if you missed the previous central bank news link list.  Remember, if you want to submit links for inclusion in the daily link list, just email them through to us or post them in the comments section below.

Next Week Forecast for Major Pairs

By TraderVox.com

Tradervox (Dublin):

EUR/USD: the pair has remained in range over the week with ADP report causing the pair to increase considerably. Next week we are expecting some good reports from Germany which might cause the pair to continue with its current bullish trend. The pair might break the 1.31 to move higher to 1.3212 resistance level during the next week.

GBP/USD: the British pound closed the week 130 pips higher, and it has maintained its strength amidst safe haven demand during the week. Investors are looking at the sterling as a better option for risk aversion than the dollar amidst mixed reports from the country. The pair opened the week above 1.60 but later dropped to mid 1.60. We expect the pair to remain at mid 1.61 during the coming week. Our outlook for the GBP/USD remains bullish.

USD/JPY: this pair has maintained its 80.0 level for most of the week. With poor data from the US, the yen might advance as more investors choose the yen over the dollar as safe haven currency. However, such advance will be mitigated by the Bank of Japan which is expected to do any possible to keep the yen weak. Over the next week, the dollar/yen pair may not see much of change. Our outlook for the pair of the next week is neutral.

USD/CHF: the pair traded at a narrow range over the past week and closed the week almost unchanged at 0.9060. The pair has been somehow quiet with only two releases. However, the coming week will be busy with three major reports from Switzerland expected to be released on May 7. Other reports from the US to be released later in the week will also affect this pair. The USD/CHF opened the week just under 0.91 at 0.9097 gaining weak resistance at 0.9204. Next week’s outlook for the pair remains neutral and we might see it remain at higher 0.90.

Disclaimer
Tradervox.com is not giving advice nor is qualified or licensed to provide financial advice. You must seek guidance from your personal advisors before acting on this information. While we try to ensure that all of the information provided on this website is kept up-to-date and accurate we accept no responsibility for any use made of the information provided. Opinions expressed at Tradervox.com are those of the individual authors and do not necessarily represent the opinion of Tradervox.com or its management. 

Article provided by TraderVox.com
Tradervox.com is a Forex News Portal that provides real-time news and analysis relating to the Currency Markets.
News and analysis are produced throughout the day by our in-house staff.
Follow us on twitter: www.twitter.com/tradervox

The Top 10 Dividend-Paying Stocks of the Last 50 Years

Article by Investment U

The Top 10 Dividend-Paying Stocks of the Last 50 Years

Today there are only 10 dividend-paying stocks that have increased their dividend payments consistently for over 50 years.

If you’re an income-seeking individual, there may be no better time than right now to pick up shares of dividend-paying stocks.

After all…

  • Most returns from U.S. Treasury bonds are in the negative when taking inflation into account.
  • Money market accounts average returns of just 0.02%.
  • And regardless of what the Fed says, there’s no magic crystal ball that can predict exactly when things will turn around.

But according to Marketwire, “In 2012, S&P 500 companies are on pace to pay out a record amount in dividends…”

What’s more, U.S. corporations are also sitting on a record amount of cash, $2 trillion total. And more and more companies are starting to use their enormous cash reserves to reward income seeking investors…

How to Earn More With “Boring” Dividends

But how do you get the most out of your dividend investments?

Senior Analyst Marc Lichtenfeld reveals one of the most important things to consider is a company’s payout ratio.

This simply measures the percentage of a company’s earnings that it paid out to shareholders as dividends. It’s important to note that Marc uses cash flow from operations rather than earnings. This is because accountants can play some pretty slick tricks with earnings figures.

Marc tells me that he tries to avoid companies with a payout ratio higher than 75%. At this point, if that firm’s cash flow takes a hit, more than likely it’ll be forced to cut its dividend.

Which brings me to another important thing to look for – reliability of a company paying and increasing its annual dividend payments.

In fact, today there are only 10 companies that have increased their dividend payments consistently for over 50 years.

CompanySymbolSinceLast Raise
3M CompanyMMM19597% (February 2012)
American States Water CompanyAWR19558% (April 2011)
Cincinnati Financial CorporationCINF1961<1% (August 2011)
Diebold IncorporatedDBD19542% (February 2012)
Dover CorporationDOV195615% (August 2011)
Emerson Electric Co.EMR195716% (November 2011)
Genuine Parts CompanyGPC195710% (February 2012)
Proctor & GamblePG19577% (April 2012)
Northwest Natural GasNWN195615% (August 2011)
Vectren Co.VVC19603% (November 2011)

[Reference: The Dynamic Dividend]

These certainly aren’t exciting companies per se – there’s no interesting stories or technological breakthroughs here. But the real thrill of investing for me isn’t what a company does, it’s how much money I make in the end.

Just take a look at Proctor & Gamble…

According to Wharton School of Business Professor Jeremy Siegel, P&G would’ve turned a $10,000 investment in 1957 into more than $4 million today. Not bad for a “boring” investment in my opinion.

What’s more, even after 55 years of consecutive dividend increases for its shareholders, P&G still expects to increase its dividend 10% per year going forward.

But you don’t even need to wait 55 years to see massive gains from reinvested dividends.

Take for instance an example Marc recently wrote about using the stock of Kimberly-Clark (NYSE: KMB).

As Marc wrote, this stock “isn’t going to get anyone’s adrenaline pumping. I mean, you can only get so excited about Huggies, Kleenex and Scott paper towels.”

But Kimberly-Clark pays a healthy 4.1% dividend yield, or $2.96 per share. If you bought $10,000 worth of stock, reinvested the dividends, and the dividend grew 9% per year like it has for the past 10 years, in 2022 your stock would yield nearly 14% on your original investment. Instead of $416 in income that you receive the first year, you’d get paid $1,388.

And if you could keep on reinvesting the dividends, the compounding machine kicks into overdrive the longer it goes. In 15 years, you’d receive $2,900 per year in dividends, or a 29% yield on your original cost. And in 20 years, $6,482 for a ridiculous 65% yield. So you’d make your original investment back every 18 months at that point.

These numbers do assume the stock price rises 5% per year, but that’s not too far-fetched considering it’s risen 9% per year over the last 10 years.

The bottom line: It really pays to have a sound dividend investment strategy. And it’s really never too late to get started. In just 10 or 15 years, you can really start to cash in.

Good Investing,

Mike Kapsch

Article by Investment U

Equities Fight to Hold Up While EU & US Data Give Mixed Signals

By Chris Vermeulen, GoldAndOilGuy.com – ETF Trading Analysis & Alerts

Investors and traders just can’t seem to catch a break when it comes to economic news. For example Tuesday in the United States we saw strong ISM manufacturing numbers which surprised the market. The numbers were way above expectations and it triggered a feeding frenzy in US based investments like stocks and the green back.

The following session Italy reported terrible PMI and unemployment rate numbers which took most of the wind out the European and US stocks. One day the data is great, next day it’s bad…

The strong numbers in the US have everyone including myself thinking that this week’s jobless claims (unemployment rate) will be down. If this is the case then we will see stocks jump along with the dollar, much like what we saw trader do last Tuesday which is what Jim Cramer says best – BUY BUY BUY.

Normally we do not see the dollar index rally along with stocks but if EU continues to show signs of weakness then it is very likely the dollar and equities inverse relationship could decouple. Reason being investors around the globe will focus their money on the more stable US investments like the dollar and US stocks.

You can learn how to trade economic news with my free Economic Indicator Trading Tool: http://www.thetechnicaltraders.com/economic-indicators.pdf    


The Dollar is Trading at a Major Tipping Point – Weekly Chart

The dollar index is something that I watch very closely on a daily basis. Focusing on the weekly and 8 hour charts I look for support and resistance levels along with price patterns.

As you can see from the weekly dollar chart below, a large bull flag has formed. This pattern typically means higher prices and in this case the price target is between the 86 and 88 level.


There are few wild cards to toss into the game on what will unfold next:

  1. Currency manipulation seems to be strong and if the US wants a low dollar value then it’s likely it will stay low. This bodes well for stocks and commodities.
  2. Depending on what happens and how things unfold in Euro-land the dollar/stock relationship could decouple meaning they could start to rise together. If we get neutral economic data out of the EU and positive data out of the US it will likely boost the value of stocks and the dollar. But strong negative data out of the EU will more than likely just sent the dollar higher and spooking investors and triggering a selloff in stock prices.

Dollar Index Investing


Dollar Index 4 Hour Chart

I find the dollar index to be a great trading tool in helping me time short term reversals in the equities market.

Taking a look at the 8 hour chart below you can see recurring bullish falling wedge patterns. The most recent brake out was this week and I anticipate the 79.50+ levels to be reached in the near term. If the dollar does continue to move higher then I expect sideways to lower stock prices for a couple more sessions.

That being said, the mixed economic data between the US and EU is going to cause this scenario to be unpredictable. Depending on the jobless claims this week stocks could actually rally while the dollar moves higher. Unfortunately, this week’s mixed data does not provide any trading opportunities that I feel comfortable making.

Dollar Index Trading


Mid-Week Market Conclusion:

In short, I feel a higher dollar is likely to happen. As for stock prices, well they are more of a wild card at this time but my analysis slightly favors higher prices.

To quickly touch on precious metals, they are likely to be under pressure for a few sessions simply because of the rising dollar.

I hope my analysis helps paint a picture of what to expect in the coming days.

Happy Trading,

By Chris Vermeulen, GoldAndOilGuy.com – ETF Trading Analysis & Alerts


Gold “Lackluster” in “Calm Before Storm” as Record-High Rupee Prices Boost Indian Speculation, Dent Physical Demand

London Gold Market Report
from Adrian Ash
BullionVault
Thurs 3 May, 08:50 EST

THE PRICE OF GOLD in wholesale trading slipped to a new 1-week low at $1640 per ounce in London on Thursday as the US Dollar rose and crude oil slipped again.

Ahead of Friday’s much-anticipated US Non-Farm Payrolls report for April, weekly data showed a fall in the number of jobless benefit claimants.

Spain meantime sold €1.6 billion of new 3- and 5-year government debt, paying 1.4 percentage points more in interest than at the last time of asking.

A sale of €5 billion in new government debt in France, where current president Sarkozy looked set to lose this weekend’s election to Socialist candidate Hollande, meantime drew a greater excess of investor demand than at the last sale in April, with interest rates falling slightly on 9- and 10-year debt.

The Euro held at $1.3130 – right in the middle of the last month’s tight 2.5¢ range.

With trading volume now lower for longer than any time since late 2007, US stock market futures pointed 0.2% higher after the Dow Jones Industrial Average yesterday slipped back from 4-year highs.

Slipping in line with the gold price, silver fell back to $30.40 per ounce.

“In this lackluster environment, it seems like the gold bullion market is in need of more than just resilience,” says a note from Swiss refining and finance group MKS.

“[The gold price] has FLAT LINED on a closing basis,” says the latest technical analysis from Russell Browne at Scotia Mocatta in New York, “staying glued between 1635 and 1670 over the past month.

“This sideways consolidation is the calm prior to the next storm…The long-term bullish trend line comes in near 1630 on daily chart.”

Over in India in contrast – the world’s #1 gold consuming nation – “Gold traders have extended their positions in futures market as prices of the precious metal in spot market touched an all-time high,” reports the Economic Times.

Touching INR 29,690 per 10 grams today, the gold price for Indian wholesalers has now recovered 2012’s early 10% fall to reach a series of fresh all-time highs this week.

Amid a wave of strikes and protests by Indian jewellers against this year’s duty and tax rises, last month’s Akshaya Tritiya festival failed to stoke consumer demand, says the Bombay Bullion Association, with gold bullion imports falling to just 30 tonnes from April 2011’s level of 90 tonnes.

Helping gold rise, the Rupee fell further again on the FX market Thursday, extending this week’s drop vs. the US Dollar to more than 1% and erasing the last of 2012’s rally so far.

“The financing of the current account deficit will continue to pose a major challenge,” the Reserve Bank of India recently noted in a policy statement.

“Lot of new positions has been created in [Indian gold futures ] after traders noticed sharp rise,” Money Life quotes Badruddin Khan, researcher at Angel Broking & Commodities.

“The momentum is likely to be continued with a back-up of Dollar appreciation.”

Back in Europe, where the European Central Bank today left its key interest rate unchanged at 1.0% for the sixth month running, factory-gate inflation in the 17-nation Eurozone slipped to 3.3% per year in April, new data showed.

Here in the UK, where the ruling coalition’s Conservative and Liberal Democrat parties were both expecting “dismal”  results in local council elections on Thursday, house prices showed a near 1% annual slip on the Nationwide index.

In London, precious metals consultancy GFMS – now part of the Thomson Reuters news group – said the surplus of available metal over demand rose sharply in both platinum and palladium in 2011, thanks to stockpile sales and weak auto demand, especially in Europe.

Silver bullion stockpiles yesterday retreated further on Wednesday from this week’s 25-year record highs, with the withdrawal of half-a-million ounces of “eligible” metal – which qualifies for settlement in Comex futures, but isn’t made available by the owner – taken out of approved depository storage.

Adrian Ash
BullionVault

Gold price chart, no delay   |   Buy gold online at live prices

Adrian Ash is head of research at BullionVault, the secure, low-cost gold and silver market for private investors online, where you can buy gold today vaulted in Zurich on $3 spreads and 0.8% dealing fees.

(c) BullionVault 2012

Please Note: This article is to inform your thinking, not lead it. Only you can decide the best place for your money, and any decision you make will put your money at risk. Information or data included here may have already been overtaken by events – and must be verified elsewhere – should you choose to act on it.


GBP/USD is on an upside break, will it continue sailing higher?

Since the beginning of this week, GBP/USD has been making convincing gains above its range. And, earlier in U.S. session today, the pair topped at 1.6157. Will it
come down or continue climbing the charts?

U.K’s preliminary report released today at 8.30 am GMT failed to meet consensus in the market. The report came in at -0.2% against
an earlier projection of 0.1%. Since the number came in negative, pound sell-off was triggered in the market, and it lost considerable ground against the other
major pairs. In the previous GDP report, the country also reported a negative figure. Therefore, since it has experienced two straight quarters of
contraction, investors are now pointing to a possible technical recession in the country. This may lead to continued poor performance of the pound in the
coming days.

As earlier mentioned, technical analysis on the GBP/USD reveal that it is experiencing an upside break from its range. Immediate resistance for the pair is found at 1.6170. A convincing break above this area could see it test 1.6250. On the flip side, immediate support is found at 1.5970. A convincing break above this area could see it test 1.5800.

Medium term traders who were long in the pair should hold on to their positions as long as the breakout is still convincing. Short term traders would rather wait for all this drama and the earnings season to end before having a fresh call on the pair. The fundamental condition is still favoring pound sell-off, so long term traders can still take this opportunity to harvest massive profits.

DISCLOSURE & DISCLAIMER: THE ABOVE IS FOR INFORMATIONAL PURPOSES ONLY AND NOT TO BE CONSTRUED AS SPECIFIC TRADING ADVICE. RESPONSIBILITY FOR TRADE DECISIONS IS SOLELY WITH THE READER. FOR MORE INFORMATION AS WELL AS UP TO DATE FOREX ANALYSIS VISIT www.pipstoday.com

EUR/USD is steadily climbing the charts, where will it reach?

Since the start of this week, EUR/USD has been heading northwards. And, earlier during the London session, the pair touched 1.3260, the
highest point this month. Traders have shifted their focus to riskier assets due to strong reports of euro-zone debt auctions released earlier in the week.

EUR/USD has continued to maintain its bullish momentum since the beginning of the week due to risk taking among traders who have avoided safe haven assets. As a result, the common currency has been gaining considerable ground across the board. Although the dollar managed to recoup some of its losses after the positive economic news released from the U.S. today, the real effect of this is yet to be seen in the market.

EUR/USD has been on an uptrend for sometime now. Immediate resistance for the pair is found at 1.3260. A convincing break above this area could expose 1.3333. On the flipside, immediate support is found at 1.3157. A convincing break above this area could expose 1.3063.

Medium term traders who were long in the pair should hold on to their positions as long as the bullish momentum is still evident. However, they should remember that the euro-zone debt problems still have the possibility of making the common currency depreciate in value. Short term traders would rather wait for all this drama and the earnings season to end before having a fresh call on the pair.

DISCLOSURE & DISCLAIMER: THE ABOVE IS FOR INFORMATIONAL PURPOSES ONLY AND NOT TO BE CONSTRUED AS SPECIFIC TRADING ADVICE. RESPONSIBILITY FOR TRADE DECISIONS IS SOLELY WITH THE READER. FOR MORE INFORMATION AS WELL AS UP TO DATE FOREX ANALYSIS VISIT www.forex-australia.com.au