The Commitment of Traders Report, COT Reports for short, is a data release that is published by the Commodity Futures Trading Commission (CFTC), a US Government agency and the regulator of the futures and options markets.
The COT data is released every week on Fridays (except when holidays change the schedule). It shows the statistics of actual trader positions in the futures markets from earlier in the week.
Professional investors, market analysts and journalists are among the many who use the COT data to follow what big money is doing in the markets.
In this article, you’ll gain a better understanding of what the COT is, why it is helpful and some examples of how it can be useful in analysis of the markets. The CFTC publishes a few different types of COT reports each week, in this guide we are going be to focusing on the traditional Legacy Futures Report.
COT Reports Trader Groups – Speculators, Commercials & Small Traders
The COT data, released each week by the CFTC, provides a snapshot of different types of investors in the futures markets. They are categorized into three distinct trader groups called the non-commercials, commercials and the non-reportables. The CFTC places traders into these groups based upon their reasons for taking futures positions and by the size of the positions these traders take.
Here are the Major Players:
Speculators: Hedge funds & large traders use the markets to make a profit
The first group is the one that usually receives the most attention because these traders are thought of as the high-flyers of finance. They are associated with big risks and the big rewards. This group is technically known as the non-commercial trader group in the COT data. However, they are commonly referred to as the Large Speculators or just Speculators.
These traders are for-profit investors that are looking to make money on the changes in the market price. The large speculator group is usually made up of hedge funds, commodity funds and other large speculative entities or individuals.
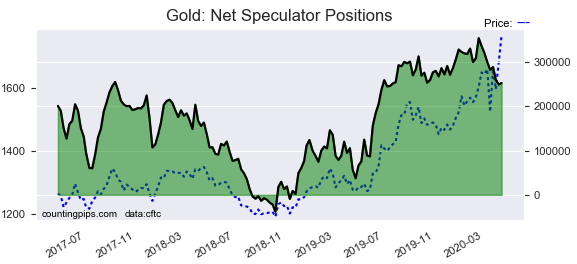
The Specs are generally regarded as trend-followers or momentum traders in their behavior towards price action – net speculator bets and prices tend to go in the same directions for most markets. These traders often look to buy when prices are rising and sell when prices are falling.
To illustrate this point, many times speculator contracts can be found at their most extreme levels (bullish or bearish) when prices are also close to their highest or lowest levels.
These extreme levels can be dangerous for the large speculators as the trade is at its most crowded. There is less trading ammunition still sitting on the sidelines to push the trend further and prices have already moved a significant distance. When the trend becomes exhausted, smart speculators take profits while others will look to exit positions when prices fail to continue in the same direction. This process usually plays out over many weeks to many months. The change in direction can ultimately create a reverse effect where prices start to fall and speculators start a process of selling out and trend-following in the new direction.
Signup for Our Weekly COT Newsletter
Commercial Traders: Companies primarily hedging business risk
Next up, the commercial trader group is referred to as simply the Commercials. These large traders are usually large companies, institutions, multi-national corporations or other business entities. These companies make money from their underlying businesses but are in the futures markets in order to hedge.
Whether it is hedging against foreign currency risk or directly in the markets for their products (grains, oil, etc.), commercials have a vested interest in hedging the price movements that could adversely affect their business profits. A simple example could be a large cereal producer like Kellogg’s or General Mills. These companies would need to take positions in the grains futures market to hedge against the grain price going too high or too low.
The commercials are many times described as the smart money of the markets. This is because they have the advantage of day-to-day business knowledge in these markets as well as a long track record of hedging in these markets. They also have the deepest pockets of all the market players.
In terms of price action, the commercials can almost seem like a value investor as these traders are often buying when prices are falling and selling when prices are rising. At the extremes, commercial positions are usually head-to-head against the speculators and at these times, the commercials are more often likely to win the battle (but not always!). When strong commercial buying helps put an end to the price trend or when price starts to reverse against the speculators, this usually leads to the speculators liquidating their positions.
Overall, the commercials are the smart money of these markets as they have the most information. It is always good to know what they are doing and it is very important to know how extreme their position is.
Small Traders: COT Traders not large enough to be either of the previous two groups
The last group is called the non-reportables which are usually known as the Small Traders. This is because these traders have positions that are not large enough for the CFTC to classify them as either speculators or commercials. The small traders group is commonly thought to be made up of small retail traders (the least informed participants in the market) and often called the dumb money.
However, in reality, this group often contains a mix of small commercials and small speculators as well as retail traders. The CFTC confirms the opaqueness of this group saying of the non-reportables, “the commercial/non-commercial classification of each trader are unknown”.
In his insightful COT Book (The Commitment of Traders Bible), Stephen Briese shows examples and analysis that the small traders sometimes trade like the speculators while other times they trade like the commercials. In the end, it is harder to place a distinct trading motive on these traders.
Is COT Data Useful? Why does anyone care about the COT Reports?
This is the main question for traders and investors who may have never heard of the COT or have never invested any time into looking at this data. In my opinion, the answer is a definite yes.
The COT data is useful because it is unique and it is a record of actual trading statistics of the major players in the markets. There are not any comparable and consistent data-sets out there that provide this type of information in such an array of the major markets.
The COT data is superior to many of the so called ‘soft data’ releases. These include investor surveys, opinions of fund managers or other collections of opinions where investors express how they feel about things or what their outlook is. The COT data is where the large players have actually put their money.
In many financial articles, the COT data is used to tell the story of speculator sentiment, commercial trader sentiment or to give a coloration of what is happening in the markets beyond just price.
I can tell you the first time I read my favorite books on COT (Larry Williams’ Trade Stocks and Commodities with the Insiders: Secrets of the COT Report and Steve Briese’s Commitments of Traders Bible), I was fascinated by the examples they gave and the potential this data held. Now, after more than ten years of following and charting the COT data religiously, I have come to understand that these insightful signals and patterns they described are almost commonplace. They are happening all the time in one market or another.
Short-Term Traders, Long-Term Traders
The COT reports can be beneficial for all different types of traders. Short-term traders, scalpers or day-traders can use the COT report and it would probably be most helpful for them to focus on where the speculator position is currently. This is because speculators are trend-followers and bet in the direction of the current price trends. Many markets can be strongly correlated with the speculator trends and it is important to follow these trends as speculators being bullish will more likely see prices that are bullish and vice versa.
Swing traders or longer-term traders are more interested in watching the two largest trader trends, commercials and speculators. In the short-term, speculators are usually dominating price, true to their trend-following nature. In the longer term, when positions have become extreme, commercials usually dominate the future direction of price.
Drawbacks to COT Reports Data:
There are some drawbacks that come with using the COT data, like any trading strategy. The main drawback and criticism to the COT is that it is published three days late. It is released on Fridays and is up-to-date through the close of the previous Tuesday. This can inhibit a way to time the markets, especially for shorter-term traders. This is less of an issue for the longer-term traders because they are still looking for the overall trends, deviations from the overall trends or extremes in the large trade positions.
The answer, in my opinion, to this valid criticism (and also as an overall recommendation) is to always combine the COT analysis with other types of trading strategies and analysis. Know the overall fundamentals and main economic drivers of the markets you trade as a first step. Then add in other components such as technical analysis, statistical analysis or alternative data that will complement the COT and provide a better timing method.
Some other drawbacks to this data I have experienced and would like to highlight are:
- Some markets do not seem to behave as well in tandem with the large trader positions (I have found the stock markets do not correlate as easy to COT data as the other markets)
- The market positions can take a long time to change (many months), patience is warranted and this is where other types of analysis are key
- The data is also subject to revision by the CFTC and has been updated on occasion. This has been very rare in my experience
- The data was affected by the US government shutdowns and and temporarily unavailable (December 2018 into early January 2019), a possibility in the future as well
Net Positions – How we define the Positioning of Traders

We know that speculators, commercials and small traders make up the participants in the futures markets but how do we classify where each trader is positioned in the market? The CFTC gives us the total number of long positions for each trader group and the total number of short positions for each trader group.
We simply subtract the total shorts from the total longs to get the net position. More total longs compared to the shorts will give us a net bullish (or long) position for that trader group while more shorts than longs will give a net bearish (or short) position.
Extreme Positions – Where things can take a turn
The COT is a useful tool to gauge the sentiment of each type of participant. There are times when the COT is much more effective than others. A very useful time for COT analysis is when the net positions of the large traders (Speculators and Commercials) go into extreme levels. This is when we must analyze the market situation and decide is we are looking for a possible trend change.
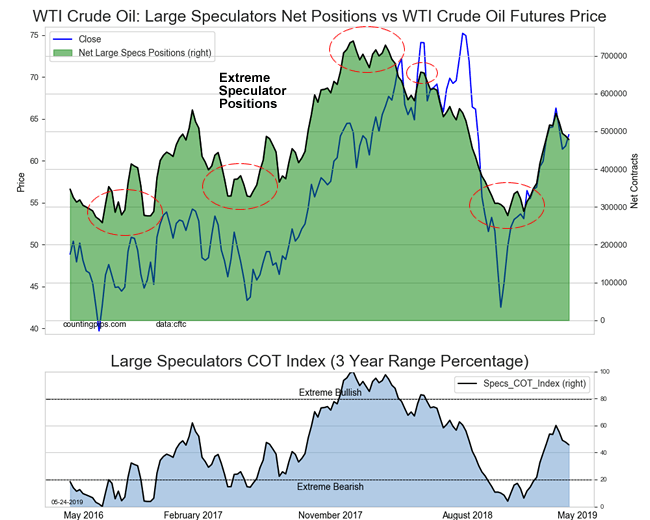
An easy and straightforward way to decipher whether the current position is at an extreme level is to compare the current level to the levels of the past. This is done by a statistical technique called the COT Index that I first saw used in the Larry Williams COT book, Trade Stocks and Commodities with the Insiders: Secrets of the COT Report. The COT Index result compares the current data with the data over the past three years.
The Speculators COT Index can be seen in the above chart (WTI Crude Oil) as the light blue histogram underneath the Net Speculator Position chart. The circles in the top part of the chart correspond to the times when the COT Index reading is either above the 80 level (extreme bullish) or when the reading is below the 20 (extreme bearish).
Since this is a chart of the Speculators, you will notice that when the COT Index is at extremes, the price usually reverses soon after and heads back the other way. Speculators will then liquidate their positions and start following the trend in the opposite direction.
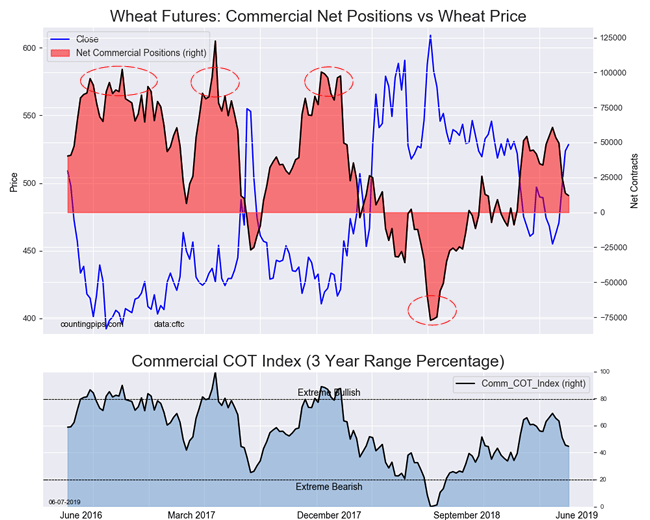
The Commercials COT Index, shown in the chart above (Wheat), basically depicts the opposite characteristics of the Speculator COT Index. When the extremes are hit by Commercial Traders, prices will usually start to trend towards the direction of the extreme Commercial position. Not always and not immediately but when in great numbers, the Commercial traders can possess overwhelming fire power to put a stop to price trends.
A 10-Year Bond Example: An Extreme Turnaround
Let me give you one example that has been kind of a big deal in the early months of 2019 and now currently into June of 2019. As of June 5th, the yield curve is inverted in a very important part of the US Treasury market. The 3-month treasury bill has a yield of 2.35 percent (June 5th) compared to the 10-year bond which has a yield of 2.12 percent (June 5th).
This means you can invest your money and expect to get a bigger yield in the 3-month bond than the 10-year bond. It is an upside-down situation (it first appeared in March 2019) that is a deviation from normal times and it signals that things are out of whack in the bond markets.
A keen COT observer could have been able to see the 10-year bond aspect of this coming much earlier than the mainstream would lead you to believe. On September 25th of 2018, the 10-year bond futures market saw Speculators push their bearish bets to a record high level of -756,316 contracts. Speculators were super-duper, all-time bearish. This was also just after reaching a total of -700,514 contracts in the previous month on August 21st. Remember when bond prices go down, the yield for that bond goes up. At that time, the 10-year yield was above 3.00 percent and most of the bond experts were calling for an end to the 30-year bond bull market. This was just the beginning of higher yields as far as the eye could see.
As we look at the chart below, we could see that Speculators (green) were selling very heavily into 2018 and with prices (blue) falling as well. The peak of selling coincided with the bearish peak in prices when the extreme is reached at the bottom of the chart. This means that a record number of speculators were betting that bond prices would fall even further. Just as the bottom was happening. The Commercials (red) were on the other side of this buying up as much as they could at the same time. An extreme situation is reached.
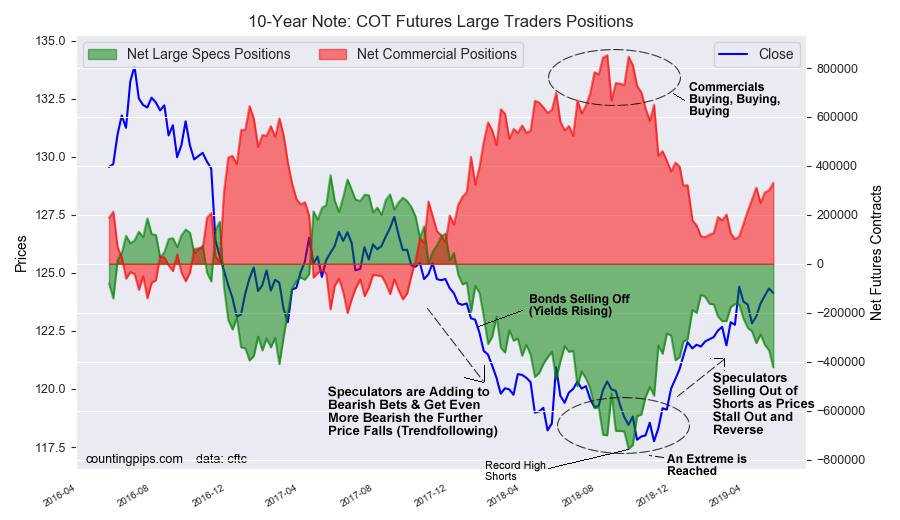
What happens next is a classic pattern in the COT data. The immense buying pressure from the Commercials combined with the Speculators starting (smart ones taking profit) to close out some of their positions takes a toll and stops the trend. This turns into a stampede out of bearish bets once price fails to make a new low level. The process eventually feeds on itself and reverses with higher prices (and lower bond yields). Meanwhile, the US Federal Reserve continued to raise interest rates into December 2018 and helped nudge the 3-month yield even higher.
Would we have even the faintest idea that an inverted yield curve would occur? Absolutely not. A yield curve inversion happens only very, very rarely (maybe once a decade). The inversion can be chalked up to a coincidental byproduct of this latest bullish cycle in bonds. But what the COT did tell us months before the Fed raised the rate for that last time in December of 2018 was that the 10-year bond yield had likely peaked and was more likely to be falling going into the new year (bond prices would rise).
I think this example highlights that COT analysis can alert us to market situations building up ahead of the mainstream as well the fact that markets tend to overshoot on the way up and on the way down, especially when there is a large speculative aspect involved.
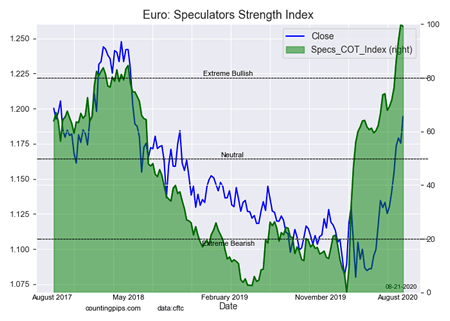
Euro Currency Example: From Extreme to Extreme
In this next example, the Euro currency large trader positions go from one extreme position to another over a period of three years (points 1,2,3 on chart). Starting from the left hand side of the chart in the first half of 2016, we can see that the Speculator position (green) and the euro price (blue) are closely sticking in tandem and heading lower. The Euro was trading close to the 1.15 exchange rate.
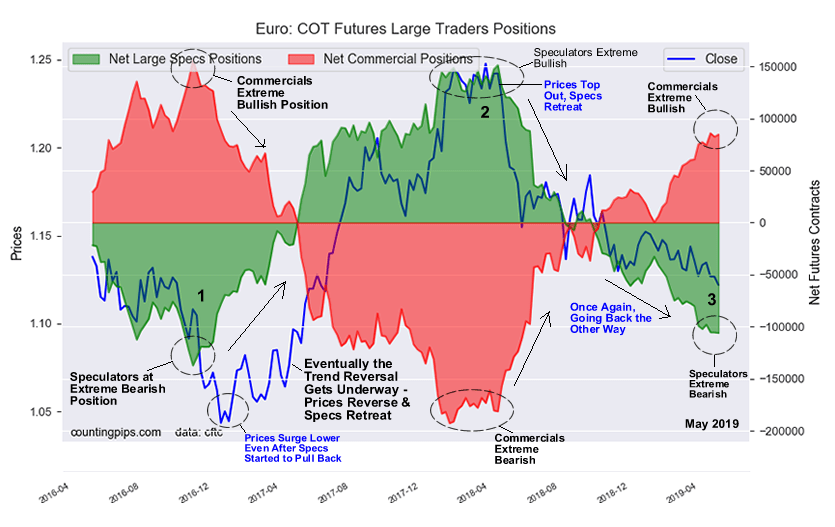 Point #1: The Euro had been relatively weak throughout 2015 (not shown) and into 2016 with an eventual decline into an extreme position in the fall of 2016. The speculator position reached an extreme position (point #1) with a maxed out bearish position on November 1st of 2016 at a total of -137,385 contracts.
However, the Euro price continued to fall and stretched lower, even past the point (markets can tend to overshoot) when speculators started to reduce their bearish positions. Bottoming out just a little over two months later on January 3rd of 2017, the Euro hit a low near the 1.0350 the exchange rate in the spot market. Around this time, there were many very reasonable views and commentaries that the Euro could hit 1 to 1 with the US dollar then head even lower.
As you can see from the chart, the Euro price trend exhausted itself and started to go back the other way (away from point #1).
Point #2: Speculators bets flipped from a net bearish position of -1,653 contracts on May 2nd 2017 to a net bullish level of +22,399 contracts on May 9th. In fact, from April 25th to June 13th of 2017, the Euro Speculator bets jumped by a total of +100,702 contracts in just that eight-week period.
The turn of fortune for the Euro eventually culminated in the next extreme reading, this time on the bullish side for Speculators, at point #2. This bullish cycle took a long time to complete and reached a climax early in 2018 with record high level of 151,476 bullish contracts on April 17th. This marked an all-time record high for Speculator bullish positions. Price tops out just above the 1.2500 exchange rate and when price cannot go any further, we see the speculative positions start to retreat and reverse the cycle once again.
Point 3: Price reverses itself all the way from 1.2500 in 2018 to under 1.1200 in early 2019. Speculators, as expected, continued to push their bearish bets as the Euro price retreated and eventually reached an extreme bearish position on March 26th of 2019. The extreme bearish level has continued through this report in early June 2019.
Get Our Weekly COT Reports: Email Newsletter
Is the COT data something that seems like it will benefit your analysis or trading? Then consider joining thousands of investors and see where the big players (large funds and business hedgers) are positioned in the futures markets on a weekly basis by subscribing to our weekly newsletter.
The Reports include: Major Currencies, Major Commodities, Stocks and Treasuries.
Sign Up for Our Weekly COT Newsletter here.
Article by Zachary Storella, founder & editor of investmacro.com, an investor, computer programmer and a COT enthusiast since 2007.