Author Archive for InvestMacro – Page 37

Technical Analysis & Forecast 09.11.2023

By RoboForex.com

EURUSD, “Euro vs US Dollar”

EURUSD has completed a declining impulse to 1.0658, correcting to 1.0714 today. An extension of the correction to 1.0725 is not excluded. Next, the declining wave could continue to 1.0630. With a downward breakout of this level, the potential for a wave to 1.0540 might open. This is a local target.

EURUSD
Risk Warning: the result of previous trading operations do not guarantee the same results in the future

GBPUSD, “Great Britain Pound vs US Dollar”

GBPUSD has performed a declining impulse to 1.2245, correcting to 1.2300 today. A new link of growth to 1.2333 might develop later. Next, a new wave of decline to 1.2222 is expected to begin. If this level breaks downwards, the potential for a wave to 1.2073 could open. This is a local target.

GBPUSD
Risk Warning: the result of previous trading operations do not guarantee the same results in the future

USDJPY, “US Dollar vs Japanese Yen”

USDJPY has completed a wave of growth to 151.04. Today the quotes could correct to 150.05. Next, a new wave of growth to 151.44 might begin, opening the potential for 152.15 once the 151.44 level breaks upwards.

USDJPY
Risk Warning: the result of previous trading operations do not guarantee the same results in the future

USDCHF, “US Dollar vs Swiss Franc”

USDCHF has completed a wave of growth to 0.9030, and a link of decline to 0.8970 is expected today. Practically, a consolidation range is forming at these levels. With an escape from this range downwards, a decline to 0.8918 might follow. And with an escape upwards, the potential for a rising wave to 0.9133 might open.

USDCHF
Risk Warning: the result of previous trading operations do not guarantee the same results in the future

AUDUSD, “Australian Dollar vs US Dollar”

AUDUSD continues developing a wave of decline to 0.6383. Once this level is reached, a link of correction to 0.6450 is not excluded, followed by a decline to 0.6333. This is a local target.

AUDUSD
Risk Warning: the result of previous trading operations do not guarantee the same results in the future

BRENT

Brent has completed a declining wave to 79.11. Practically, the potential of the declining wave has expired. A consolidation range could form above the 79.11 level today. With an escape upwards, the potential for a wave of growth to 85.75 could open. This is the first target.

BRENT
Risk Warning: the result of previous trading operations do not guarantee the same results in the future

XAUUSD, “Gold vs US Dollar”

Gold continues developing a consolidation range around 1961.55. With an escape downwards, the potential for a declining wave to 1920.00 might open. Next, a link of correction to 1960.00 is expected (with a test from below), followed by a decline to 1913.50. This is the first target.

GOLD
Risk Warning: the result of previous trading operations do not guarantee the same results in the future

S&P 500

The stock index has completed a declining impulse to 4362.2, correcting to 4390.0 today. Next, a wave of decline to 4330.3 is expected, from where the trend could continue to 4242.0. This is the first target.

S&P 500
Risk Warning: the result of previous trading operations do not guarantee the same results in the future

Article By RoboForex.com

Attention!
Forecasts presented in this section only reflect the author s private opinion and should not be considered as guidance for trading. RoboForex LP bears no responsibility for trading results based on trading recommendations described in these analytical reviews.

China is once again facing disinflation problems. BoE head pointed to the bank’s “dovish” stance

By JustMarkets

As of Tuesday’s stock market close, the Dow Jones Index (US30) decreased by 0.12%, while the S&P 500 Index (US500) added 0.10%. The NASDAQ Technology Index (US100) closed positive by 0.08%. The broader market fluctuated on Wednesday amid mixed corporate news.

The US economic news on Wednesday was favorable for the dollar as wholesale sales for September rose by 2.2% m/m, which exceeded expectations of 0.9% and was the largest increase in 20 months. Meanwhile, the MBA weekly US Mortgage Applications rose by 2.5% week-over-week

On Thursday, markets are expecting Fed Chairman Powell’s comments during a conference call on monetary policy issues. On Wednesday, Powell did not comment on the economy or interest rates while delivering opening remarks at the Fed’s Research and Statistics Division Centennial Conference. Currently, markets are factoring in a 10% probability of a 25 bps rate hike at the next FOMC meeting on December 12-13 and an 18% probability of a 25 bps rate hike at the January 30-31, 2024 FOMC meeting.

Equity markets in Europe were mostly up yesterday. Germany’s DAX (DE40) added 0.51%, France’s CAC 40 (FR40) gained 0.69%, Spain’s IBEX 35 (ES35) rose by 0.52%, and the UK’s FTSE 100 (UK100) closed negative by 0.11%.

The ECB’s monthly survey of consumer inflation expectations showed that 1-year Eurozone inflation expectations rose to a 5-month high of 4.0% in September from 3.5% in August, but 3-year inflation expectations were unchanged at 2.5%. Eurozone retail sales for September fell by 0.3% m/m, weaker than expectations of 0.2% m/m. ECB Governing Council representative Kazaks said yesterday that the ECB cannot rule out the possibility that further rate hikes may be needed.

Key messages from the Bank of England (BoE) Governor’s speech yesterday:

  • It is really too early to talk about cutting rates;
  • The main message is that we think policy should be restrictive for a long period of time, even though there are upside risks;
  • We think policy is restrictive now, and economic growth is very weak.

Crude oil prices Wednesday extended Tuesday’s sharp losses as crude oil (WTI) fell to a 3-month low. Weakening oil demand contributed to the sell-off amid recent economic news indicating weakness in China’s economy. Additionally, crude oil has been pressured by hawkish central bank comments that have curbed speculation that central banks are done raising interest rates. Tuesday afternoon’s weekly API report was negative for crude oil as it showed that US crude inventories rose by 11.9 million barrels last week. There was no weekly EIA inventory report on Wednesday due to a system update.

Asian markets were mostly down yesterday. Japan’s Nikkei 225 (JP225) decreased by 0.33% on Wednesday, China’s FTSE China A50 (CHA50) lost 0.28%, Hong Kong’s Hang Seng (HK50) was down by 0.58% for the day, and Australia’s ASX 200 (AU200) was positive by 0.26%.

In China, the latest data showed that both consumer and producer inflation fell in October, bringing the country into disinflation territory for the second time this year. The inflation data was released against a backdrop of disappointing trade data for October, with data released last week showing a steady decline in business activity in China during the month. The weak October data added to fears of a slowdown in China’s economic growth. However, more significant losses in Chinese equities were tempered by gains in real estate stocks, which rose amid reports that Beijing is considering additional measures to support the sector.

S&P 500 (F)(US500) 4,382.78 +4.40 (+0.10%)

Dow Jones (US30) 34,112.27 −40.33 (−0.12%)

DAX (DE40)  15,229.60 +76.96 (+0.51%)

FTSE 100 (UK100) 7,401.72 −8.32 (−0.11%)

USD Index  105.54 −0.01 (−0.01%)

News feed for 2023.11.09:
  • – China Consumer Price Index (m/m) at 03:30 (GMT+2);
  • – China Producer Price Index (m/m) at 03:30 (GMT+2);
  • – US Initial Jobless Claims (w/w) at 15:30 (GMT+2);
  • – US Natural Gas Storage (w/w) at 17:30 (GMT+2);
  • – Eurozone ECB President Lagarde Speaks at 19:30 (GMT+2);
  • – US Fed Chair Powell Speaks at 21:00 (GMT+2).

By JustMarkets


This article reflects a personal opinion and should not be interpreted as an investment advice, and/or offer, and/or a persistent request for carrying out financial transactions, and/or a guarantee, and/or a forecast of future events.

Bitcoin shoots past $36k on ETF excitement

By ForexTime 

  • Bitcoin hits highest level in 18 months ​​​​​​
  • Cryptocurrency boosted by ETF excitement
  • Bullish flag seen on H4 chart
  • Weekly resistance level might act as catalyst

Bitcoin jumped to a fresh 18-month high on Thursday as excitement returned over simultaneous approvals of spot Bitcoin ETFs.

Starting from today, the SEC has an eight-day window to potentially approve all pending spot Bitcoin ETF fillings – including the world’s largest bitcoin fund called the Grayscale Bitcoin Trust. This is a welcome development for the cryptocurrency space given the growing ETF hype, injecting Bitcoin bulls with renewed strength.

As highlighted in the past, a spot bitcoin ETF would provide investors easier and greater access to the world’s largest cryptocurrency without having to own it – potentially attracting new investors as a result.

Focusing on the technical picture, bitcoin is currently ruled by bulls and a solid uptrend can be seen on the daily charts.

Prices are fast approaching weekly resistance at 37,448 and this level might act as a catalyst for either bulls or bears. For bulls, it will be a continuation of the current impulse wave and for bears it will be the start of a possible correction wave.

On the H4 chart a huge bullish flag is visible with the price just having broken out and heading for the weekly resistance level. Both the 50 Exponential Moving Average and the Moving Average Convergence Divergence (MACD) confirm the upward momentum.

If prices reach the weekly resistance level at 37,448.98, two scenarios become possible.

  • Allowing the market structure to confirm, a possible bounce and then a retest to the downside will act as a bearish trigger for a daily correction wave to start.

  • On the other hand, a break though the weekly resistance level and then a retest will be a bullish trigger for a continuation of an impulse wave in the daily uptrend.

For both scenarios, good risk management is paramount since wild swings are often seen on this volatile instrument.


Forex-Time-LogoArticle by ForexTime

ForexTime Ltd (FXTM) is an award winning international online forex broker regulated by CySEC 185/12 www.forextime.com

Billion Dollar Players

Source: Michael Ballanger  (11/6/23) 

Michael Ballanger of GGM Advisory Inc. shares his thoughts on the current state of the stock market, including movements in gold and silver. Ballanger also explains why he believes one uranium stock may be worth your attention.

I used to HATE listening to a local program called Shark Tank, where a group of Canadian “silver spoons” lecture the viewing public exactly WHY they were “so incredibly successful” in their abilities to take great ideas offered by young people and turn them into serious PERSONAL net worth enhancements.

One of the final group of “entrepreneurs” on that program in the early days was none other than Kevin O’Leary, the Canadian entrepreneur who made his fortune pitching The Learning Company (originally founded by O’Leary as “Softkey”) to Mattel Inc. for US$4.2 billion in what was later called “one of the most disastrous corporate acquisitions in recent history” as a US$50 million profit forecast turned into a US$105 million loss wiping out US$3 billion in Mattel’s market cap in a single day.

O’Leary was sued by Mattel and snuck away unscathed, but whether it was fined by Autorité des Marches Financiers for violations of the Securities Act (O’Leary Funds) or lawsuits by partners, he seems to have a habit of becoming embroiled in controversy.

The biggest controversy in a career that began in Toronto as a cat food brand manager for Nabisco came last year when he was cited as a spokesperson for FTX Corp. founded by Sam Bankman-Fried (“SBF”), who was this week convicted of defrauding investors of billions of dollars which were diverted from his crypto exchange to his personal hedge fund (Alameda) which in turn threw millions upon millions of dollars at people like Kevin O’Leary (and Tom Brady, Steph Curry, and supermodel Gisele Bündchen) as well as dozens of U.S. politicians (who have been noticeably reticent in returning any of the money.)

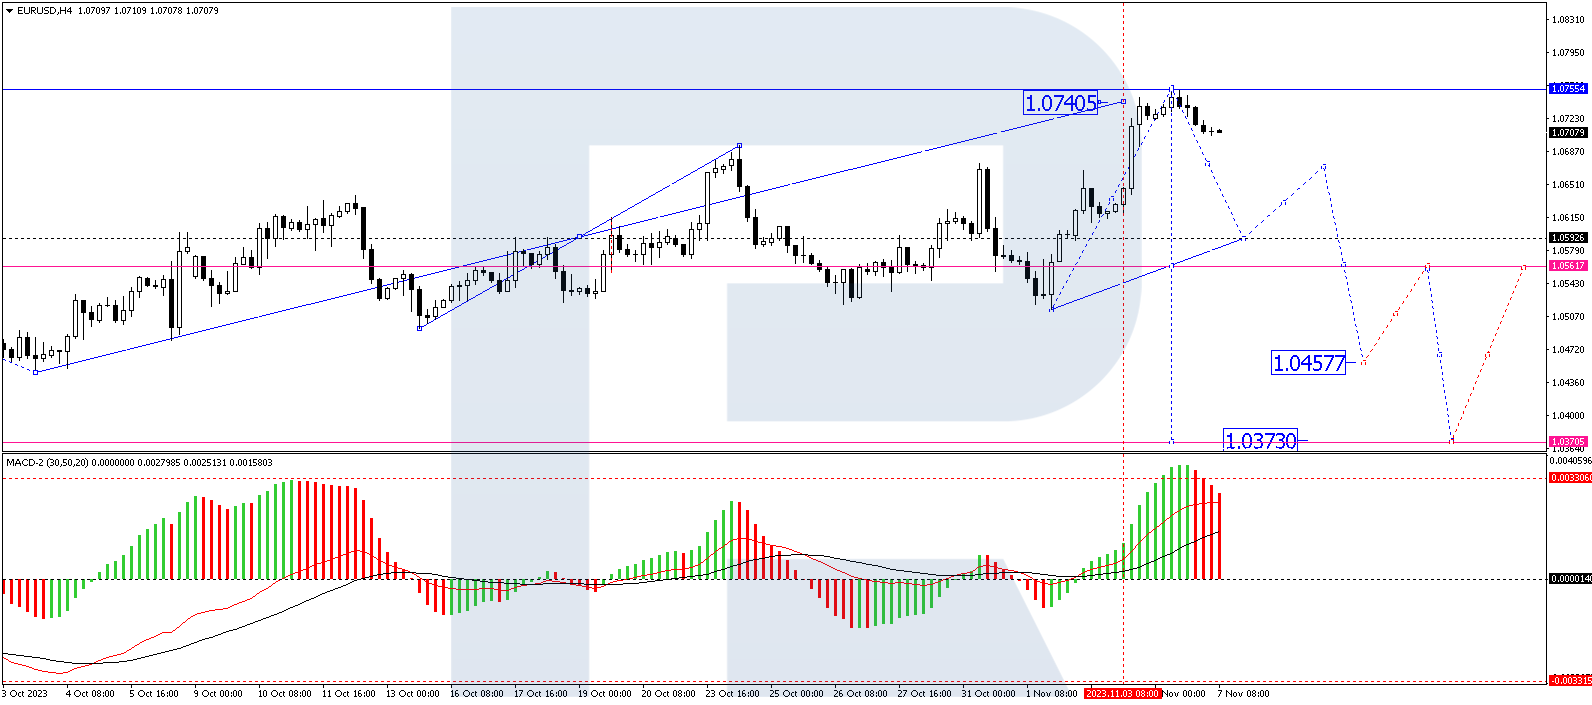
Now that the markets have once again spoken loudly in response to the somewhat dovish tone set out by Chairman Powell last Wednesday, the “Seasonality Trade” that I have been chirping about for the last three weeks looks to have finally arrived.

O’Leary continues to pump various products and services that seem to be on the thin edge of the knife, but for a celebrity pitchman who was seen every other week on BNN or CNBC spouting his esteemed opinion on everything from crypto (which he hated before FTX dumped US$10mm into his burgeoning bank account) to IRS tax tips, his career has now devolved into that of a carnival barker or snake-oil salesman.

Countless times, I have written about how decades of unbridled credit creation and deficit spending have created an environment of total disrespect for the purchasing power of a nation’s currency. No better example of how money corrupts was the recent book by one of my all-time favorite authors, the magnificent storyteller Michael Lewis (“Liar’s Poker,” “The Big Short,” “Boomerang”), chronicling the life of SBF that essentially absolves him of any “malice of intent” in his looting of billions of investor dollars while buying properties, sports teams, and political favor through illegal campaign contributions.

When I read the book (“Going Infinite – The Rise and Fall of a New Tycoon”), I came away horrified that an author who cut his teeth working on Wall Street — who wrote the book on shysters and confident men (and women) — could misread SBF and present him as an absent-minded dreamer with aspirations of saving the world from an “Artificial Intelligence Armageddon.”

This is what happens when money mysteriously shows up on a doorstep, and the finder has no idea how it got there. There is zero respect for what labor hours were required to create it or the identity of the people who originally earned it.

Politicians in Ottawa or Washington or London have zero interest in protecting the purchasing power of the savings of the voters they represent because those voters are more than happy flipping houses in a hot real estate market, and as long as the voter next to you gets hit with a tax increase, and you dodge the CRA or IRS bullet, all is good with the Federal deficit and life goes on.

I watched the cable coverage of the SBF verdict, and the talking heads on CNBC still look at SBF as a cult hero of sorts, with Jim Cramer trying to navigate around the fact that he called SBF “the new J.P. Morgan” back in 2022 but now refers to him as “an idiot,” a “con man,” a “pathological liar” in what has to be the greatest 180-degree opinion reversal in cable TV history.

Our entire culture has become a cultist culture where social media creates a myriad of causes that everyone with a cell phone can champion with little or no regard for consequences. You can sit in your mom’s basement and praise Sam Bankman-Fried for his entrepreneurial talents, and then, with the help of the keypad, delete everything you ever tweeted about the crook and deny you ever heard of him.

You can also call Leafs enforcer Ryan Reeves a “weak-kneed pansy” from the safety of cyberspace, knowing full well you would never say it while standing in front of him. In the era of “schoolyard judgment” in which I was raised, if you said something to someone that was out of line, you assumed that a knuckle sandwich was coming your way, and what that created was a “culture of accountability” in which you only said or did what you could back up. Applying that to today’s credit-addicted world, if politicians and central bankers were held accountable for 9% inflation rates and unaffordable house prices, it would be amazing how quickly the policies of the Bank of Canada or the U.S. Fed would change.

Only because Sam Bankman-Fried got caught did the MSM change their tune; now he is going to jail. Well, policy-makers were caught a year ago when the inflation rate hit 9%, and they are still worshipped, deified, and exalted as if they actually do “God’s work” in trashing domestic currencies the world over. Something is not exactly “right.”

Stocks

When the vast majority of the stock market “gurus” make a good call, they usually begin with the phrase “As I told you last week/month/quarter. . .” and then proceed to brag for the next three paragraphs about how much money they made their clients/subscribers/apostles.

I will not do that.

However, now that the markets have once again spoken loudly in response to the somewhat dovish tone set out by Chairman Powell last Wednesday, the “Seasonality Trade” that I have been chirping about for the last three weeks looks to have finally arrived.

More importantly, the trade that confirms this is the iShares 20+ Year Treasury Bond ETF (TLT:NYSE), which I have owned only for a couple of weeks, having bought it in the US$83 range with 10-year and 30-year yields punching out through 5%.

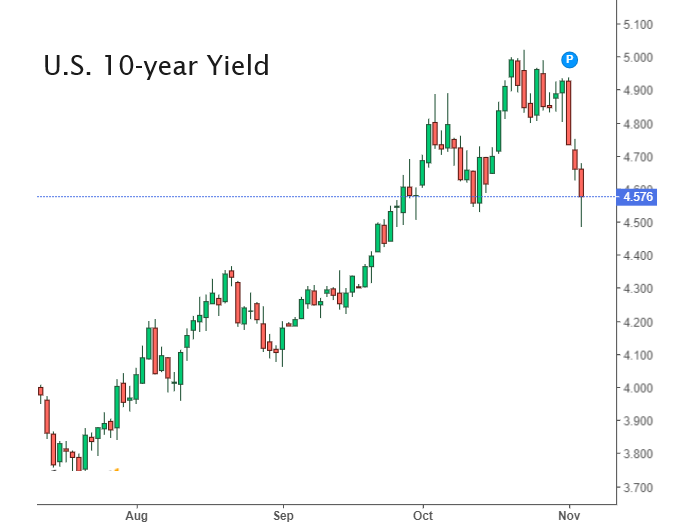
The 10-year yield hit 5.02% last week before a wicked rally kicked in, taking it right back down to 4.55% by Friday’s close.

The U.S. Dollar index had a huge crash to close out the week, dropping 1.01% to 104.90.

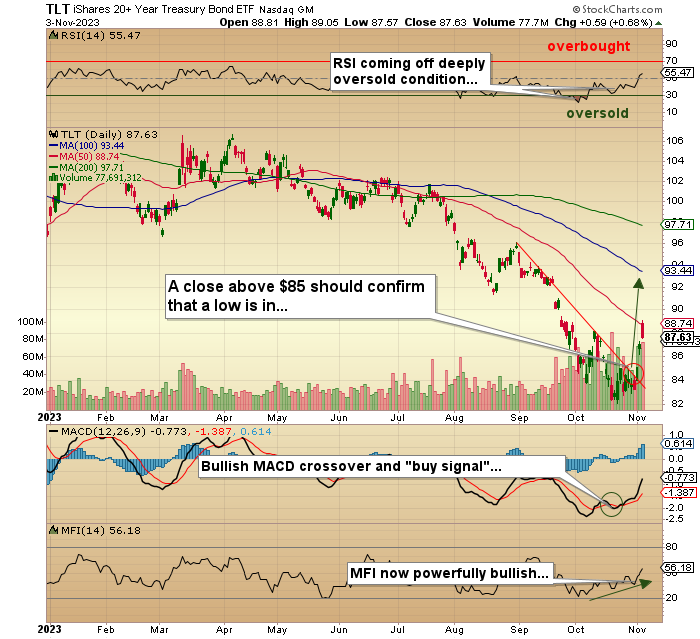
I see a move to the 100-dma at US$93.44 and then up to the 200-dma at US$97.71, with my ultimate objective being “somewhere north of US$100.”

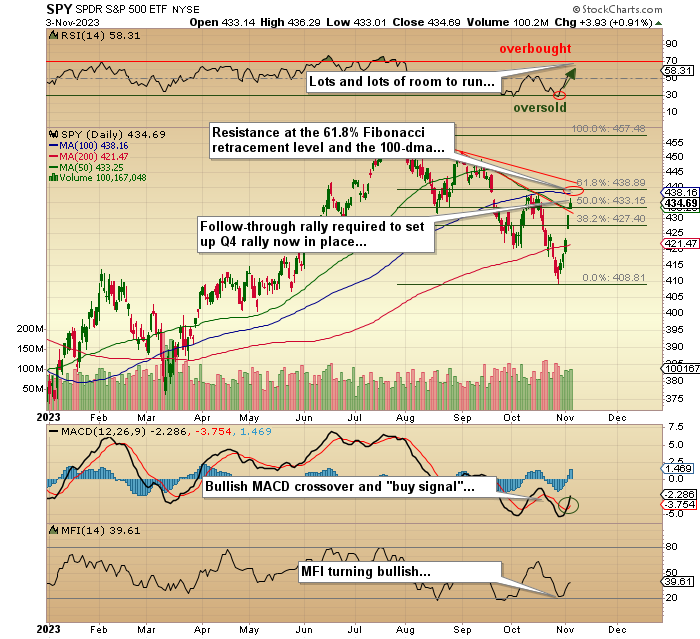
I bought the SPDR S&P 500 ETF (SPY:NYSE) Dec US$445 calls in mid-October before the Israel-Hamas war broke out and elected to stick with them despite some fairly intensive selling in the latter part of the month. Luckily (or brilliantly), I sent out an Email Alert right after the Fed rate decision was announced buying the SPY:NYSE Dec US$425 calls, with the result being a three-day ride from the outhouse to the penthouse and a US$10k loss transforming itself into a US$12k gain.

With corporate buybacks kicking in and earnings season now behind us, it should be (operative word “should”) clear sailing until New Year’s, with the proviso being possible geopolitical flare-ups and/or inflation surprises. If I am right on the TLT:NYSE, I will be very right on the SPY:NYSE trade.

The other risk is that the macro outlook weakens sharply and much faster than the Street expects, but that is unlikely until Q1/2024.

Gold and Silver

After the NFP numbers came out and the U.S. dollar began to tank, December Gold bolted out of the gate to US$2,012 and for a while appeared to be headed for a nice weekly close above US$2,000 but for some ungodly reason (tongue-in-cheek), sellers arrive, and prices leaked all the way to the Comex pit session ending with the weekly settlement price at US$1,999.20.

I fully expected to see a bunch of bullion bank traders thumbing their noses at us from the outer ring, giving each other the “wink, wink, nudge, nudge. Say-no-more, say-no-more” Eric Idle routine from Monty Python days.

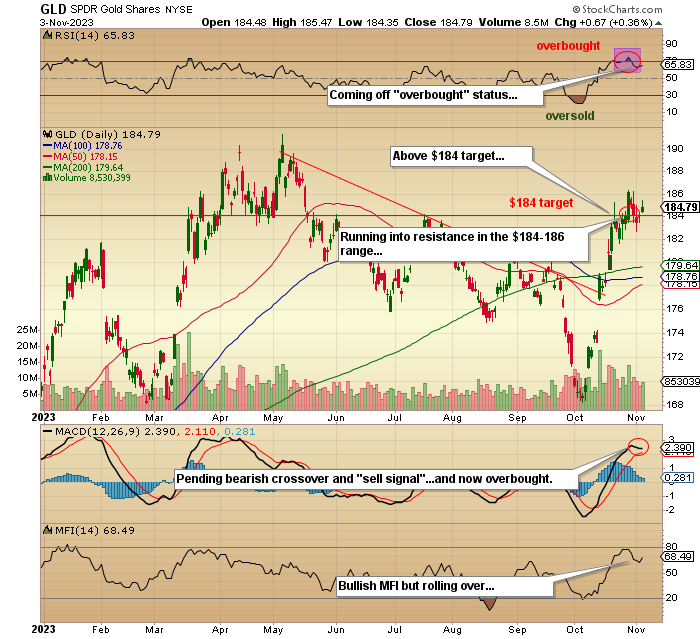
I exited the SPDR Gold Shares ETF (GLD:NYSE) trade two weeks ago when it punched above my US$184 target price and continued up to US$186 before correcting back down under US$183. The good news is that silver had an excellent day, closing 2.14% higher versus gold’s 0.32% increase, and as I continue to preach ad nauseam, silver must get into gear and consistently outperform gold for the precious metals rally to sweep both metal and miners higher.

The gold miners had a good day on Friday, with the HUI tacking on 4.31%. I own the VanEck Gold Miners ETF (GDX:NYSEARCA:) and the December US$25 calls and the Direxion Daily Gold Miners Index Bull 2X Shares (NUGT:NYSEARCA) and the December US$30 calls all at breakeven prices to close out the week.

Since the miners came down in October acting like “stocks” rather than “gold stocks,” they should (that operative word again) perform in line with the SPY:NYSE (and stock rally) until after New Year’s Day.

New Trade

I have been bullish on uranium since 2017, which means I have seen two rallies, neither of which I traded.

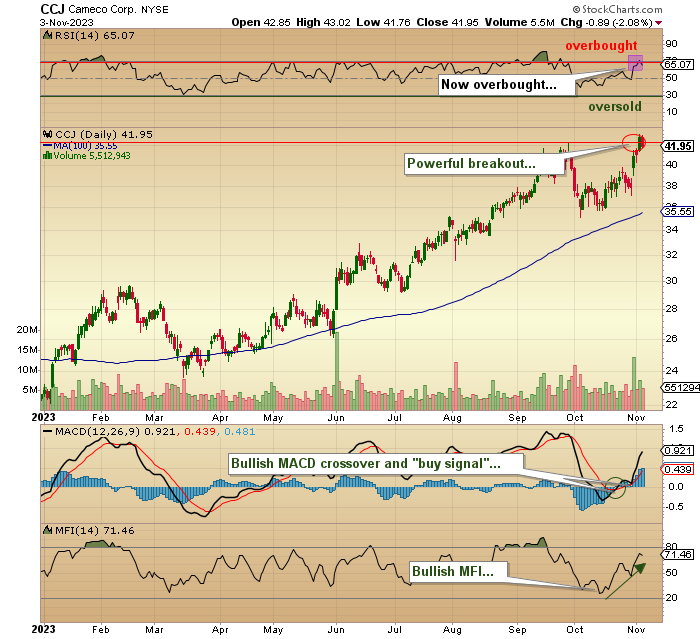
At the start of the year, I came up with the concept of the “Electrification Trilogy,” calling for increases in demand for new sources of electricity (nuclear/uranium), transmission infrastructure (wiring/copper), and electrical storage (batteries/lithium) and while I maintained exposure to copper and lithium, I really only had a small position in one uranium developer forgetting all the while that the best proxy for uranium has to be Cameco Corp. (CCO:TSX; CCJ:NYSE).

While I find it difficult to own any stock after it has nearly doubled, I listened to the conference call this week after they reported blow-out earnings, and what grabbed me by the throat was the forward guidance in which they said: “We are seeing durable, full-cycle demand growth across the nuclear energy industry.”

That is really positive guidance, and with 57 new reactors currently under construction around the globe and with Germany reversing their decision to dismantle three of their power plants, the demand for uranium is going to kick in long before new supply can hit the market.

Accordingly, I decided to bite the bullet and take a punt on a few Cameco March US$40 calls in the US$5.00 range on the assumption that I will see all-time highs above US$46.41 by New Year’s Day and US$50 in Q1/2024.

I know I am late to the party, but with guidance so powerfully bullish and nuclear the only real solution to the global energy problem, I cannot see getting hurt despite the modest overbought conditions it moved into on Friday before backing off.


Important Disclosures:

  1. As of the date of this article, officers and/or employees of Streetwise Reports LLC (including members of their household) own securities of Cameco Corp.
  2. Michael Ballanger: I, or members of my immediate household or family, own securities of: Cameco Corp. My company has a financial relationship with: Cameco Corp. I determined which companies would be included in this article based on my research and understanding of the sector.
  3. Statements and opinions expressed are the opinions of the author and not of Streetwise Reports or its officers. The author is wholly responsible for the validity of the statements. The author was not paid by Streetwise Reports for this article. Streetwise Reports was not paid by the author to publish or syndicate this article. Streetwise Reports requires contributing authors to disclose any shareholdings in, or economic relationships with, companies that they write about. Streetwise Reports relies upon the authors to accurately provide this information and Streetwise Reports has no means of verifying its accuracy.
  4.  This article does not constitute investment advice. Each reader is encouraged to consult with his or her individual financial professional. By opening this page, each reader accepts and agrees to Streetwise Reports’ terms of use and full legal disclaimer. This article is not a solicitation for investment. Streetwise Reports does not render general or specific investment advice and the information on Streetwise Reports should not be considered a recommendation to buy or sell any security. Streetwise Reports does not endorse or recommend the business, products, services or securities of any company.

For additional disclosures, please click here.

Michael Ballanger Disclosures

This letter makes no guarantee or warranty on the accuracy or completeness of the data provided. Nothing contained herein is intended or shall be deemed to be investment advice, implied or otherwise. This letter represents my views and replicates trades that I am making but nothing more than that. Always consult your registered advisor to assist you with your investments. I accept no liability for any loss arising from the use of the data contained on this letter. Options and junior mining stocks contain a high level of risk that may result in the loss of part or all invested capital and therefore are suitable for experienced and professional investors and traders only. One should be familiar with the risks involved in junior mining and options trading and we recommend consulting a financial adviser if you feel you do not understand the risks involved.

Weak economic data weakens energy demand. The Bank of England is thinking about cutting rates next year

By JustMarkets

As of Tuesday’s stock market close, the Dow Jones Index (US30) added 0.17%, while the S&P 500 Index (US500) increased by 0.28%. The NASDAQ Technology Index (US100) closed positive by 0.90% on Tuesday. The S&P 500 (US500 and NASDAQ (US100) indices hit 3-week highs yesterday, while the Dow Jones (US30) updated a one-month-high. But by the end of the trading day, the indices began to lose upward momentum amid hawkish FOMC comments.

The comments from Fed officials on Tuesday eased speculation that the Fed had stopped raising interest rates and proved bullish for the dollar. Minneapolis FRB President Kashkari said that while there has been encouraging inflation data for three months, it is not enough, and “we need to let the data continue to come to us to see if we have really put the inflation genie back in the bottle.” Chicago Fed President Goolsbee also said that the top priority for policymakers is to get inflation back to target, and the Fed does not want to commit to interest rate decisions in advance.

The latest economic data showed the US trade deficit for September widened to $61.5 billion from $58.7 billion in August, exceeding expectations of $59.8 billion.

Equity markets in Europe were mostly down yesterday. Germany’s DAX (DE40) rose by 0.11%, France’s CAC 40 (FR40) fell by 0.39%, Spain’s IBEX 35 (ES35) lost 0.12%, and the UK’s FTSE 100 (UK100) closed negative by 0.10%.

German industrial production for September fell by 1.4% m/m, which was stronger than expectations of 0.1% m/m. The S&P German Construction PMI for October fell by 1.0 to 38.3, a record rate of contraction. The Eurozone’s Producer Price Index (displays the rate of inflation between factories) for September fell to 12.4% y/y, a record high since data collection began in 1982. All data is negative for the European currency.

Rapid wage growth in the Eurozone could keep inflation high for longer, and the European Central Bank should keep interest rates at or near record highs until next year to extinguish price pressures, the International Monetary Fund said on Wednesday.

Bank of England Chief Economist Pill hinted that an interest rate cut could come by the middle of next year. Markets now expect a 0.75% rate cut next year.

The strengthening of the US dollar on Tuesday had a negative impact on energy prices. In addition, weakening demand for oil led to a sell-off in the commodity after Chinese export shipments fell more than expected in October. As a result, crude oil (WTI) fell to a 3-month low, and gasoline fell to a 4-week low. However, investors should not forget that OPEC+ countries have extended production cuts until the end of the year and are likely to extend these quotas for the next year, so traders should not expect a strong drop in oil prices.

Asian markets were mostly declining yesterday. Japan’s Nikkei 225 (JP225) was down by 1.34% on Tuesday, China’s FTSE China A50 (CHA50) lost 0.66%, Hong Kong’s Hang Seng (HK50) decreased by 1.65% for the day, and Australia’s ASX 200 (AU200) was negative by 0.29% for Tuesday.

Chinese regulators held a symposium with several major property developers, including China Vanke Co Ltd, Poly Real Estate Group Co Ltd, and Longfor Properties Co Ltd, to assess their financial situation amid a prolonged slump in the real estate market. The news boosted hopes that the government would provide additional support for the weakened real estate sector, which has faced a series of high-profile defaults in recent years. However, sentiment towards China is still intact after weak trade balance data for October. The focus will now turn to China’s inflation data for the month, due for release on Thursday.

Bank of Japan Governor Kazuo Ueda said Wednesday that the central bank doesn’t necessarily have to wait for inflation-adjusted wage growth to turn positive before ending loose monetary policy. Ueda said the passive effect of rising import prices should fade, and wages and inflation need to rise in tandem for the BOJ to consider an exit from ultra-loose policy. Analysts expect Japan’s inflation-adjusted real wages, which fell for the 18th consecutive month in September, to continue falling next year as wage growth fails to catch up with persistent price increases.

S&P 500 (F)(US500) 4,378.38 +12.40 (+0.28%)

Dow Jones (US30) 34,152.60 +56.74 (+0.17%)

DAX (DE40)  15,152.64 +16.67  (+0.11%)

FTSE 100 (UK100) 7,410.04 −7.72 (−0.10%)

USD Index  105.51 +0.29 (+0.28%)

News feed for 2023.11.08:
  • – New Zealand Inflation Expectations (q/q) at 04:00 (GMT+2);
  • – German Consumer Price Index (m/m) at 09:00 (GMT+2);
  • – UK BoE Gov Bailey Speaks (m/m) at 11:30 (GMT+2);
  • – Eurozone Retail Sales (m/m) at 12:00 (GMT+2);
  • – Canada Building Permits (m/m) at 15:30 (GMT+2);
  • – US Fed Chair Powell Speaks at 16:15 (GMT+2);
  • – US Crude Oil Reserves (w/w) at 17:30 (GMT+2);
  • – US FOMC Member Barr Speaks at 21:00 (GMT+2).

By JustMarkets


This article reflects a personal opinion and should not be interpreted as an investment advice, and/or offer, and/or a persistent request for carrying out financial transactions, and/or a guarantee, and/or a forecast of future events.

Mid-Week Technical Outlook: Oil closes below 200-day SMA

By ForexTime 

  • Crude dives over 4% in previous session
  • Prices secure daily close below 200-day SMA
  • Monthly and weekly timeframe signal further downside
  • Bears in control on D1 charts but RSI near oversold territory
  • Key levels of interest at $82, $78 and $74

Oil struggled on Wednesday after sliding more than 4% in the previous session to levels not seen since July.

The global commodity was hammered by demand concerns which provided a platform for bears to drag prices below the 200-day Simple Moving Average (SMA) for the first time in over three months.

It is worth noting that technical indicators were already in favour of bears before yesterday’s steep selloff. Oil was already respecting a negative channel on the daily charts, creating lower lows and lower highs. The daily close below the 200-day SMA may open doors to lower price levels in the short to medium term.

Zooming out to the weekly charts, we see a similar bearish picture with crude on the path to securing its third negative trading week. Prices have broken through the $80 weekly support with the next key level of interest on the W1 timeframe around $73 and $68.

Peeking at the monthly charts, the bearish candlestick created in October further supports the bearish case, signaling the possibility of lower prices to come with key monthly support found at $66.50.

Redirecting our attention back to the daily timeframe, bears are certainly in control and may use the current momentum to drag crude toward the next daily support at $74. However, the Relative Strength Index (RSI) is flirting near 30, indicating that crude may be oversold. While this could trigger a technical rebound down the road, the path of least resistance remains south.

  • Sustained weakness below the 200-day SMA may send prices towards $74 and $72.50.

  • Should prices push back above the 200-day SMA, this could spark a move back towards $82


Forex-Time-LogoArticle by ForexTime

ForexTime Ltd (FXTM) is an award winning international online forex broker regulated by CySEC 185/12 www.forextime.com

77% of under-40s prefer Bitcoin over gold as investment

By George Prior 

More than three-quarters of under 40s would rather Bitcoin than gold in their investment mix, reveals a new survey by one of the world’s largest independent financial advisory, asset management and fintech organizations.

The deVere Group poll shows that 77% of clients aged under 40 would opt for the cryptocurrency over the precious metal in their portfolios to build their long-term wealth opportunities, indicating a resounding shift in the investment landscape.

While gold has traditionally been considered a safe-haven asset and a store of value, younger generations now see Bitcoin (BTC) as a more dynamic and potentially rewarding investment.

Year-to-date, BTC is up 112.75%.

In comparison, on Wall Street, the S&P 500 is up 13.97%, the Dow Jones 2.79% and the Nasdaq 29.76%.

Of the survey, deVere Group CEO Nigel Green says: “An overwhelming majority of respondents under the age of 40 expressed a clear preference for Bitcoin over gold as an integral part of their investment mix. This trend signals a notable shift away from traditional investment assets towards the digital realm.

“Younger generations are more familiar with digital assets and the tech that underpins them. Bitcoin represents a digital-native investment option that aligns with their understanding of technology and their belief in the future of digital currencies. The rise of online transactions and digital payments also underscores the relevance of digital assets like Bitcoin.

“Respondents also cited the potential for high returns as a driving factor in their preference for Bitcoin. The cryptocurrency’s track record of significant price appreciation seems to have caught the attention of younger generations.”

Large financial institutions and corporations are integrating Bitcoin into their investment strategies and balance sheets. This institutional support lends legitimacy to Bitcoin and can further fuel its adoption, making it more appealing to younger investors.

In addition, its divisibility and ease of transfer across borders make it a versatile asset for individuals looking to diversify their investment portfolios. Liquid markets and 24/7 trading give the cryptocurrency an advantage over gold in terms of flexibility.

“In recent times, concerns about inflation will have likely driven Bitcoin’s appeal to investors too. Bitcoin’s fixed supply of 21 million coins is seen as a potential hedge against the devaluation of fiat currencies, making it a desirable asset for wealth preservation.”

While Bitcoin’s allure is undeniable, individuals should carefully assess their risk tolerance and diversify their investments to manage potential downsides, given the inherent volatility of cryptocurrencies.

This latest survey, with more than 750 clients from around the world, shows that the digitalisation of assets is a reality that the financial services sector can no longer ignore.

“Bitcoin is at the forefront of this paradigm shift, and its unique properties make it a favored investment option for a generation that values innovation, accessibility, and the potential for substantial returns,” concludes Nigel Green.

About:

deVere Group is one of the world’s largest independent advisors of specialist global financial solutions to international, local mass affluent, and high-net-worth clients.  It has a network of offices across the world, over 80,000 clients and $12bn under advisement.

The RBA expectedly raised the rate by 0.25%. OPEC+ countries will maintain crude oil production cuts until the end of the year

By JustMarkets

At Monday’s stock market close, the Dow Jones Index (US30) added 0.10%, while the S&P 500 Index (US500) increased by 0.18%. The NASDAQ Technology Index (US100) closed positive by 0.30% on Monday. Stocks rose on Monday on the back of positive developments from last Friday, when a weaker-than-expected October US jobs report and October ISM services report showed a slowing economy that could keep the Federal Reserve from raising interest rates and even start lowering them by the middle of next year.

On Monday, optimistic comments from Fed Vice Chair Brainard were favorable for stocks when she said the economy is performing exceptionally well and is near the point of sustained growth, with most forecasters dismissing the issue of recession. Currently, markets are pricing in a 10% probability of a 25 bps rate hike at the next FOMC meeting on December 12-13 and an 18% probability of a 25 bps rate hike at the January 30-31, 2024 FOMC meeting.

Booking Holdings (BKNG) shares closed higher by more than 4% after D.A. Davidson upgraded the stock from Neutral to Buy with a price target of $2,400. Airbnb (ABNB) shares were down more than 3% yesterday after Italy’s financial police confiscated €779 million ($835 million) from the company due to failure to pay a portion of taxes.

Growth in Canadian economic activity accelerated slightly in October, while a measure of prices fell to its lowest level in six months. The seasonally adjusted index rose to 53.4 from 53.1 in September. It was the third consecutive month the index exceeded the 50 threshold, indicating the sector is expanding.

Equity markets in Europe were mostly down yesterday. Germany’s DAX (DE40) decreased by 0.35%, France’s CAC 40 (FR40) fell by 0.48% yesterday, Spain’s IBEX 35 (ES35) lost 0.56% and the UK’s FTSE 100 (UK100) closed around its opening price.

According to a survey released on Tuesday, the pace of growth in UK consumer spending last month was the slowest in more than a year, reflecting concerns about the cost of living in the run-up to Christmas. The Bank of England raised interest rates for 14 consecutive meetings until August this year. Last week, it said it planned to keep them at a 15-year high to keep inflation down, although it said the economy was stagnant and so far, the effect of the rate hikes had only been half felt.

Crude oil and gasoline prices closed moderately higher on Monday after Saudi Arabia and Russia confirmed they would maintain crude production cuts through the end of the year. The 23-nation OPEC+ coalition will meet again on November 26 to review oil production policy for 2024.

Asian markets were predominantly up yesterday. Japan’s Nikkei 225 (JP225) jumped by 2.37% on Monday, China’s FTSE China A50 (CHA50) added 0.75%, Hong Kong’s Hang Seng (HK50) was up by 1.71% on the day, and Australia’s ASX 200 (AU200) was positive by 0.28% on Monday.

The Reserve Bank of Australia (RBA) expectedly to raise the interest rate by 0.25%. But the Australian dollar fell more than 0.8% as the rate hike was accompanied by softening language on the need for further increases. The RBA said in a statement that the recent rise in inflation is not material to an increase in the inflation outlook, with the impact of past rate hikes not yet fully reflected in the real economy, so there are reasons not to raise rates further.

Japanese household spending fell by 2.8% year-on-year in September, marking the seventh consecutive monthly decline, as households cut spending on food and other goods amid rising prices with real wages continuing to fall.

Chinese exports contracted more than expected in October amid deteriorating overseas demand, while an unexpected rise in imports caused China’s trade surplus to shrink to its lowest level in 17 months. The trade data showed continued headwinds for the Chinese economy, especially amid deteriorating economic conditions in China’s largest trading countries − Europe and the United States.

S&P 500 (F)(US500) 4,365.98 +7.64 (+0.18%)

Dow Jones (US30) 34,095.86 +34.54 (+0.10%)

DAX (DE40)  15,135.97 −53.28 (−0.35%)

FTSE 100 (UK100) 7,417.76 +0.03 (+0.01%)

USD Index  105.29 +0.27 (+0.26%)

News feed for 2023.11.07:
  • – China Trade Balance (m/m) at 05:00 (GMT+2);
  • – Australia RBA Interest Rate Decision at 05:30 (GMT+2);
  • – Australia RBA Rate Statement at 05:30 (GMT+2);
  • – Switzerland Unemployment Rate (m/m) at 08:45 (GMT+2);
  • – German Industrial Production (m/m) at 09:00 (GMT+2);
  • – Eurozone Producer Price Index (m/m) at 12:00 (GMT+2);
  • – US Trade Balance (m/m) at 15:30 (GMT+2);
  • – Canada Trade Balance (m/m) at 15:30 (GMT+2);
  • – US FOMC Member Williams Speaks at 19:00 (GMT+2).

By JustMarkets


This article reflects a personal opinion and should not be interpreted as an investment advice, and/or offer, and/or a persistent request for carrying out financial transactions, and/or a guarantee, and/or a forecast of future events.

EURUSD Sustains Strength Near Six-Week Highs

By RoboForex Analytical Department

The EUR/USD currency pair remains steadfast near 1.0710 on Tuesday, maintaining proximity to the six-week highs set the previous day.

The U.S. dollar has seen a tempered performance, influenced by recent U.S. labor market statistics for October and the resultant stock market adjustments. The data pointed to pockets of weakness in the employment sector, leading investors to infer that the cooling may be an effect of tighter credit and monetary policies. Consequently, there has been a recalibration of expectations regarding the trajectory of future Federal Reserve rate hikes.

In detail, the U.S. unemployment rate edged up to 3.9%, slightly higher than the previous 3.8%. Nonfarm payrolls showed an increase of 150 thousand, which was shy of the forecasted 178 thousand. Additionally, the average wage increment was a modest 0.2% month-over-month, missing the anticipated mark.

Market sentiment now appears to lean towards the belief that the current interest rates may represent the zenith of the present monetary tightening cycle.

EUR/USD technical analysis

On the H4 chart for EUR/USD, the currency pair has attained the correctional target at 1.0755. The trend now seems to be tilting downwards, with a trajectory set towards the 1.0655 level. A consolidation phase around this mark is probable. A break below this consolidation could signal a further decline to 1.0633, and potentially, should this support give way, a fall to 1.0515 could be on the horizon. The MACD indicator suggests a peak formation, with its signal line at the highs and anticipating a downturn.

The H1 chart reveals a continuation of the downward wave targeting 1.0655. Should the pair touch this level, a corrective move upwards to around 1.0700 might ensue. Subsequent to this correction, the market may witness a renewed descent towards 1.0633. The Stochastic oscillator provides technical affirmation for this bearish outlook, with its signal line dropping below 50 and aiming for the 20 level.

Disclaimer

Any forecasts contained herein are based on the author’s particular opinion. This analysis may not be treated as trading advice. RoboForex bears no responsibility for trading results based on trading recommendations and reviews contained herein.

SPX500 _m in “impasse” after stunning rally

By ForexTime 

  • SPX500_m printed a doji candlestick on Monday
  • Doji candlestick reveals traders’ indecision
  • Bulls see impasse as calm before surge to 4400
  • Countertrend opportunity beckons for bears
  • Benchmark stock index still exposed to US Treasury yields moves


SPX500_m may revert to one of its widely-followed moving averages, following the mute session on Monday 6th November.

Note how this index posted a doji on the daily timeframe yesterday.

 A doji candlestick typically reveals traders’ indecision.

Hence, Monday’s candlestick formation on the daily timeframe implies that traders are on the hunt for a fresh reason, either to extend the recent surge, or pull back.


SPX500_m bulls may have entered an impasse after last Friday’s (November 3rd) breakout of a downward sloping channel drawn from the September 14th close .

The index is currently sitting well above its 21-day simple moving average (SMA) and the bears may see an opportunity to retest these key support areas:

  • 50-day SMA
  • 4339.0: the 78.6 Fibonacci level
  • 4313.7: downward channel resistance (now acting as support)
  • 4289.2: 21-day SMA converging with the golden 61.8 Fibonacci level


A break back into the downward-sloping channel, with a solid close below its golden 61.8 Fibonacci level at 4289.0, may see a further decline in the SPX500_m where bears may set sights on new lows below 4106.0.

The Fibonacci retracement level is drawn from the October 12th high of 4402 to the October 27th low of 4106.0.


From a bullish perspective, this impasse may be the calm before another raging rally.

The S&P 500 may persist with its gains if investors keep hold of the perception that US bond yields have peaked and could unwind further.

A failure to retest the support areas mentioned above, or a failure to hold a close below 4313.7, may see SPX500_m bulls aim for highs above 4400.


Forex-Time-LogoArticle by ForexTime

ForexTime Ltd (FXTM) is an award winning international online forex broker regulated by CySEC 185/12 www.forextime.com